Daily Technical Report
April 18, 2013
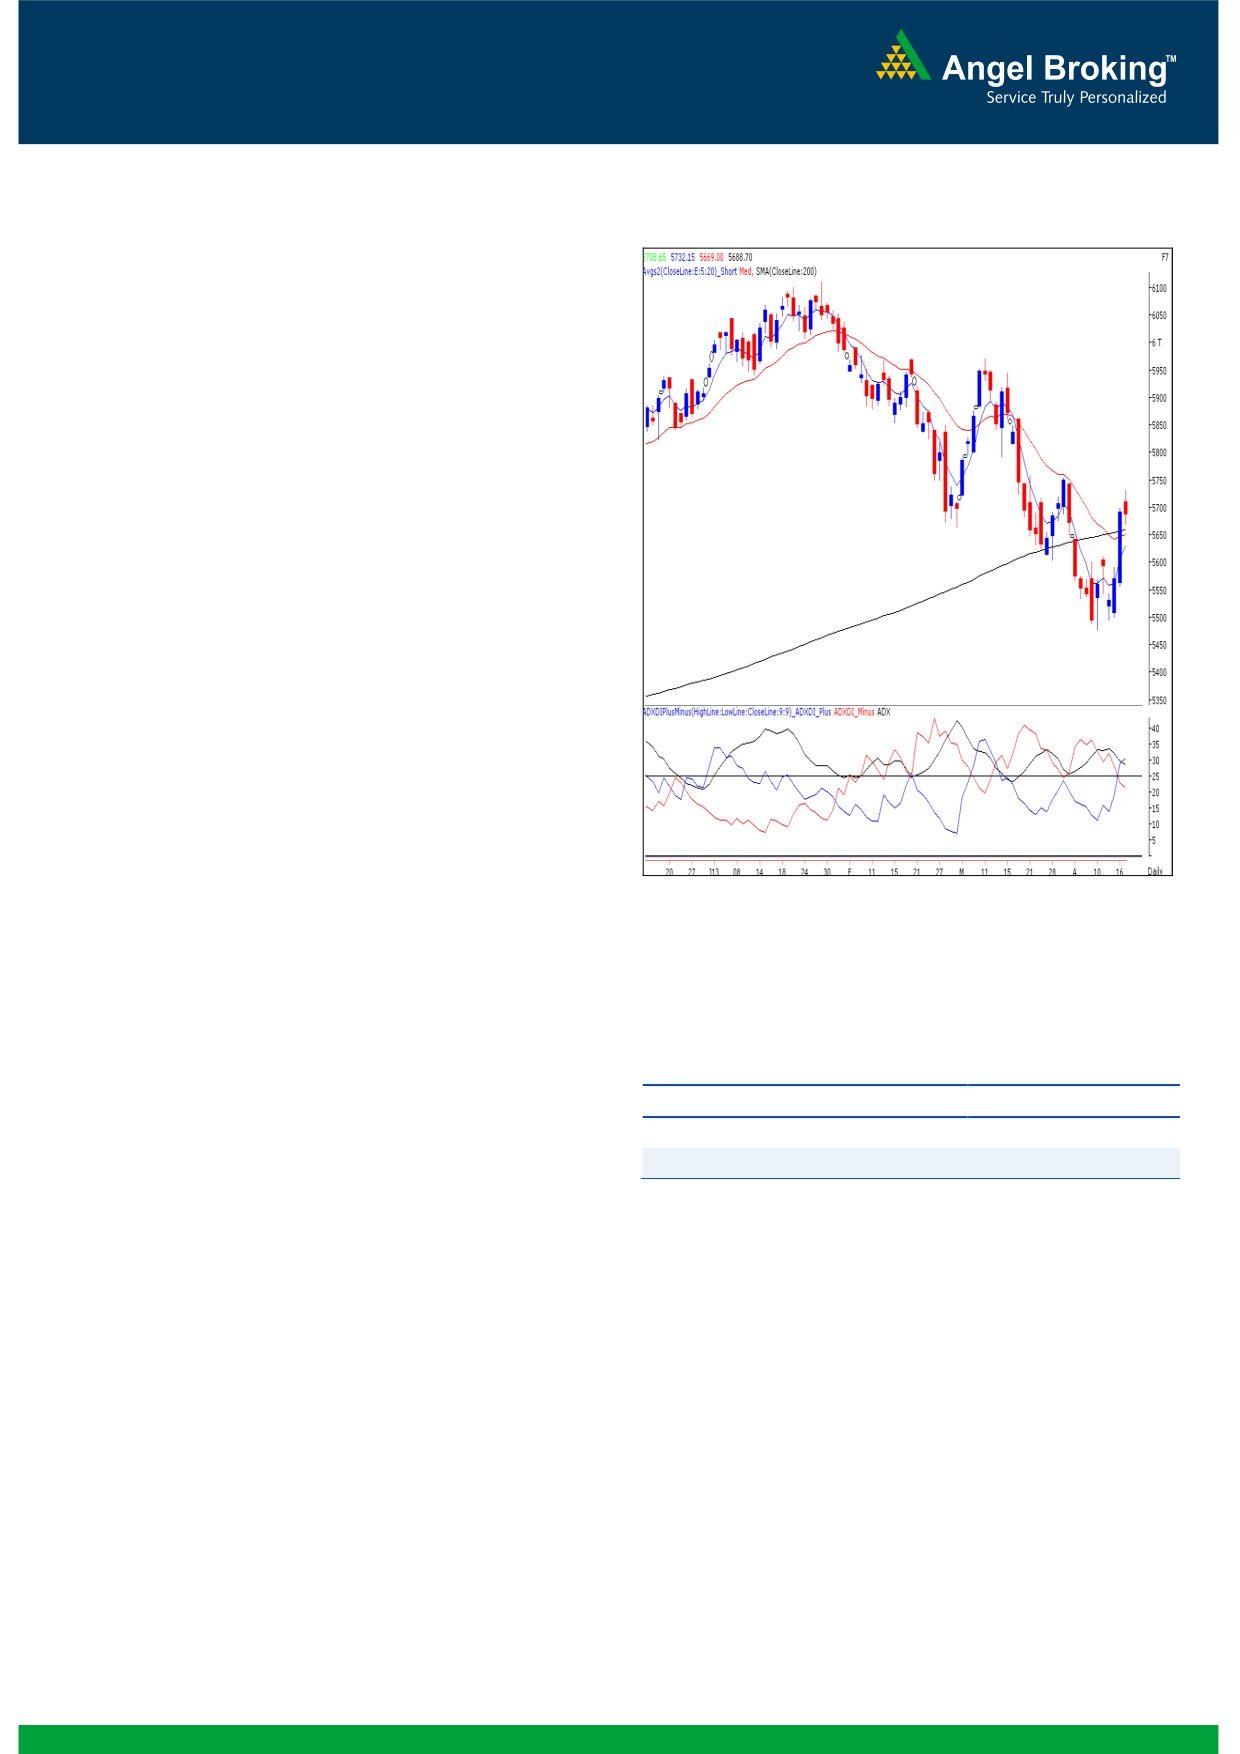
Exhibit 1: Nifty Daily Chart
Sensex (18731) / NIFTY (5689)
Yesterday, indices opened marginally higher in-line with
positive global cues. Subsequently, indices moved higher to
register a high of 18870 / 5732. However, post midsession,
indices faced strong selling pressure at higher levels and
eventually closed on a flat note. During the day Oil & Gas, IT
and Teck counters were among the major losers whereas
Metal, FMCG and Auto counters ended with gains. The
advance to decline ratio was in marginally in favor of
declining counters (A=1128 D=1199)
(Source-
Formation
The ’20-week EMA’ and the ’20-day EMA’ are placed at
18987 / 5748 and 18692 / 5650 levels, respectively.
The ’89-week EMA’ and the ‘200-day SMA’ are placed
at 18203 / 5506 and 18657 / 5656, respectively.
The ‘Lower Top Lower Bottom’ formation on weekly
chart is still intact.
Source: Falcon:
We are observing a ‘Spinning Top’ (only in Nifty)
Japanese candlestick pattern on the weekly chart.
Trading strategy:
Actionable points:
Tuesday’s strong rally was followed by a gap up opening in
View
Bullish Above 5732
yesterday’s sessions but indices failed to sustain at higher
Expected Targets
5755 - 5780
levels and trimmed all early gains during the second half.
Support levels
5669 - 5611
Yesterday’s price action has resulted in ‘Narrow Range’ body
formation. This candlestick pattern indicates slight
uncertainty among market participants. Hence, any
sustainable move below yesterday’s low of 18673 / 5669
may lead to a further intraday correction towards 18600 -
18525 / 5653
- 5625 levels. However, in the above
mentioned scenario also, the short term trend remains
bullish. The positive impact of daily ‘RSI-Smoothened’
oscillator and ‘ADX (9)’ indicator would be seen once indices
sustain above yesterday’s high of 18870 / 5732. In this
scenario, indices may rally towards 19061 - 19100 / 5755 -
5780 levels in coming trading sessions.
1
Daily Technical Report
April 18, 2013
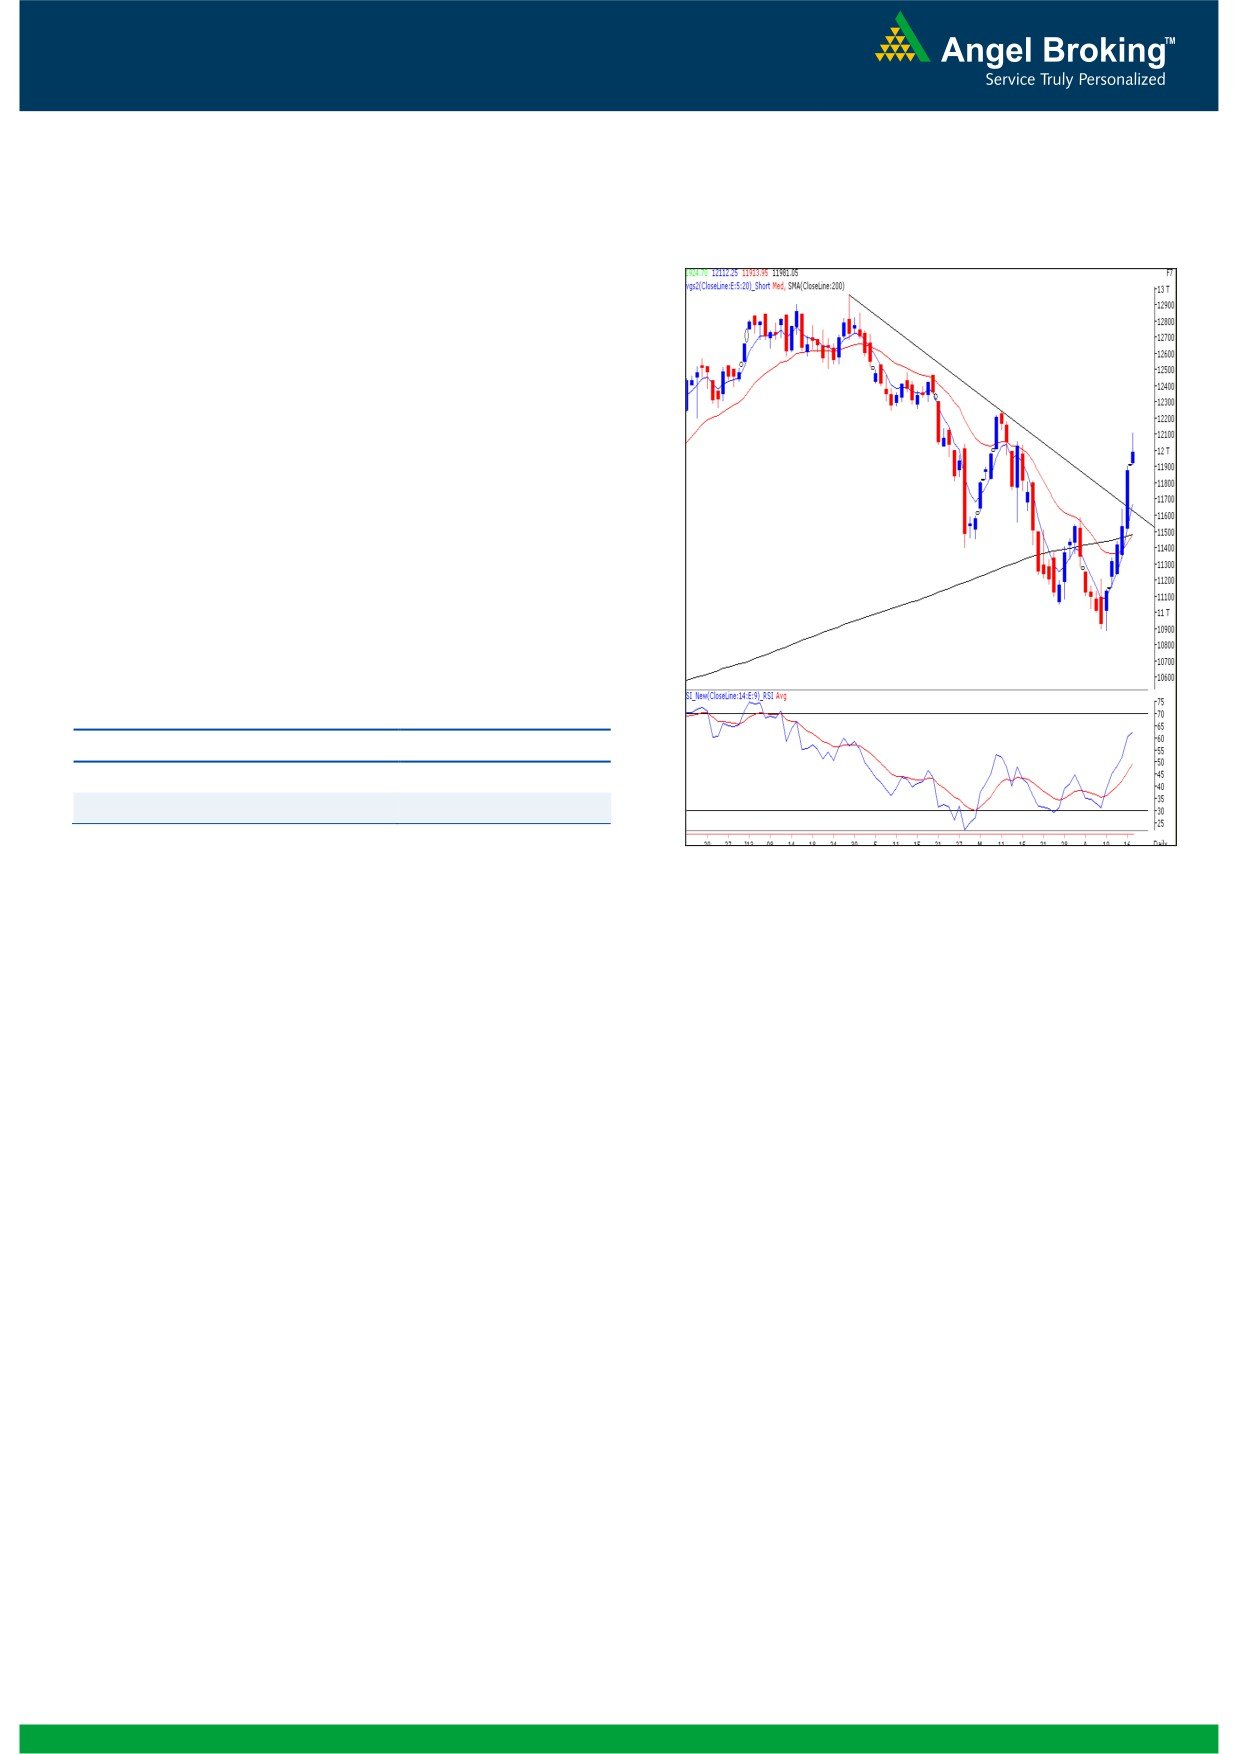
Exhibit 2: Bank Nifty Daily Chart
Bank Nifty Outlook - (11981)
Yesterday, Bank Nifty opened with an upside gap and
thereafter tested the mentioned target of 12100. However
during the second half we witnessed some profit booking
which led the index to close with minor gains. There is no
significant change in the overall chart structure and the
momentum oscillator on the daily chart (RSI) continues to
be positive. Hence we reiterate our view that any dip in
the index should be used to create fresh long positions for
higher targets of 12241 - 12515 levels. Positional traders
holding long position in the Bank Nifty should maintain a
stop loss of 11480 levels. On the downside 11913 -
11743 levels are likely to act as support.
Actionable points:
View
Bullish Above 12112
Expected Target
12241 - 12515
Support Levels
11913 - 11743
Source: Falcon:
2
Daily Technical Report
April 18, 2013
Research Team Tel: 022 - 30940000
DISCLAIMER
This document is solely for the personal information of the recipient, and must not be singularly used as the basis of any investment
decision. Nothing in this document should be construed as investment or financial advice. Each recipient of this document should make
such investigations as they deem necessary to arrive at an independent evaluation of an investment in the securities of the companies
referred to in this document (including the merits and risks involved), and should consult their own advisors to determine the merits and
risks of such an investment.
Angel Broking Limited, its affiliates, directors, its proprietary trading and investment businesses may, from time to time, make
investment decisions that are inconsistent with or contradictory to the recommendations expressed herein. The views contained in this
document are those of the analyst, and the company may or may not subscribe to all the views expressed within.
Reports based on technical and derivative analysis center on studying charts of a stock's price movement, outstanding positions and
trading volume, as opposed to focusing on a company's fundamentals and, as such, may not match with a report on a company's
fundamentals.
The information in this document has been printed on the basis of publicly available information, internal data and other reliable
sources believed to be true, but we do not represent that it is accurate or complete and it should not be relied on as such, as this
document is for general guidance only. Angel Broking Limited or any of its affiliates/ group companies shall not be in any way
responsible for any loss or damage that may arise to any person from any inadvertent error in the information contained in this report.
Angel Broking Limited has not independently verified all the information contained within this document. Accordingly, we cannot testify,
nor make any representation or warranty, express or implied, to the accuracy, contents or data contained within this document. While
Angel Broking Limited endeavors to update on a reasonable basis the information discussed in this material, there may be regulatory,
compliance, or other reasons that prevent us from doing so.
This document is being supplied to you solely for your information, and its contents, information or data may not be reproduced,
redistributed or passed on, directly or indirectly.
Angel Broking Limited and its affiliates may seek to provide or have engaged in providing corporate finance, investment banking or
other advisory services in a merger or specific transaction to the companies referred to in this report, as on the date of this report or in
the past.
Neither Angel Broking Limited, nor its directors, employees or affiliates shall be liable for any loss or damage that may arise from or in
connection with the use of this information.
Note: Please refer to the important `Stock Holding Disclosure' report on the Angel website (Research Section). Also, please refer to the
latest update on respective stocks for the disclosure status in respect of those stocks. Angel Broking Limited and its affiliates may have
investment positions in the stocks recommended in this report.
Research Team
Shardul Kulkarni
-
Head - Technicals
Sameet Chavan
-
Technical Analyst
Sacchitanand Uttekar
-
Technical Analyst
Ankur Lakhotia
-
Technical Analyst
Angel Broking Pvt. Ltd.
Registered Office: G-1, Ackruti Trade Centre, Rd. No. 7, MIDC, Andheri (E), Mumbai - 400 093.
Corporate Office: 6th Floor, Ackruti Star, MIDC, Andheri (E), Mumbai - 400 093. Tel: (022) 30940000
Sebi Registration No: INB 010996539
4