Daily Technical Report
March 18, 2013
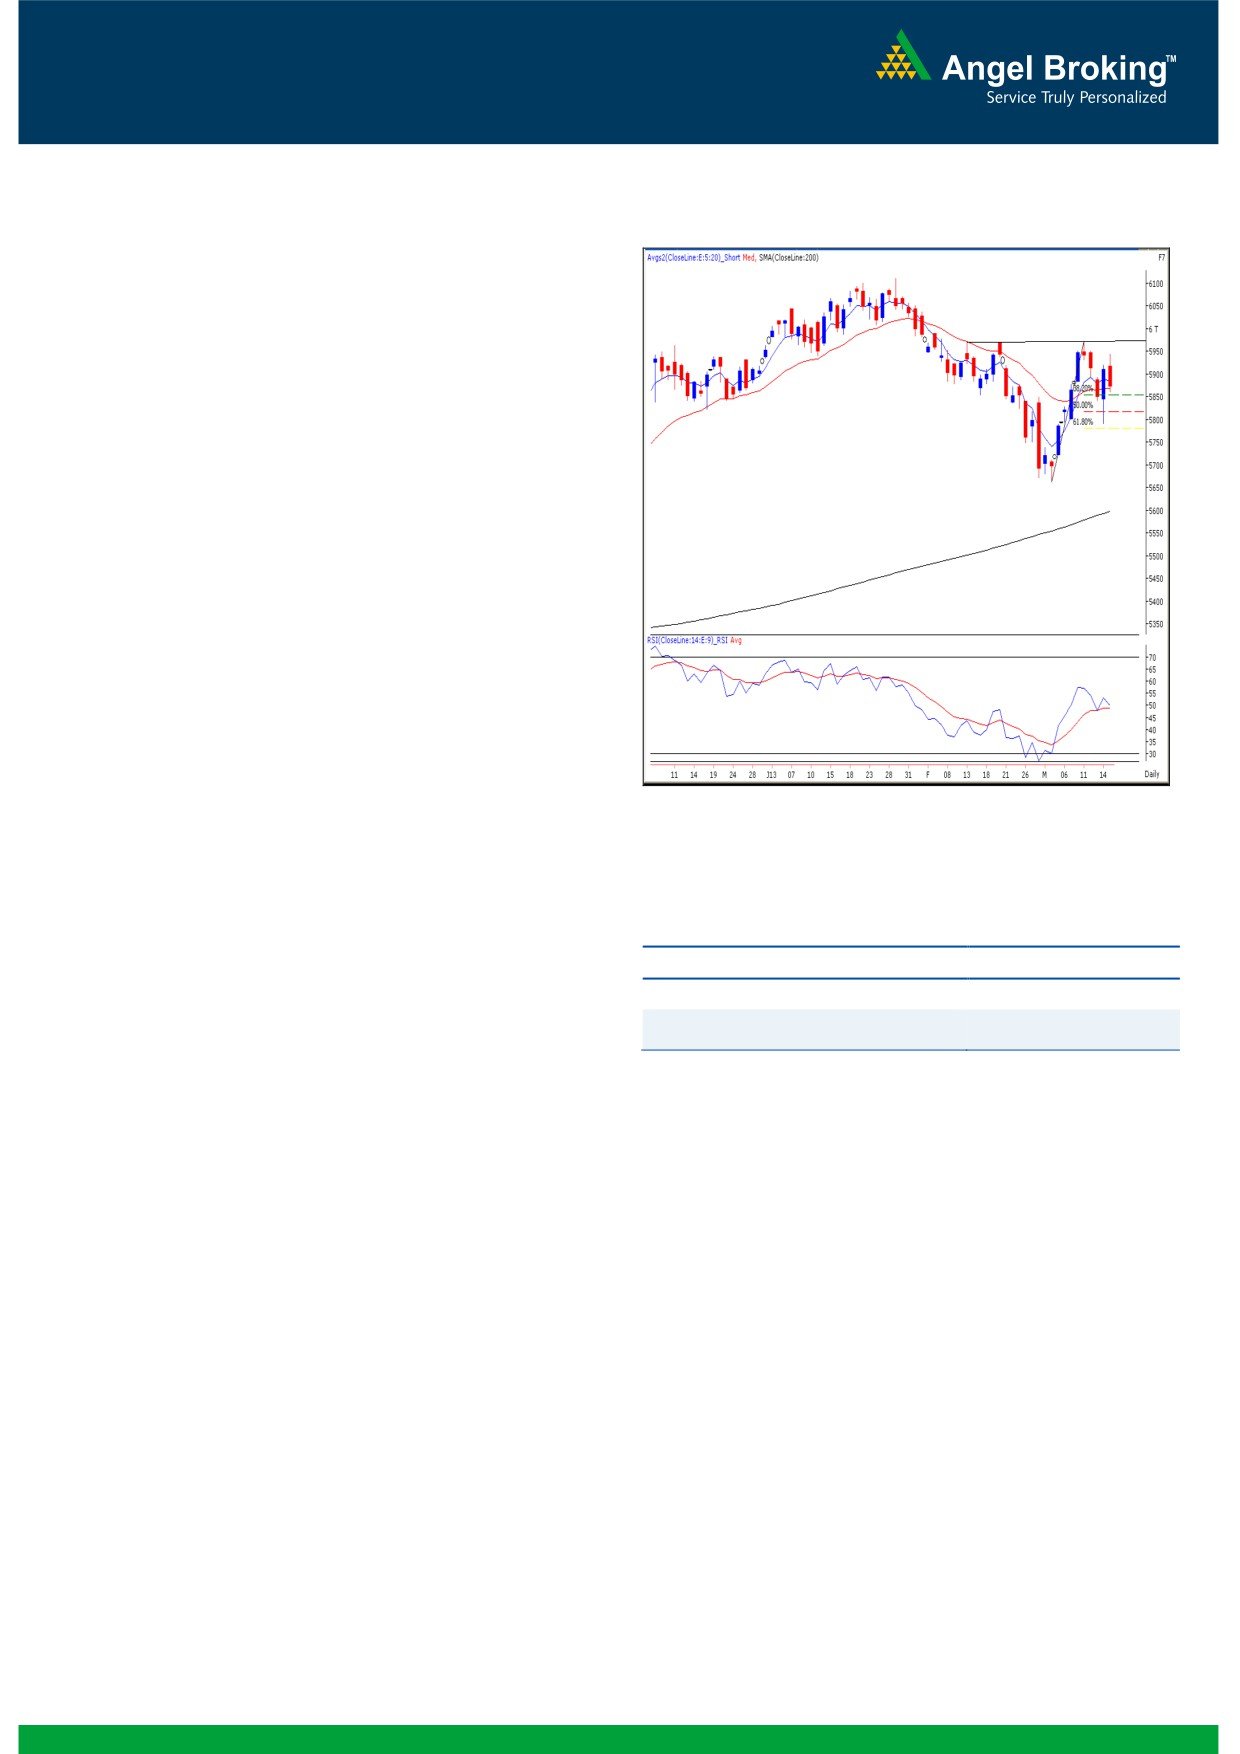
Exhibit 1: Nifty Daily Chart
Sensex (19428) / NIFTY (5873)
On Friday, indices opened on a flat note as indicated by the
in line with other Asian markets. Subsequently, indices pared
all gains to close in the negative territory. The Realty,
Banking and Oil & Gas counters were among the major
losers; whereas Consumer Durables was the only sector that
gained ground. The advance to decline ratio was in favor of
declining
counters
(A=1114 D=1754) (Source-
Formation
The ’20-day EMA’ and the ’20-week EMA’ are placed at
19410 / 5869 and 19244 / 5830 levels, respectively.
The weekly chart exhibits a ‘Bullish Engulfing’ pattern but
the monthly chart exhibits a ‘Bearish Engulfing’ pattern.
Indices have closed above the ‘Downward Sloping Trend
Line’, drawn by joining two significant highs of 21109 /
Source: Falcon:
6339 (high of November 05, 2010 weekly candle) and
19137 / 5816 (high of October 05, 2012 weekly
candle).
Actionable points:
Trading strategy:
The first half of the concluded week was undoubtedly
View
Bearish Below 5861
dominated by the bears. However, the second half turned
Expected target
5790 - 5750
out to be directionless as we witnessed very sharp
5946 - 5971
Resistance levels
movements on both sides. Indices have not confirmed the
weekly ‘Bullish Engulfing’ pattern mentioned in our earlier
report. Going forward, only a sustainable move beyond this
week’s high of 19755 / 5971 would confirm the above
mentioned pattern as well as the breakout from the probable
‘Inverse Head and Shoulder’ pattern. In such a scenario, we
may witness strong buying interest among market
participants. Indices may then resultantly rally towards
19768 - 19865 / 5991 - 6025 or even re-test the recent
swing high of 20204 / 6112. Conversely, the week’s low of
19179 / 5791 poses as a key support level in the coming
trading sessions. Any sustainable move below this level
would trigger immense pessimism in the market and indices
may re-test recent swing lows of 18931 - 18760 / 5712 -
5663.
1
Daily Technical Report
March 18, 2013
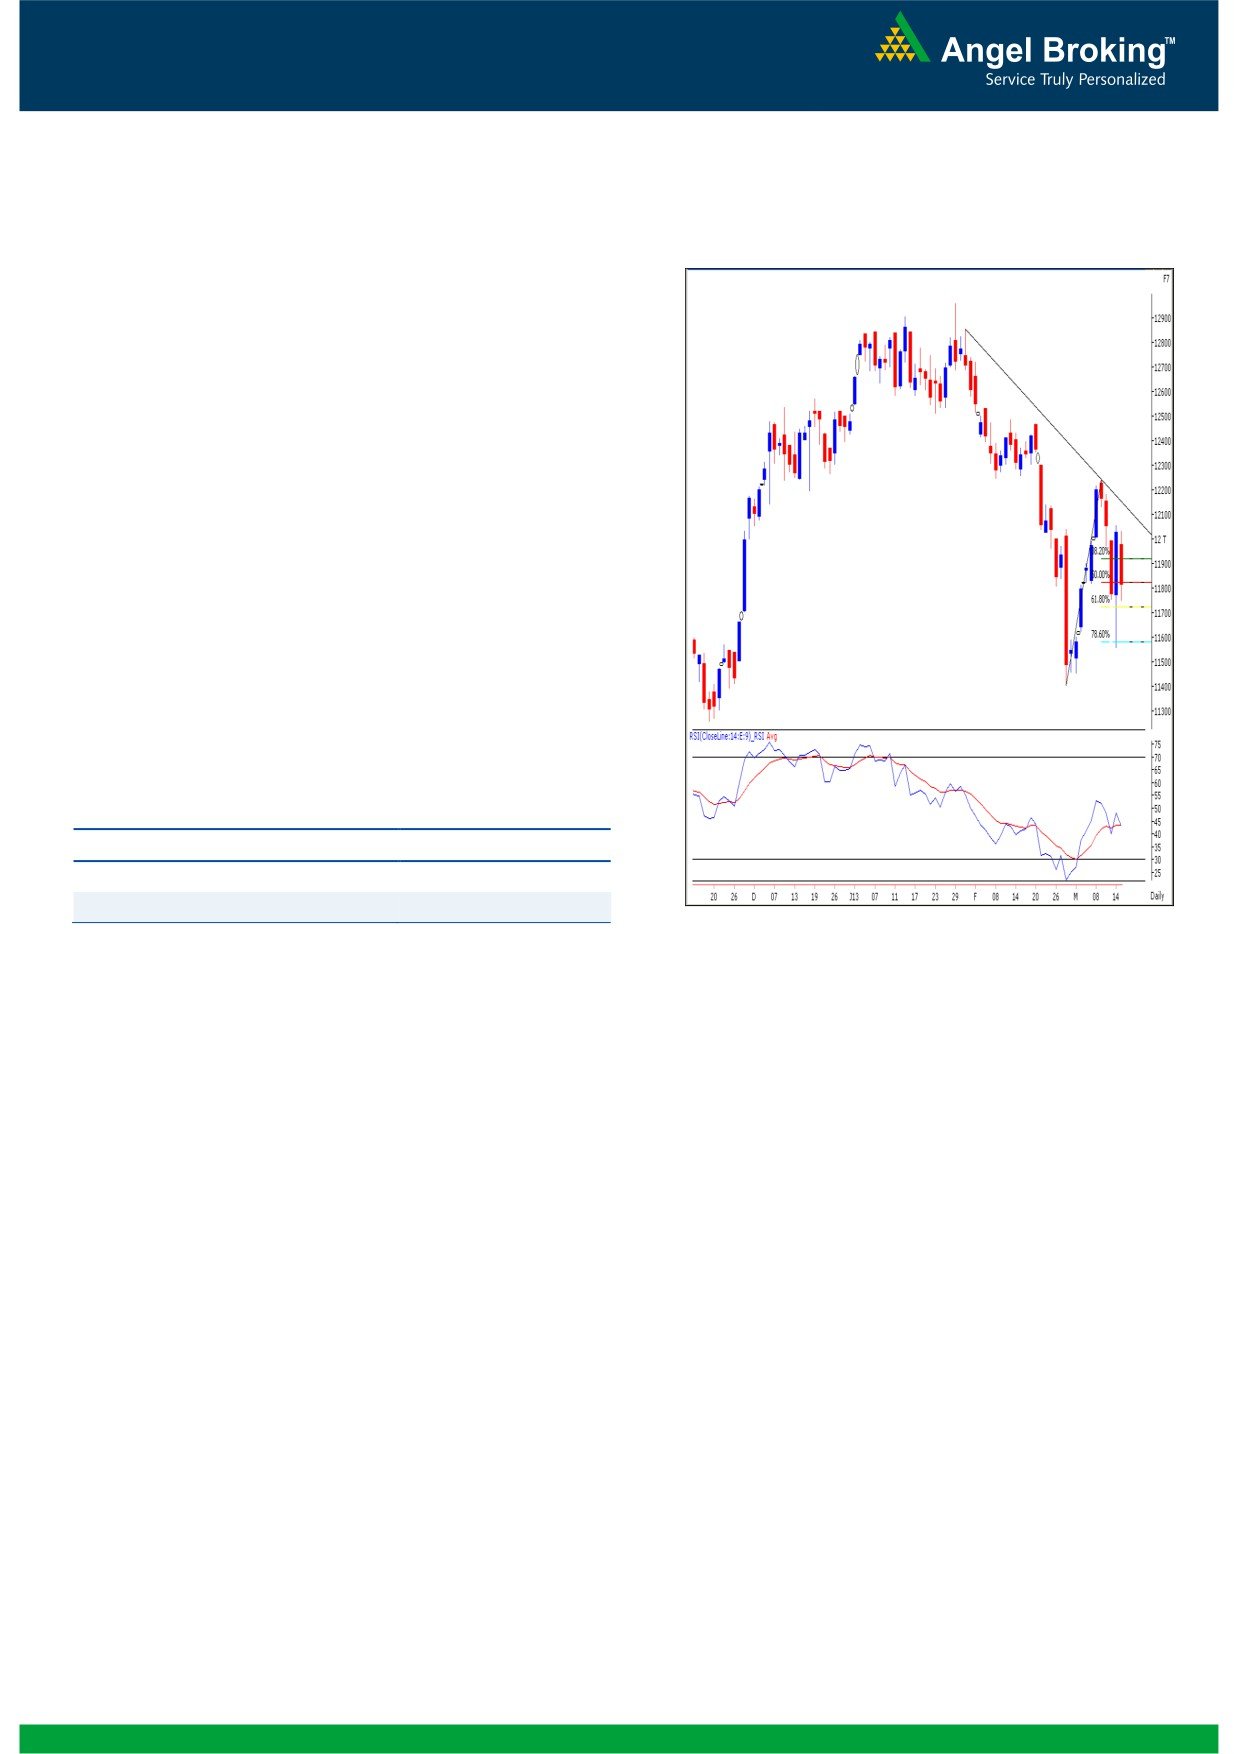
Exhibit 2: Bank Nifty Daily Chart
Bank Nifty Outlook - (11817)
On Friday, Bank Nifty too opened flat in-line with our
benchmark indices and eventually index slipped as the day
progressed to close with a loss of nearly
1.70%. The
momentum oscillators ‘RSI’ on the daily and hourly chart is
near the 50 mark and is indicating a rise in volatility in
coming few sessions. The index has taken support on
Thursday near the 78.6% Fibonacci retracement of the current
rise. This level is likely to act as an intermediate support level
for the index. Only a sustainable move below the 11555
mark would lead to strong selling pressure in the index. On
the upside a move above the 12059 level would attract
further buying interest and the index may rally towards 12107
- 12183 levels. Traders are advised to stay light on positions
as the market nears the RBI monetary policy Tuesday.
Actionable points:
View
Bearish Below 11750
Expected Target
11555
Resistance Levels
12059 - 12107
Source: Falcon:
2
Daily Technical Report
March 18, 2013
Research Team Tel: 022 - 30940000
DISCLAIMER
This document is solely for the personal information of the recipient, and must not be singularly used as the basis of any investment
decision. Nothing in this document should be construed as investment or financial advice. Each recipient of this document should make
such investigations as they deem necessary to arrive at an independent evaluation of an investment in the securities of the companies
referred to in this document (including the merits and risks involved), and should consult their own advisors to determine the merits and
risks of such an investment.
Angel Broking Limited, its affiliates, directors, its proprietary trading and investment businesses may, from time to time, make
investment decisions that are inconsistent with or contradictory to the recommendations expressed herein. The views contained in this
document are those of the analyst, and the company may or may not subscribe to all the views expressed within.
Reports based on technical and derivative analysis center on studying charts of a stock's price movement, outstanding positions and
trading volume, as opposed to focusing on a company's fundamentals and, as such, may not match with a report on a company's
fundamentals.
The information in this document has been printed on the basis of publicly available information, internal data and other reliable
sources believed to be true, but we do not represent that it is accurate or complete and it should not be relied on as such, as this
document is for general guidance only. Angel Broking Limited or any of its affiliates/ group companies shall not be in any way
responsible for any loss or damage that may arise to any person from any inadvertent error in the information contained in this report.
Angel Broking Limited has not independently verified all the information contained within this document. Accordingly, we cannot testify,
nor make any representation or warranty, express or implied, to the accuracy, contents or data contained within this document. While
Angel Broking Limited endeavours to update on a reasonable basis the information discussed in this material, there may be regulatory,
compliance, or other reasons that prevent us from doing so.
This document is being supplied to you solely for your information, and its contents, information or data may not be reproduced,
redistributed or passed on, directly or indirectly.
Angel Broking Limited and its affiliates may seek to provide or have engaged in providing corporate finance, investment banking or
other advisory services in a merger or specific transaction to the companies referred to in this report, as on the date of this report or in
the past.
Neither Angel Broking Limited, nor its directors, employees or affiliates shall be liable for any loss or damage that may arise from or in
connection with the use of this information.
Note: Please refer to the important `Stock Holding Disclosure' report on the Angel website (Research Section). Also, please refer to the
latest update on respective stocks for the disclosure status in respect of those stocks. Angel Broking Limited and its affiliates may have
investment positions in the stocks recommended in this report.
Research Team
Shardul Kulkarni
-
Head - Technicals
Sameet Chavan
-
Technical Analyst
Sacchitanand Uttekar
-
Technical Analyst
Ankur Lakhotia
-
Technical Analyst
Angel Broking Pvt. Ltd.
Registered Office: G-1, Ackruti Trade Centre, Rd. No. 7, MIDC, Andheri (E), Mumbai - 400 093.
Corporate Office: 6th Floor, Ackruti Star, MIDC, Andheri (E), Mumbai - 400 093. Tel: (022) 30940000
Sebi Registration No: INB 010996539
4