Daily Technical Report
December 17, 2012
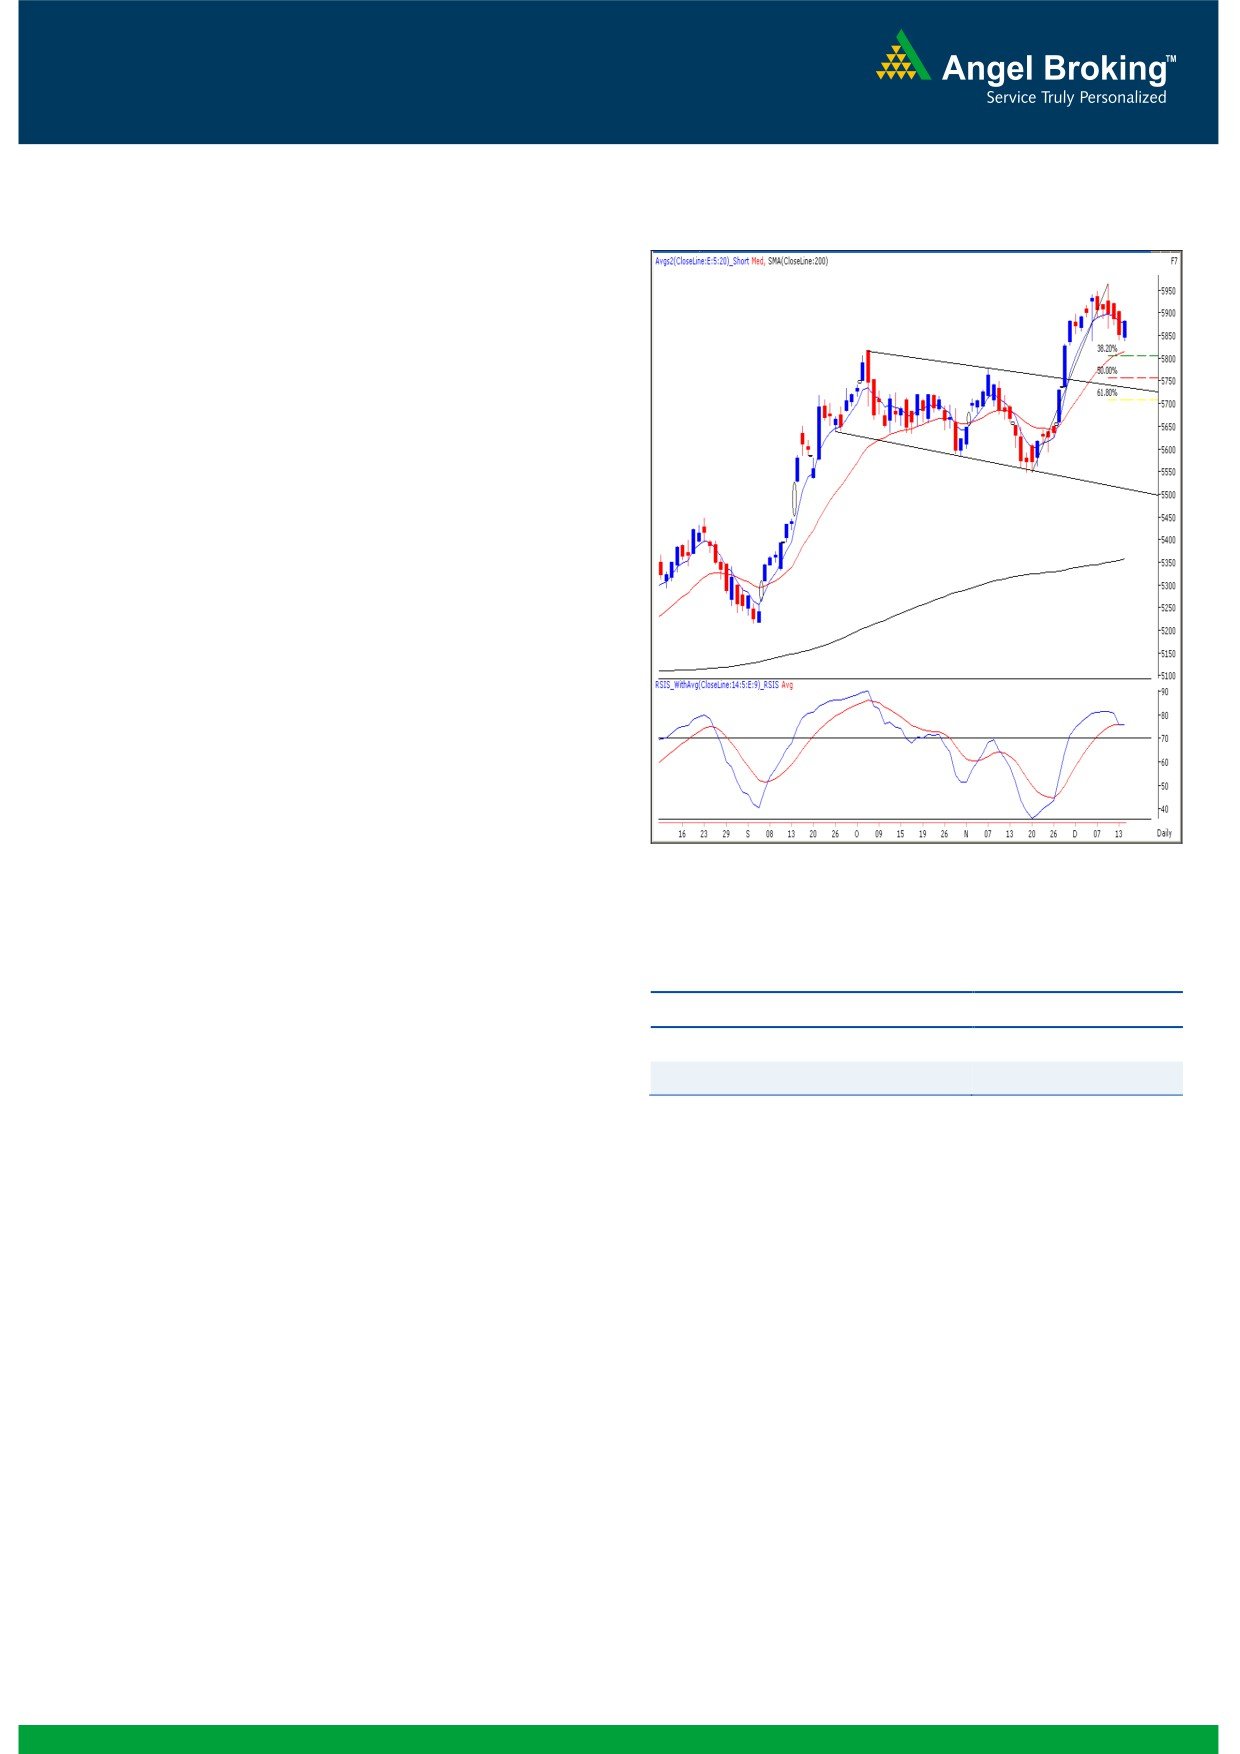
Exhibit 1: Nifty Daily Chart
Sensex (19317) / NIFTY (5880)
On Friday, after a flat opening, our benchmark indices
closed near day’s high on the back of lower than expected
inflation numbers for the month of November. However, for
the week indices remained in tight range of 5965 - 5839
(Nifty). Sectors like Metal, Banking and Realty contributed
heavily in Friday’s up move; whereas the Consumer
Durables, Healthcare and Power counters ended in red. The
advance to decline ratio was marginally in favor of declining
Formation
The ’20-day EMA’ and the ’20-week EMA’ are placed at
19117 / 5815 and 18480 / 5613 levels, respectively.
On the weekly chart, we are witnessing a breakout from
‘Downward Sloping Trend Line’ joining two significant
swing highs of 19811 / 5944 (April 2011) and 19137 /
5815 (Oct 2012) at 19050 / 5800 level.
The 38.20% and 50% Fibonacci retracement levels of
the rise from 18255 / 5548 (low on November 20,
Source: Falcon:
2012) to 19612 / 5965 (high on December 11, 2012)
are at 19100 - 18930 / 5806 - 5755, respectively.
Trading strategy:
Actionable points:
We witnessed few ups and downs in the domestic market this
View for the day
Bearish below 5836
week. Broadly speaking, indices oscillated in the trading
range of 19613 / 5965 - 19193 / 5839 throughout the
Expected Targets
5806 - 5755
week. Indices are now just above the strong support of ’20 -
Resistance Levels
5925 - 5965
Day EMA’. On the other hand, we are now observing that
the daily ‘RSI - Smoothened’ oscillator has given a negative
On the flipside, last week’s high of 19612 / 5965 would act as
crossover in Thursday’s session. In addition to this, the
a strong resistance in the coming trading sessions. Only a
weekly chart now depicts another ‘Narrow Range’ body
move beyond this level would result in an extended rally
formation following last week’s candle. Hence, we are of the
towards 20050 - 20218 / 6000 - 6070 levels. Considering the
opinion that if indices sustain below 19186 / 5836 in the
overall weekly chart structure we continue to remain positive on
coming week, a downward corrective move towards 19100 -
the market and any corrective move towards 19000 - 18900 /
18930 / 5806 - 5755 is in the offing. These levels are the
5800 - 5750 levels should be used by positional traders as a
38.20% and 50% Fibonacci retracement levels of the rise
buying opportunity.
from 18255 / 5548 (low on November 20, 2012) to 19612
/ 5965 (high on December 11, 2012), respectively.
1
Daily Technical Report
December 17, 2012
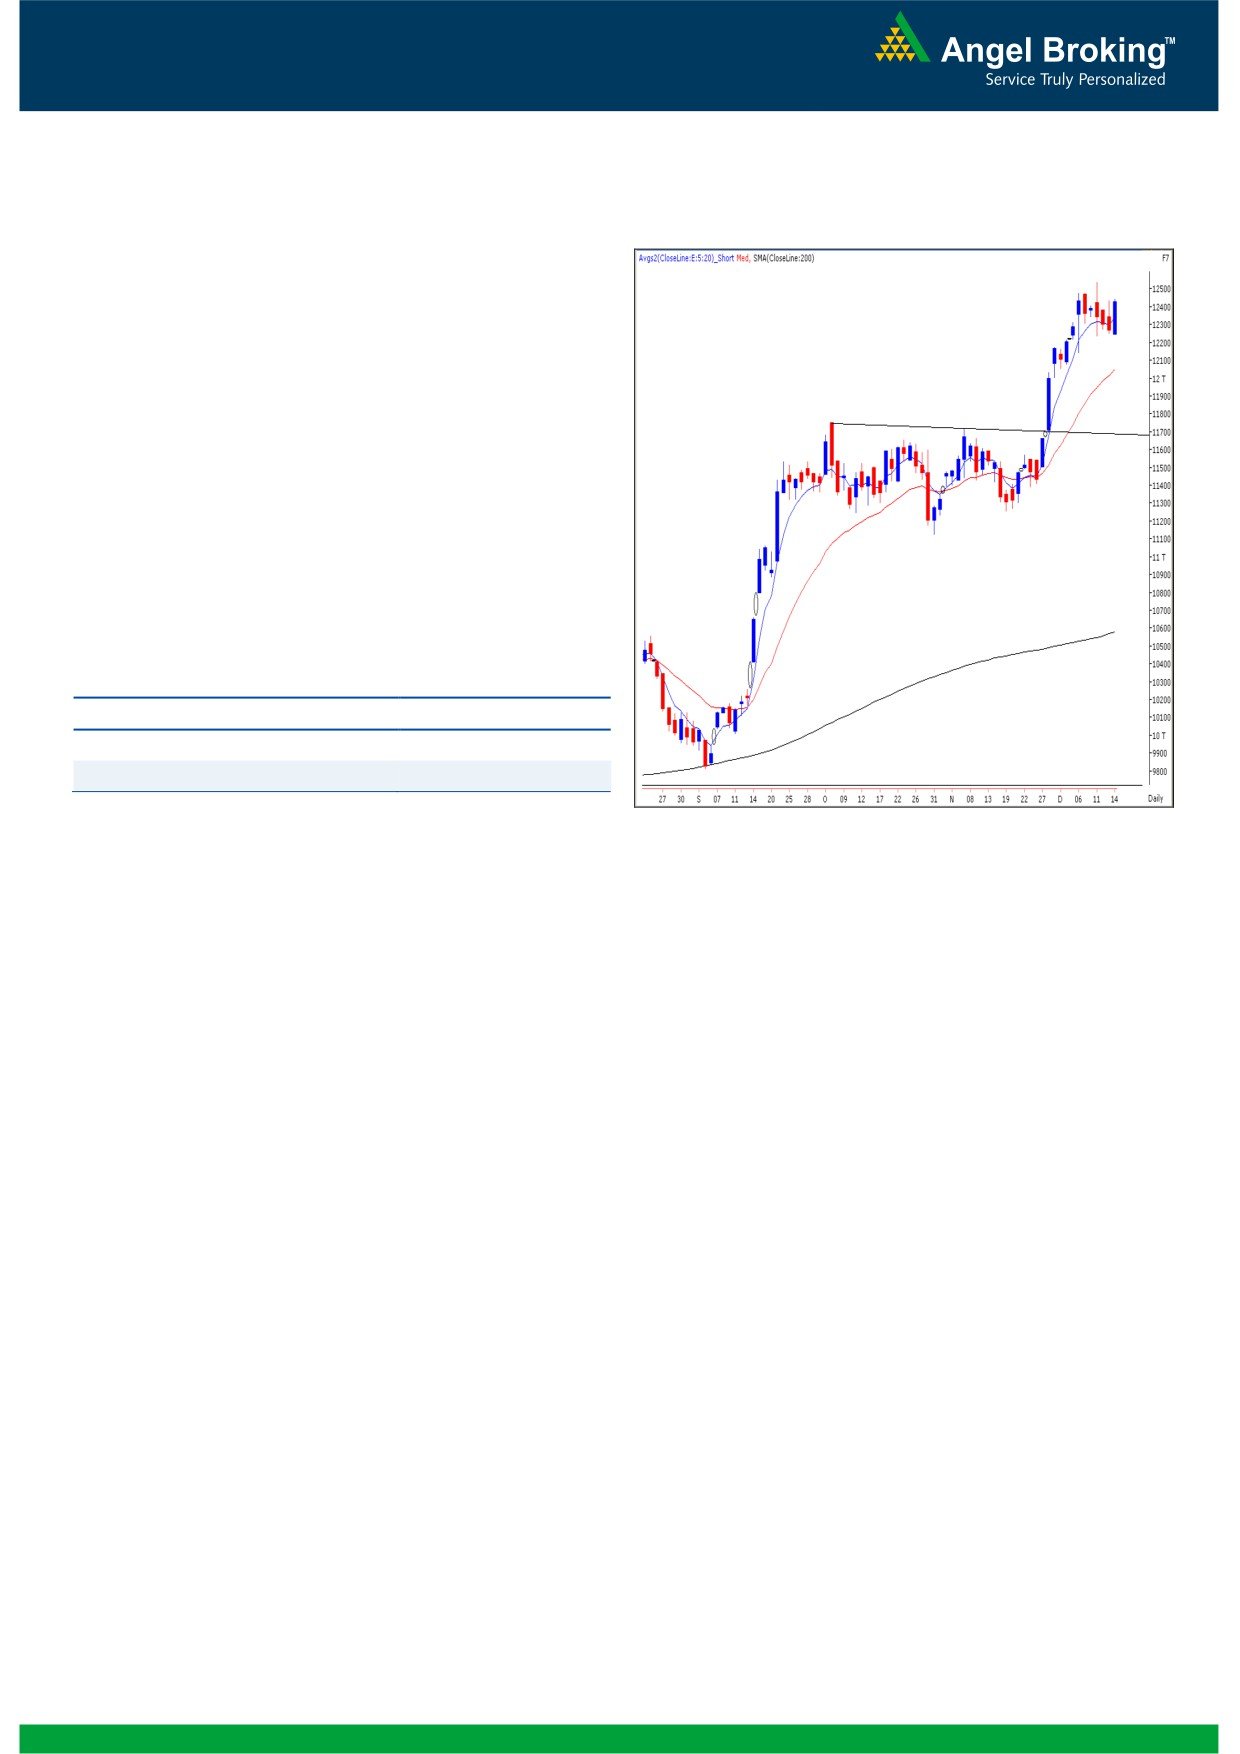
Exhibit 2: Bank Nifty Daily Chart
Bank Nifty Outlook - (12425)
On Friday, Bank Nifty opened on a pessimistic note but
gained strength as the day progressed to close near day’s
high. The bulls defended the important support level of
12238 on the back of declining inflation numbers. For the
entire week the index consolidated in a narrow range of
12539 - 12238. Going forward a sustainable move outside
the mentioned range will then dictate a clear direction of the
trend. On the upside 12485 - 12539 levels are likely to act
as resistance and 12327 - 12238 are likely to act as support
for the day.
Actionable points:
View for the day
Neutral
Resistance Levels
12485 - 12539
Support Levels
12327 - 12238
Source: Falcon:
2
Daily Technical Report
December 17, 2012
Daily Pivot Levels for Nifty 50 Stocks
SCRIPS
S2
S1
PIVOT
R1
R2
SENSEX
19,131
19,224
19,286
19,380
19,442
NIFTY
5,821
5,850
5,868
5,897
5,915
BANKNIFTY
12,167
12,296
12,372
12,500
12,576
ACC
1,374
1,389
1,401
1,416
1,428
AMBUJACEM
200
203
206
209
212
ASIANPAINT
4,226
4,254
4,290
4,317
4,354
AXISBANK
1,312
1,332
1,345
1,365
1,377
BAJAJ-AUTO
2,055
2,068
2,087
2,100
2,119
BANKBARODA
785
813
831
859
876
BHARTIARTL
303
308
313
318
324
BHEL
219
222
226
229
233
BPCL
344
347
352
356
360
CAIRN
317
321
323
327
329
CIPLA
397
400
405
408
414
COALINDIA
349
351
354
357
359
DLF
214
216
217
219
221
DRREDDY
1,801
1,815
1,840
1,854
1,878
GAIL
342
344
347
349
352
GRASIM
3,110
3,126
3,142
3,158
3,174
HCLTECH
617
624
629
636
641
HDFC
840
846
853
859
865
HDFCBANK
680
685
690
694
699
HEROMOTOCO
1,831
1,847
1,867
1,883
1,903
HINDALCO
113
117
118
122
124
HINDUNILVR
508
512
518
523
529
ICICIBANK
1,104
1,120
1,130
1,146
1,156
IDFC
170
172
174
176
178
INFY
2,251
2,265
2,280
2,294
2,309
ITC
288
292
294
298
301
JINDALSTEL
415
423
428
436
440
JPASSOCIAT
100
101
102
103
105
KOTAKBANK
647
656
662
671
676
LT
1,616
1,627
1,638
1,650
1,661
LUPIN
592
599
606
612
620
M&M
934
943
949
958
964
MARUTI
1,435
1,456
1,472
1,493
1,509
NTPC
148
150
152
154
156
ONGC
254
257
259
262
264
PNB
795
812
824
842
854
POWERGRID
114
115
117
118
119
RANBAXY
493
496
500
503
506
RELIANCE
820
830
838
848
856
RELINFRA
509
515
520
526
532
SBIN
2,227
2,274
2,300
2,347
2,374
SESAGOA
177
182
186
191
195
SIEMENS
666
673
684
691
702
SUNPHARMA
711
715
720
725
730
TATAMOTORS
281
286
290
296
300
TATAPOWER
103
104
105
106
107
TATASTEEL
382
389
395
402
408
TCS
1,206
1,224
1,235
1,253
1,264
ULTRACEMCO
1,938
1,965
1,982
2,009
2,025
WIPRO
370
373
375
378
381
3
Daily Technical Report
December 17, 2012
Research Team Tel: 022 - 39357800
DISCLAIMER
This document is solely for the personal information of the recipient, and must not be singularly used as the basis of any investment
decision. Nothing in this document should be construed as investment or financial advice. Each recipient of this document should make
such investigations as they deem necessary to arrive at an independent evaluation of an investment in the securities of the companies
referred to in this document (including the merits and risks involved), and should consult their own advisors to determine the merits and
risks of such an investment.
Angel Broking Limited, its affiliates, directors, its proprietary trading and investment businesses may, from time to time, make
investment decisions that are inconsistent with or contradictory to the recommendations expressed herein. The views contained in this
document are those of the analyst, and the company may or may not subscribe to all the views expressed within.
Reports based on technical and derivative analysis center on studying charts of a stock's price movement, outstanding positions and
trading volume, as opposed to focusing on a company's fundamentals and, as such, may not match with a report on a company's
fundamentals.
The information in this document has been printed on the basis of publicly available information, internal data and other reliable
sources believed to be true, but we do not represent that it is accurate or complete and it should not be relied on as such, as this
document is for general guidance only. Angel Broking Limited or any of its affiliates/ group companies shall not be in any way
responsible for any loss or damage that may arise to any person from any inadvertent error in the information contained in this report.
Angel Broking Limited has not independently verified all the information contained within this document. Accordingly, we cannot testify,
nor make any representation or warranty, express or implied, to the accuracy, contents or data contained within this document. While
Angel Broking Limited endeavours to update on a reasonable basis the information discussed in this material, there may be regulatory,
compliance, or other reasons that prevent us from doing so.
This document is being supplied to you solely for your information, and its contents, information or data may not be reproduced,
redistributed or passed on, directly or indirectly.
Angel Broking Limited and its affiliates may seek to provide or have engaged in providing corporate finance, investment banking or
other advisory services in a merger or specific transaction to the companies referred to in this report, as on the date of this report or in
the past.
Neither Angel Broking Limited, nor its directors, employees or affiliates shall be liable for any loss or damage that may arise from or in
connection with the use of this information.
Note: Please refer to the important `Stock Holding Disclosure' report on the Angel website (Research Section). Also, please refer to the
latest update on respective stocks for the disclosure status in respect of those stocks. Angel Broking Limited and its affiliates may have
investment positions in the stocks recommended in this report.
Research Team
Shardul Kulkarni
-
Head - Technicals
Sameet Chavan
-
Technical Analyst
Sacchitanand Uttekar
-
Technical Analyst
Mehul Kothari
-
Technical Analyst
Ankur Lakhotia
-
Technical Analyst
Angel Broking Pvt. Ltd.
Registered Office: G-1, Ackruti Trade Centre, Rd. No. 7, MIDC, Andheri (E), Mumbai - 400 093.
Corporate Office: 6th Floor, Ackruti Star, MIDC, Andheri (E), Mumbai - 400 093. Tel: (022) 3952 6600
Sebi Registration No: INB 010996539
4