Daily Technical Report
October 17, 2012
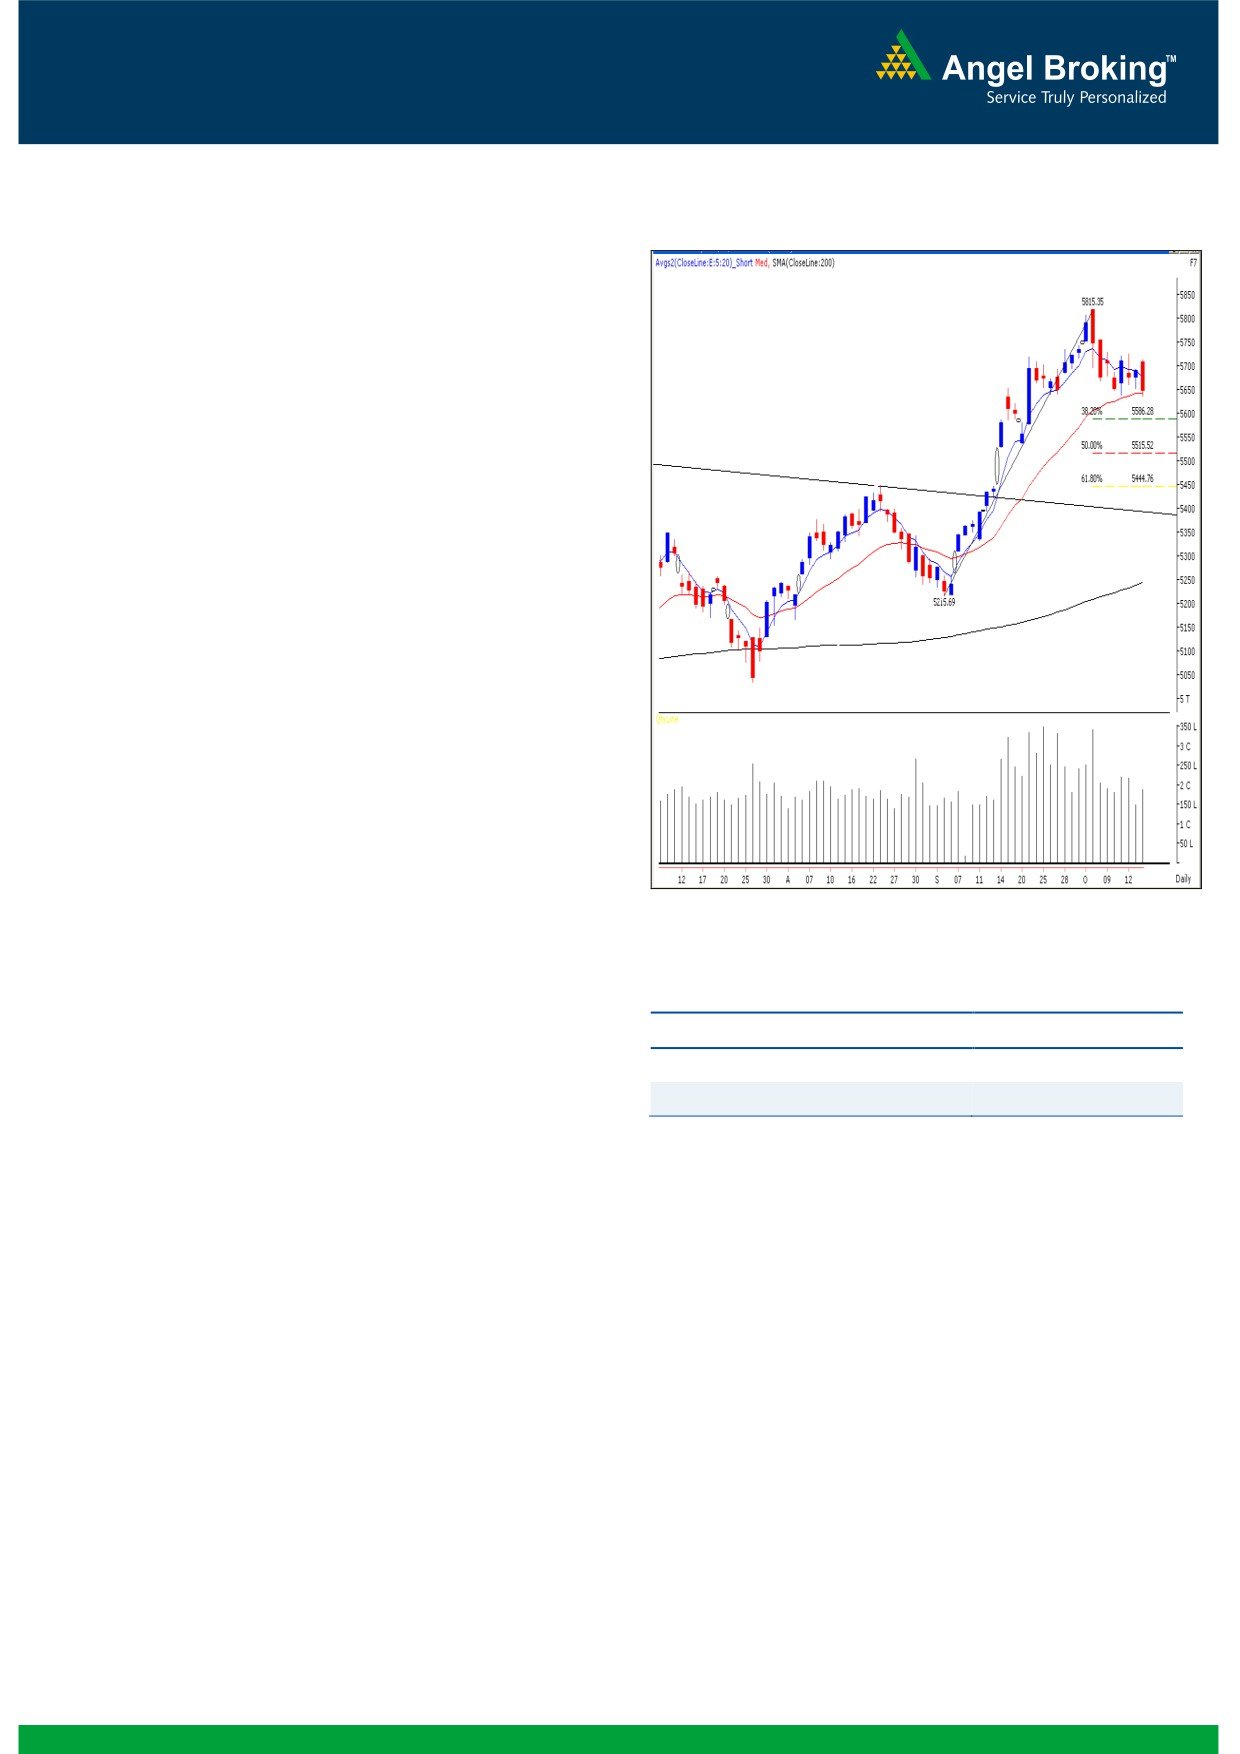
Exhibit 1: Nifty Daily Chart
Sensex (18578) / NIFTY (5648)
Yesterday, markets started on a positive note considering
positive cues from other Asian bourses. However, immense
selling pressure in the second half eventually resulted in a
violation of the multiple support level of 18581 / 5637.
Once again Realty, Metal and Consumer Goods counters
contributed heavily in yesterday’s fall whereas Consumer
Durables and Teck sectors showed some stability. The
advance to decline ratio was strongly in favor of declining
Formation
The ’20-day EMA’ and the ’20-week EMA’ are placed at
18582/ 5635 and 17840/ 5400 levels, respectively.
The monthly ‘RSI’ oscillator is moving higher from the 50
mark and the positive in ADX (9) indicator is intact.
The weekly ‘Stochastic’ oscillator is now signaling a
negative crossover.
The weekly chart depicts a ‘Bearish Engulfing’
candlestick pattern.
The 38.2% and 50% Fibonacci Retracement levels of the
Source: Falcon:
rise from 17250 to 19138 / 5216 to 5815 are placed at
18416 / 5586 and 18194 / 5515, respectively.
Actionable points:
Trading strategy:
View for the day
Neutral
Yesterday after an optimistic opening, indices made an
Resistance Levels
5729 - 5757
attempt to cross the immediate resistance level of 18886 /
Support Levels
5635 - 5600
5729. Unfortunately for the bulls, strong selling pressure in
the second half dragged the indices marginally below the
crucial support level of 18581 / 5636. This level coincides
with the '20-day EMA' and has acted as a support in the past
entire week. Going forward, if indices sustain below
yesterday's low of 18549 / 5635, then they are like to slide
lower to test next support levels of 18416 / 5586 and 18194
/ 5515, which are 38.2% and 50% Fibonacci Retracement
levels of the rise from 17250 to 19138 / 5216 to 5815,
respectively. Conversely, 18886 / 5729 level remains to be a
major hurdle for the bulls. Only a move above this resistance
may open up the possibilities of moving to 18973 / 5757
levels.
1
Daily Technical Report
October 17, 2012
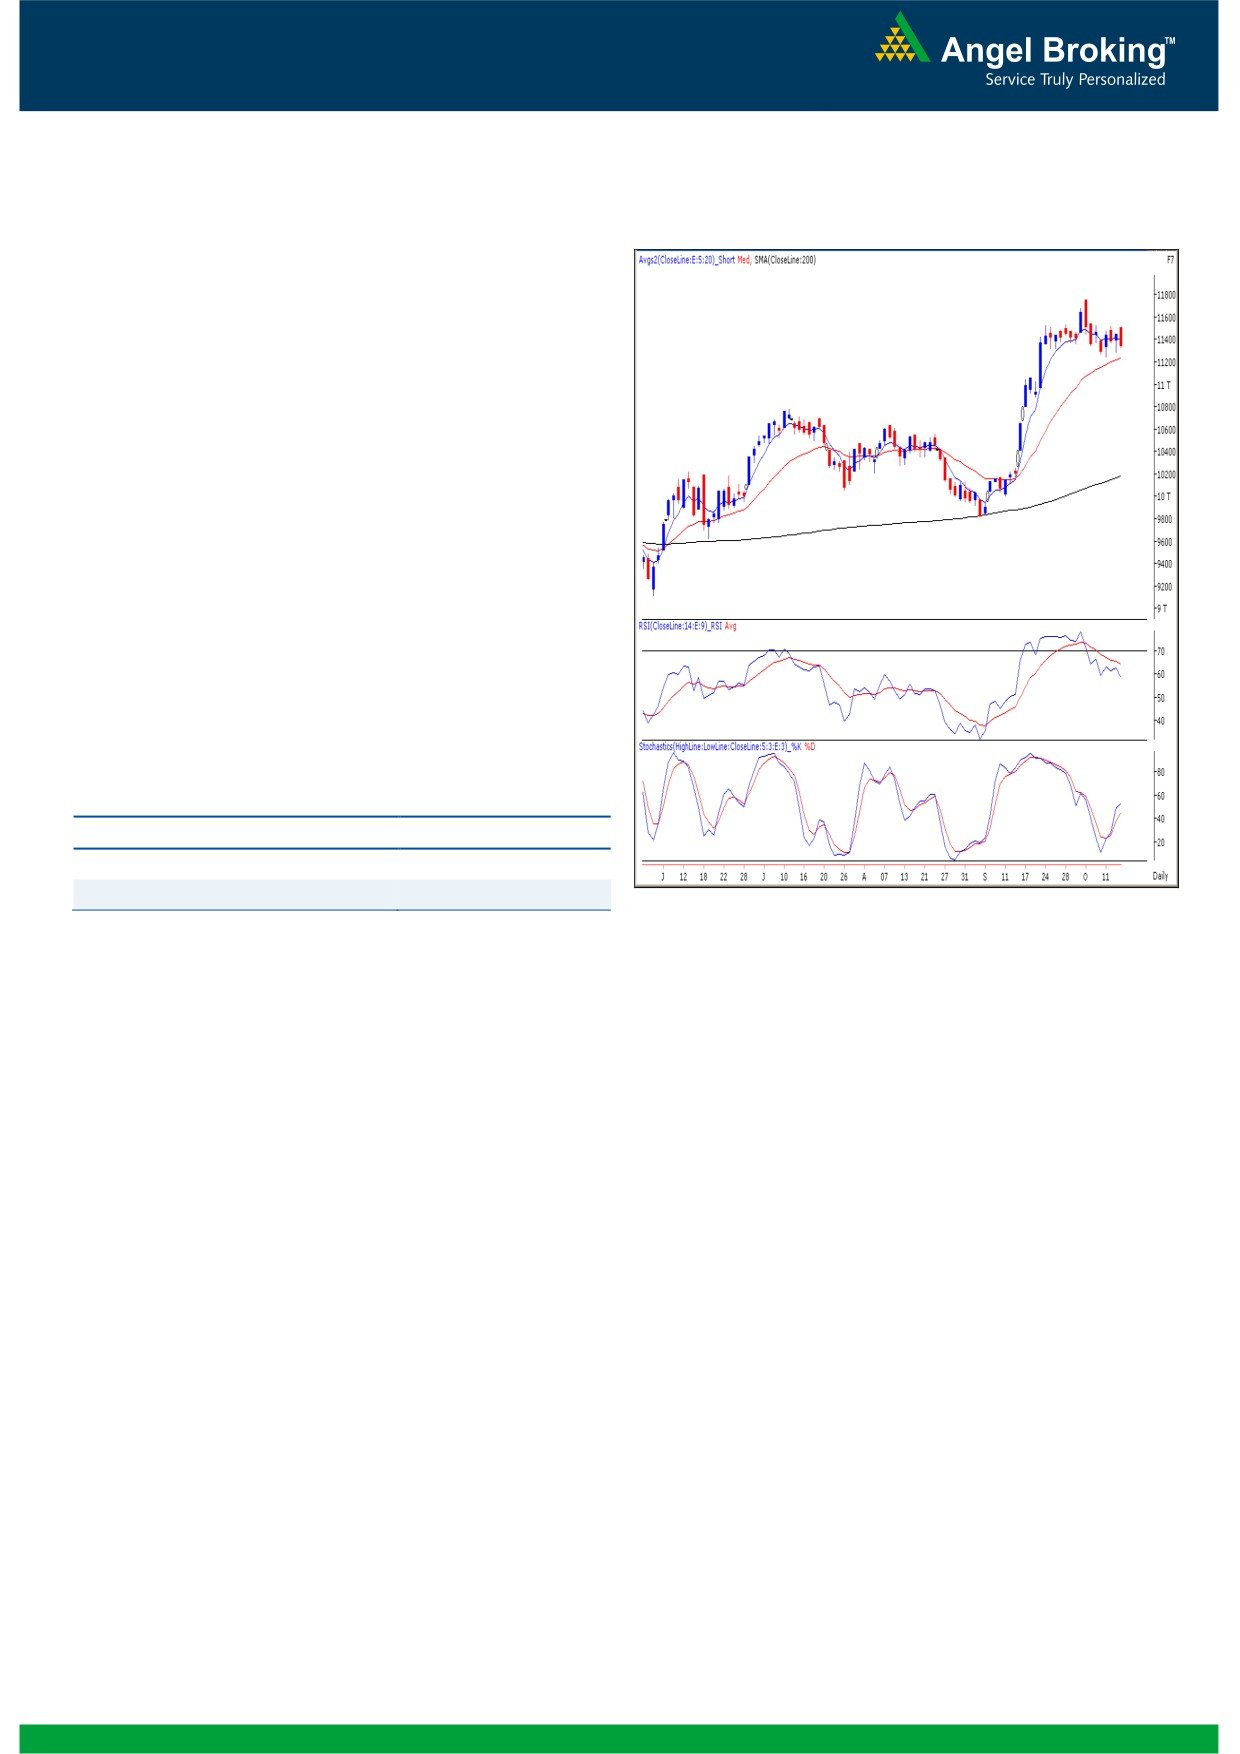
Exhibit 2: Bank Nifty Daily Chart
Bank Nifty Outlook - (11348)
Yesterday, Bank Nifty opened on a positive note and
traded in a narrow range during the first half of the
session. However selling pressure in heavyweight banking
counters eventually lead the index to close near day’s low.
The index failed to cross the 11537 level which was the
neckline for the “Inverted Head and Shoulder” mentioned
in our previous report. The momentum oscillators “RSI”
and Stochastic on the daily chart are painting a mixed
picture, indicating a rise in volatility in coming trading
session. Selling pressure is likely to intensify if the index
sustains below 11245. In this scenario the Bank Nifty is
likely to drift towards 11168 - 11123 levels. Traders are
advised to create fresh long positions only if the index
sustains above 11537 level.
Actionable points:
View for the day
Neutral
Resistance Levels
11537
Support Levels
11245 - 11168
Source: Falcon:
2
Daily Technical Report
October 17, 2012
Research Team Tel: 022 - 39357800
DISCLAIMER
This document is solely for the personal information of the recipient, and must not be singularly used as the basis of any investment
decision. Nothing in this document should be construed as investment or financial advice. Each recipient of this document should make
such investigations as they deem necessary to arrive at an independent evaluation of an investment in the securities of the companies
referred to in this document (including the merits and risks involved), and should consult their own advisors to determine the merits and
risks of such an investment.
Angel Broking Limited, its affiliates, directors, its proprietary trading and investment businesses may, from time to time, make
investment decisions that are inconsistent with or contradictory to the recommendations expressed herein. The views contained in this
document are those of the analyst, and the company may or may not subscribe to all the views expressed within.
Reports based on technical and derivative analysis center on studying charts of a stock's price movement, outstanding positions and
trading volume, as opposed to focusing on a company's fundamentals and, as such, may not match with a report on a company's
fundamentals.
The information in this document has been printed on the basis of publicly available information, internal data and other reliable
sources believed to be true, but we do not represent that it is accurate or complete and it should not be relied on as such, as this
document is for general guidance only. Angel Broking Limited or any of its affiliates/ group companies shall not be in any way
responsible for any loss or damage that may arise to any person from any inadvertent error in the information contained in this report.
Angel Broking Limited has not independently verified all the information contained within this document. Accordingly, we cannot testify,
nor make any representation or warranty, express or implied, to the accuracy, contents or data contained within this document. While
Angel Broking Limited endeavours to update on a reasonable basis the information discussed in this material, there may be regulatory,
compliance, or other reasons that prevent us from doing so.
This document is being supplied to you solely for your information, and its contents, information or data may not be reproduced,
redistributed or passed on, directly or indirectly.
Angel Broking Limited and its affiliates may seek to provide or have engaged in providing corporate finance, investment banking or
other advisory services in a merger or specific transaction to the companies referred to in this report, as on the date of this report or in
the past.
Neither Angel Broking Limited, nor its directors, employees or affiliates shall be liable for any loss or damage that may arise from or in
connection with the use of this information.
Note: Please refer to the important `Stock Holding Disclosure' report on the Angel website (Research Section). Also, please refer to the
latest update on respective stocks for the disclosure status in respect of those stocks. Angel Broking Limited and its affiliates may have
investment positions in the stocks recommended in this report.
Research Team
Shardul Kulkarni
-
Head - Technicals
Sameet Chavan
-
Technical Analyst
Sacchitanand Uttekar
-
Technical Analyst
Mehul Kothari
-
Technical Analyst
Ankur Lakhotia
-
Technical Analyst
Angel Broking Pvt. Ltd.
Registered Office: G-1, Ackruti Trade Centre, Rd. No. 7, MIDC, Andheri (E), Mumbai - 400 093.
Corporate Office: 6th Floor, Ackruti Star, MIDC, Andheri (E), Mumbai - 400 093. Tel: (022) 3952 6600
Sebi Registration No: INB 010996539
4