Daily Technical Report
September 17, 2012
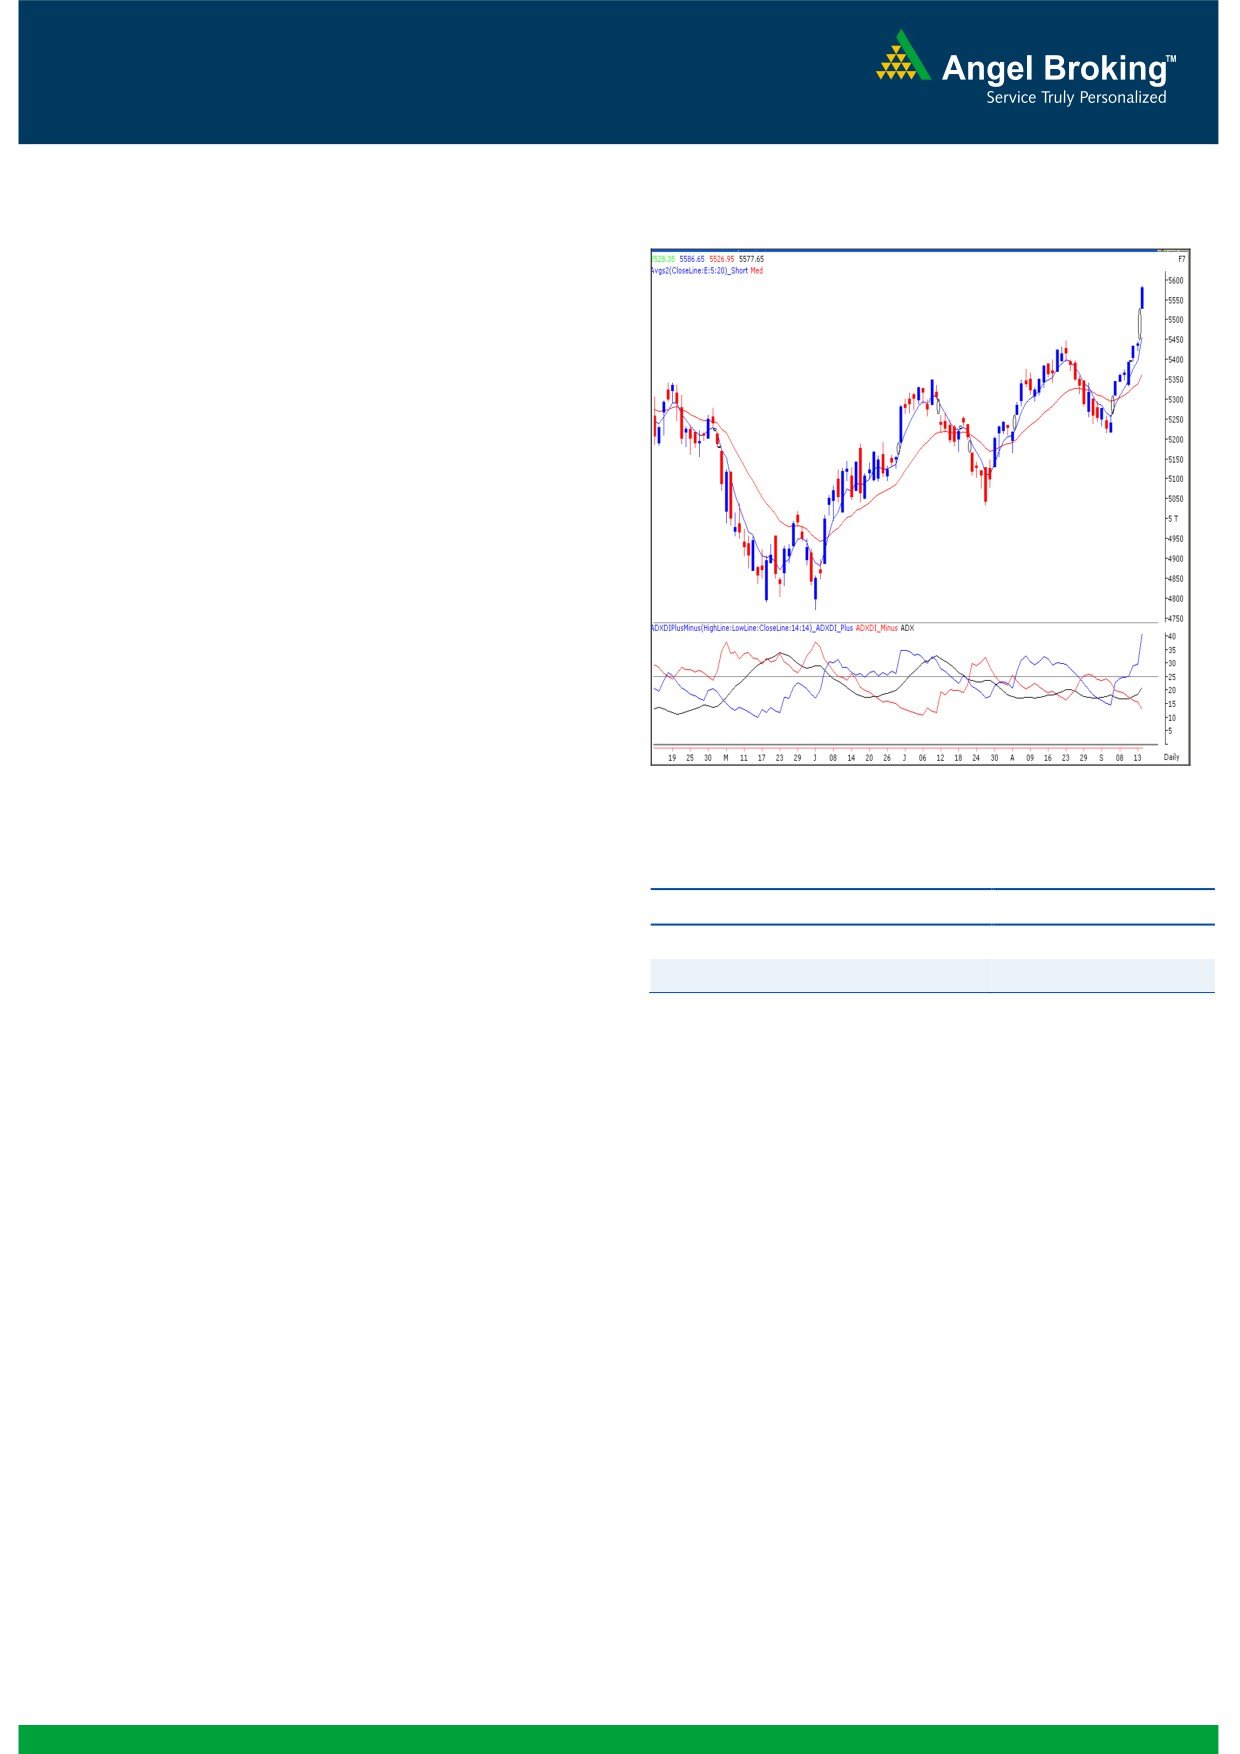
Exhibit 1: Nifty Daily Chart
Sensex (18464) / NIFTY (5578)
On Friday, we witnessed the highest single day gain in last
12 months and our indices rose over 2.5% to meet our target
of 5550 mentioned in the previous reports. Quantitative
easing announced by the US Fed and a hike in the diesel
prices on Thursday evening, led to surge in FII inflows. On
sectoral front, Realty, Metal and Banking counters were
among the star performers; whereas Health Care and FMCG
sectors remained under pressure. The advance to decline
ratio was marginally in favor of advancing counters
Formation
The ’20-day EMA’ and the ’20-week EMA’ are placed at
17763 / 5361 and 17380 / 5261 levels, respectively.
Indices have now confirmed a weekly ‘Higher Top -
Higher Bottom’ formation.
Source: Falcon:
The daily ‘RSI’ momentum oscillator on weekly chart is
Actionable points:
still showing strength.
The weekly chart depicts an “Upward Sloping Trend
View
Bullish above 5586
Line” breakout above 17973 / 5449 level.
Expected Targets
5630 - 5700
The ADX (14) indicator on the Daily chart shows
Support Levels
5527
possibility of further strength in the coming sessions. The
+ DI (positive directional index) is moving upwards
supported by the ADX line, which is at 21 level. The ADX
The traders who have missed this rally should now ideally wait for a
rise from
15 to
25 indicates that the uptrend is
pull back (if any) up to 17973 - 17800 / 5449 - 5380 and then
strengthening and positive momentum is likely to
create fresh long positions in the market.
accelerate further in the coming trading sessions.
We may witness some volatility on Monday’s session on account
‘RBI Monetary Policy’. We advise traders to adopt stock specific
approach and trade with strict stop losses.
Trading strategy:
Finally, it clearly seems that this is a “September to
remember”. All events, domestically as well as globally have
now ruled in the favor of equity markets across the globe. As
a result, the week ended on a cheerful note and we have
now finally witnessed a much awaited breakout above
17973 / 5449 level. Although, indices have reached our
mentioned target of 5550, we still continue to maintain our
positive stance on the market. This week Sensex /Nifty
missed the next important level of 18524 /5630 by a
whisker. Going forward, looking at the strong higher top
higher bottom structure on the daily as well as weekly chart
and the placement of the ADX (14) indicator, we expect
markets to move higher towards 18945 - 19132 / 5702 -
5741 levels.
1
Daily Technical Report
September 17, 2012
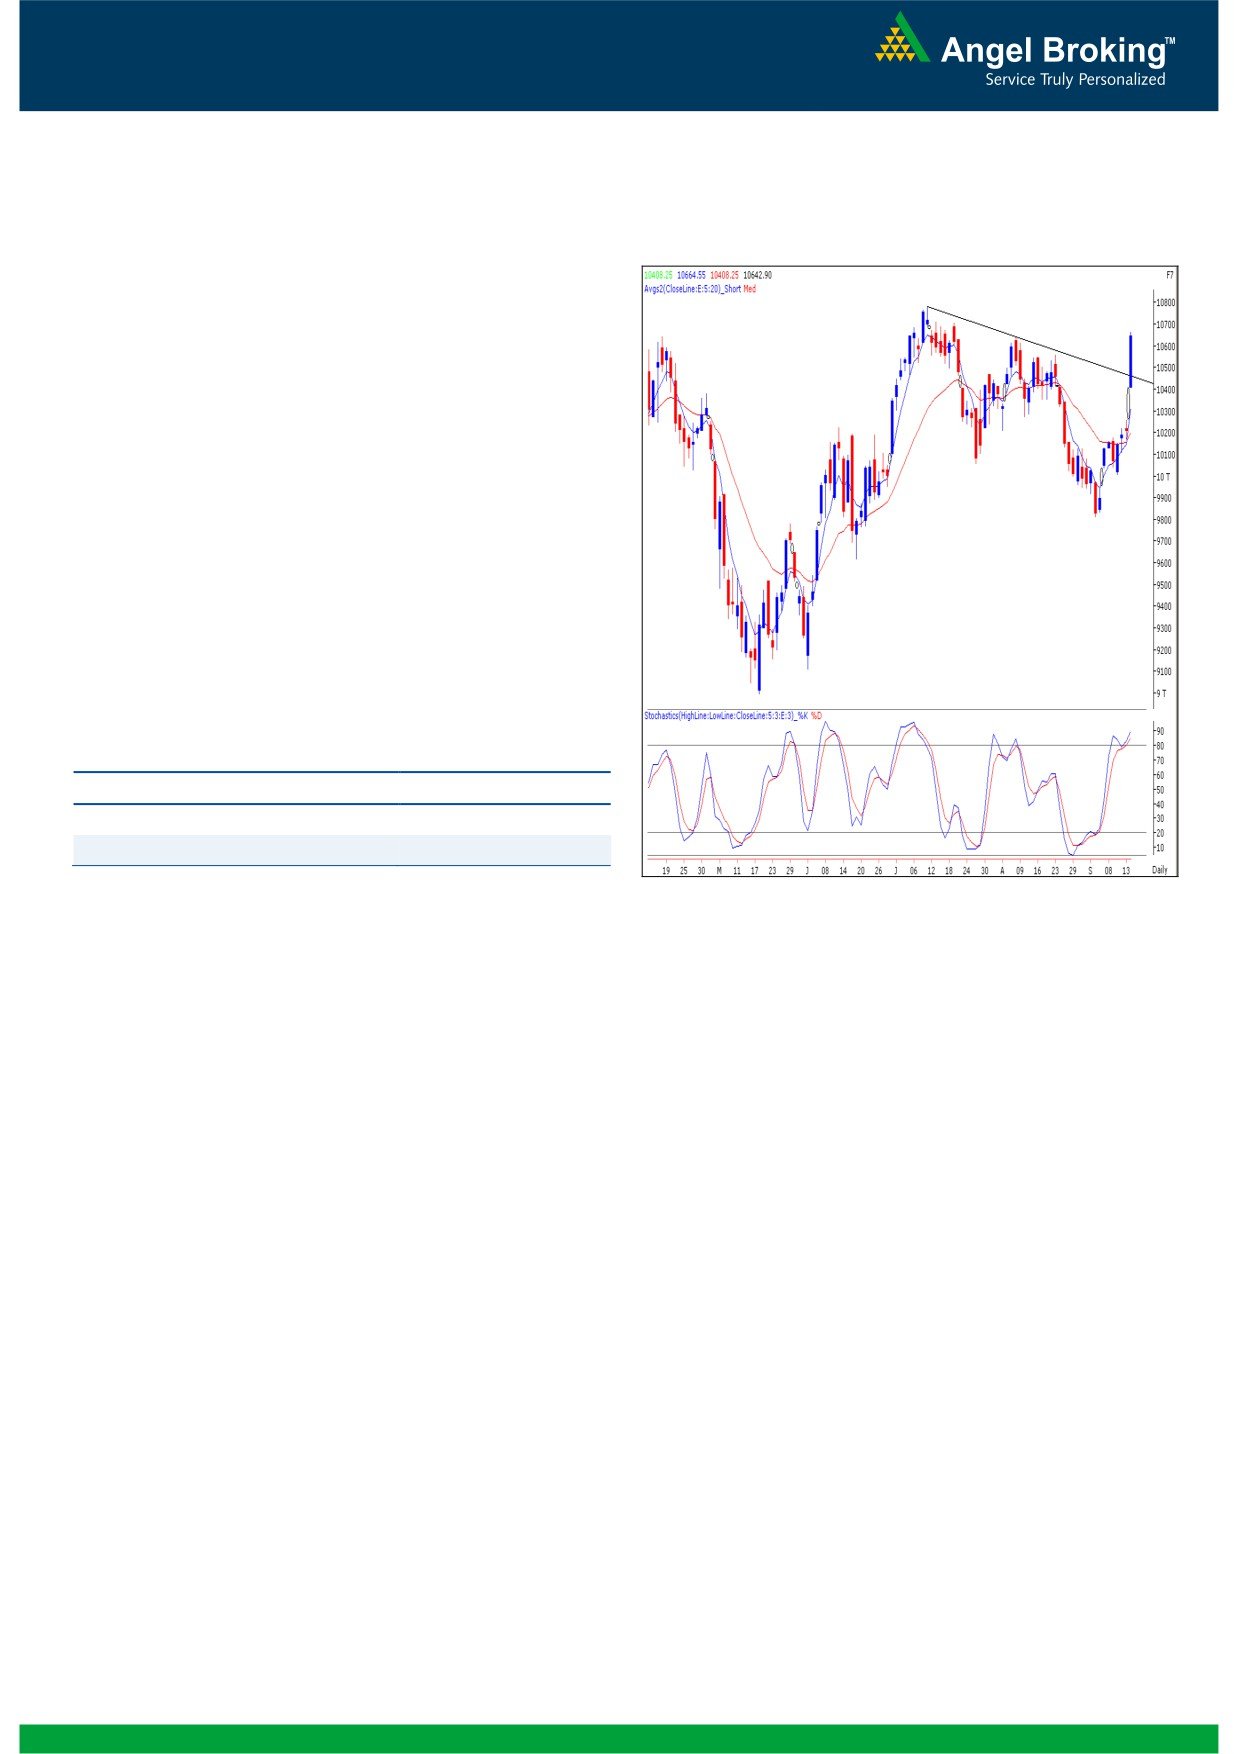
Bank Nifty Outlook - (10643)
Exhibit 2: Bank Nifty Daily Chart
On Friday, Bank Nifty opened with an upside gap in line with
our benchmark indices to close near day’s high with a gain
of 4.26%. We are now witnessing a trend line breakout by
joining the highs of July 11, 2012 - August 08, 2012. The
momentum oscillator “Stochastic” on the daily chart is placed
in extreme overbought zone indicating consolidation is likely.
However considering the strong higher top higher bottom
cycle in the daily chart we would advise positional traders to
use every decline towards 10400 to buy into the Bank Nifty.
For the day a move beyond 10665, is likely to augment
further buying and the Index may then test 10785 level. On
account of RBI Monetary Policy we expect the volatility to
increase in the coming trading session.
Actionable points:
View
Bullish above 10665
Expected target
10785
Support Levels
10418 - 10360
Source: Falcon:
2
Daily Technical Report
September 17, 2012
Daily Pivot Levels for Nifty 50 Stocks
SCRIPS
S2
S1
PIVOT
R1
R2
SENSEX
18,202
18,333
18,416
18,547
18,630
NIFTY
5,504
5,541
5,564
5,601
5,623
BANKNIFTY
10,316
10,479
10,572
10,736
10,828
ACC
1,336
1,361
1,375
1,400
1,415
AMBUJACEM
190
194
196
200
202
ASIANPAINT
3,839
3,870
3,894
3,925
3,948
AXISBANK
956
983
998
1,025
1,040
BAJAJ-AUTO
1,708
1,726
1,743
1,761
1,778
BANKBARODA
635
658
672
695
709
BHARTIARTL
250
253
256
259
262
BHEL
201
203
205
206
208
BPCL
327
339
358
369
388
CAIRN
342
348
352
358
362
CIPLA
362
366
370
374
379
COALINDIA
379
381
383
385
387
DLF
201
209
213
221
226
DRREDDY
1,692
1,720
1,767
1,795
1,843
GAIL
360
367
380
387
400
GRASIM
3,025
3,068
3,094
3,138
3,164
HCLTECH
569
576
586
593
603
HDFC
754
762
768
776
782
HDFCBANK
596
604
609
618
623
HEROMOTOCO
1,812
1,837
1,853
1,878
1,894
HINDALCO
113
116
117
120
122
HINDUNILVR
540
544
549
553
559
ICICIBANK
946
977
1,016
1,047
1,086
IDFC
132
136
138
141
143
INFY
2,562
2,597
2,621
2,656
2,680
ITC
263
266
269
272
275
JINDALSTEL
337
355
366
384
395
JPASSOCIAT
70
72
73
75
76
KOTAKBANK
578
594
602
618
626
LT
1,425
1,457
1,475
1,508
1,526
M&M
747
762
775
790
803
MARUTI
1,210
1,235
1,252
1,277
1,293
NTPC
163
166
170
172
177
ONGC
271
277
285
291
299
PNB
686
697
704
716
722
POWERGRID
117
118
121
122
125
RANBAXY
525
533
547
555
569
RELIANCE
796
819
832
855
868
RELINFRA
458
464
469
475
480
SAIL
81
83
84
86
87
SBIN
1,889
1,930
1,953
1,994
2,017
SESAGOA
161
165
167
172
174
SIEMENS
663
668
673
678
683
STER
95
97
98
100
102
SUNPHARMA
665
672
679
685
693
TATAMOTORS
260
265
268
274
277
TATAPOWER
95
96
98
99
100
TATASTEEL
395
400
404
409
413
TCS
1,381
1,397
1,418
1,435
1,456
WIPRO
383
387
392
396
400
3
Daily Technical Report
September 17, 2012
Research Team Tel: 022 - 39357800
DISCLAIMER
This document is solely for the personal information of the recipient, and must not be singularly used as the basis of any investment
decision. Nothing in this document should be construed as investment or financial advice. Each recipient of this document should make
such investigations as they deem necessary to arrive at an independent evaluation of an investment in the securities of the companies
referred to in this document (including the merits and risks involved), and should consult their own advisors to determine the merits and
risks of such an investment.
Angel Broking Limited, its affiliates, directors, its proprietary trading and investment businesses may, from time to time, make
investment decisions that are inconsistent with or contradictory to the recommendations expressed herein. The views contained in this
document are those of the analyst, and the company may or may not subscribe to all the views expressed within.
Reports based on technical and derivative analysis center on studying charts of a stock's price movement, outstanding positions and
trading volume, as opposed to focusing on a company's fundamentals and, as such, may not match with a report on a company's
fundamentals.
The information in this document has been printed on the basis of publicly available information, internal data and other reliable
sources believed to be true, but we do not represent that it is accurate or complete and it should not be relied on as such, as this
document is for general guidance only. Angel Broking Limited or any of its affiliates/ group companies shall not be in any way
responsible for any loss or damage that may arise to any person from any inadvertent error in the information contained in this report.
Angel Broking Limited has not independently verified all the information contained within this document. Accordingly, we cannot testify,
nor make any representation or warranty, express or implied, to the accuracy, contents or data contained within this document. While
Angel Broking Limited endeavours to update on a reasonable basis the information discussed in this material, there may be regulatory,
compliance, or other reasons that prevent us from doing so.
This document is being supplied to you solely for your information, and its contents, information or data may not be reproduced,
redistributed or passed on, directly or indirectly.
Angel Broking Limited and its affiliates may seek to provide or have engaged in providing corporate finance, investment banking or
other advisory services in a merger or specific transaction to the companies referred to in this report, as on the date of this report or in
the past.
Neither Angel Broking Limited, nor its directors, employees or affiliates shall be liable for any loss or damage that may arise from or in
connection with the use of this information.
Note: Please refer to the important `Stock Holding Disclosure' report on the Angel website (Research Section). Also, please refer to the
latest update on respective stocks for the disclosure status in respect of those stocks. Angel Broking Limited and its affiliates may have
investment positions in the stocks recommended in this report.
Research Team
Shardul Kulkarni
-
Head - Technicals
Sameet Chavan
-
Technical Analyst
Sacchitanand Uttekar
-
Technical Analyst
Mehul Kothari
-
Technical Analyst
Ankur Lakhotia
-
Technical Analyst
Angel Broking Pvt. Ltd.
Registered Office: G-1, Ackruti Trade Centre, Rd. No. 7, MIDC, Andheri (E), Mumbai - 400 093.
Corporate Office: 6th Floor, Ackruti Star, MIDC, Andheri (E), Mumbai - 400 093. Tel: (022) 3952 6600
Sebi Registration No: INB 010996539
4