Daily Technical Report
April 17, 2013
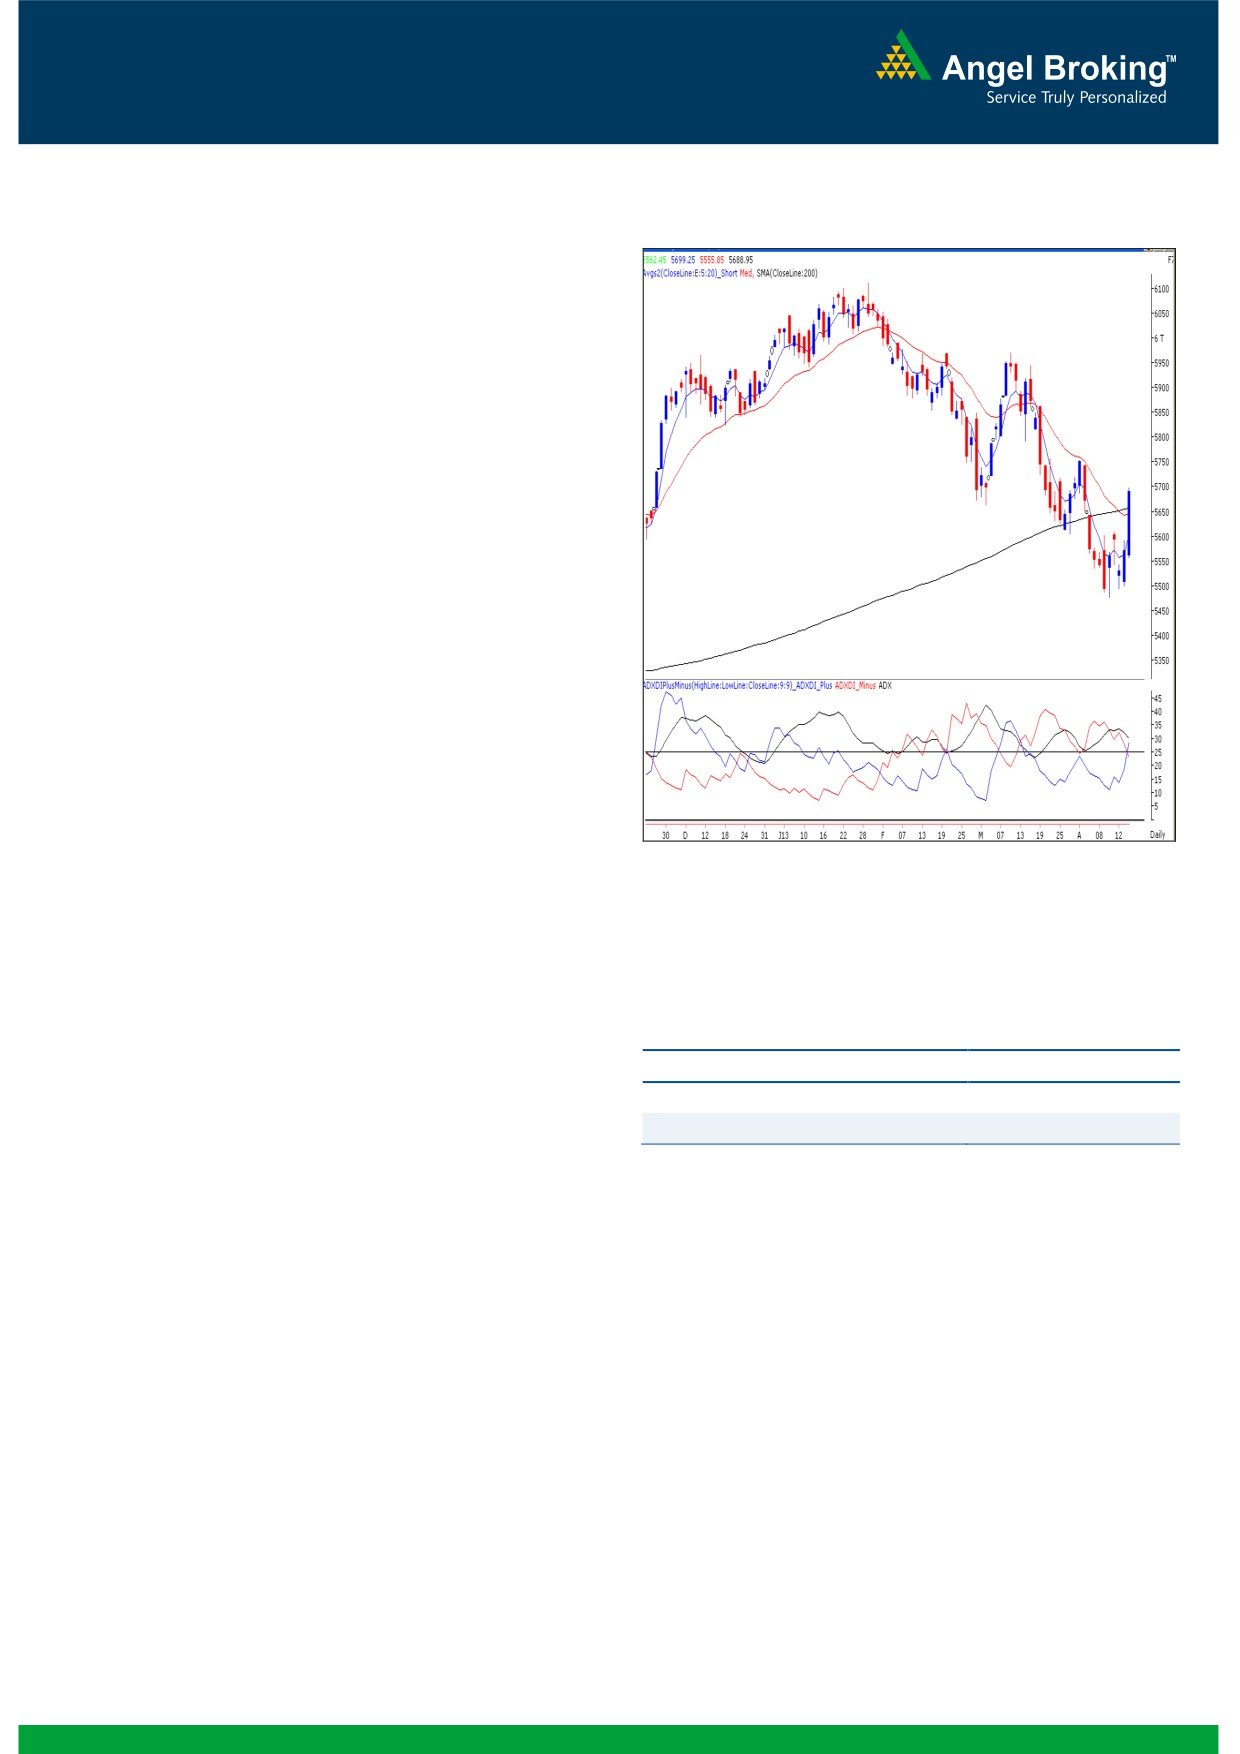
Exhibit 1: Nifty Daily Chart
Sensex (18745) / NIFTY (5689)
Despite pessimism across the globe, our benchmark indices
opened on a flat note and crossed last weeks’ high of 18600
/ 5611 during the initial hour of the trade. Indices then
maintained their positive bias throughout the session to end
almost at the highest point of the day. During the day nearly
all the sectors ended with stupendous gains whereas IT and
Teck counters ended with marginal losses. The advance to
decline ratio was in favor of advancing counters (A=1388
D=1022)
Formation
The ’20-week EMA’ and the ’20-day EMA’ are placed at
18987 / 5748 and 18688 / 5646 levels, respectively.
The ’89-week EMA’ and the ‘200-day SMA’ are placed
at 18203 / 5506 and 18657 / 5656, respectively.
The ‘Lower Top Lower Bottom’ formation on weekly
chart is still intact.
Source: Falcon:
We are observing a ‘Spinning Top’ (only in Nifty)
Japanese candlestick pattern on the weekly chart.
Actionable points:
Trading strategy:
For the second consecutive session, indices have neglected
View
Bullish Above 5700
the negative developments in all other equity markets across
Expected Targets
5755 - 5780
the globe. Indices traded with immense optimism from the
Support levels
5611 - 5555
initial hour of the session. As a result, prices managed to
cross the high of the ‘Spinning Top’ pattern mentioned in the
previous reports i.e. 18600 / 5611. This coincided with the
breakout from the ‘Downward Sloping Channel’ in hourly
chart. As expected, we witnessed tremendous buying interest
which resulted in massive intraday rally of 2%. We are now
observing that indices have convincingly traversed ‘200-day
SMA’. Also, the daily ‘ADX (9)’ indicator is now signaling a
positive crossover. These evidences indicate possibility of a
further upside rally in the near term. Hence, we expect our
indices to test
19061 / 5755 level in coming trading
sessions. On the flipside, 18600 / 5611 would now provide
decent support for the market.
1
Daily Technical Report
April 17, 2013
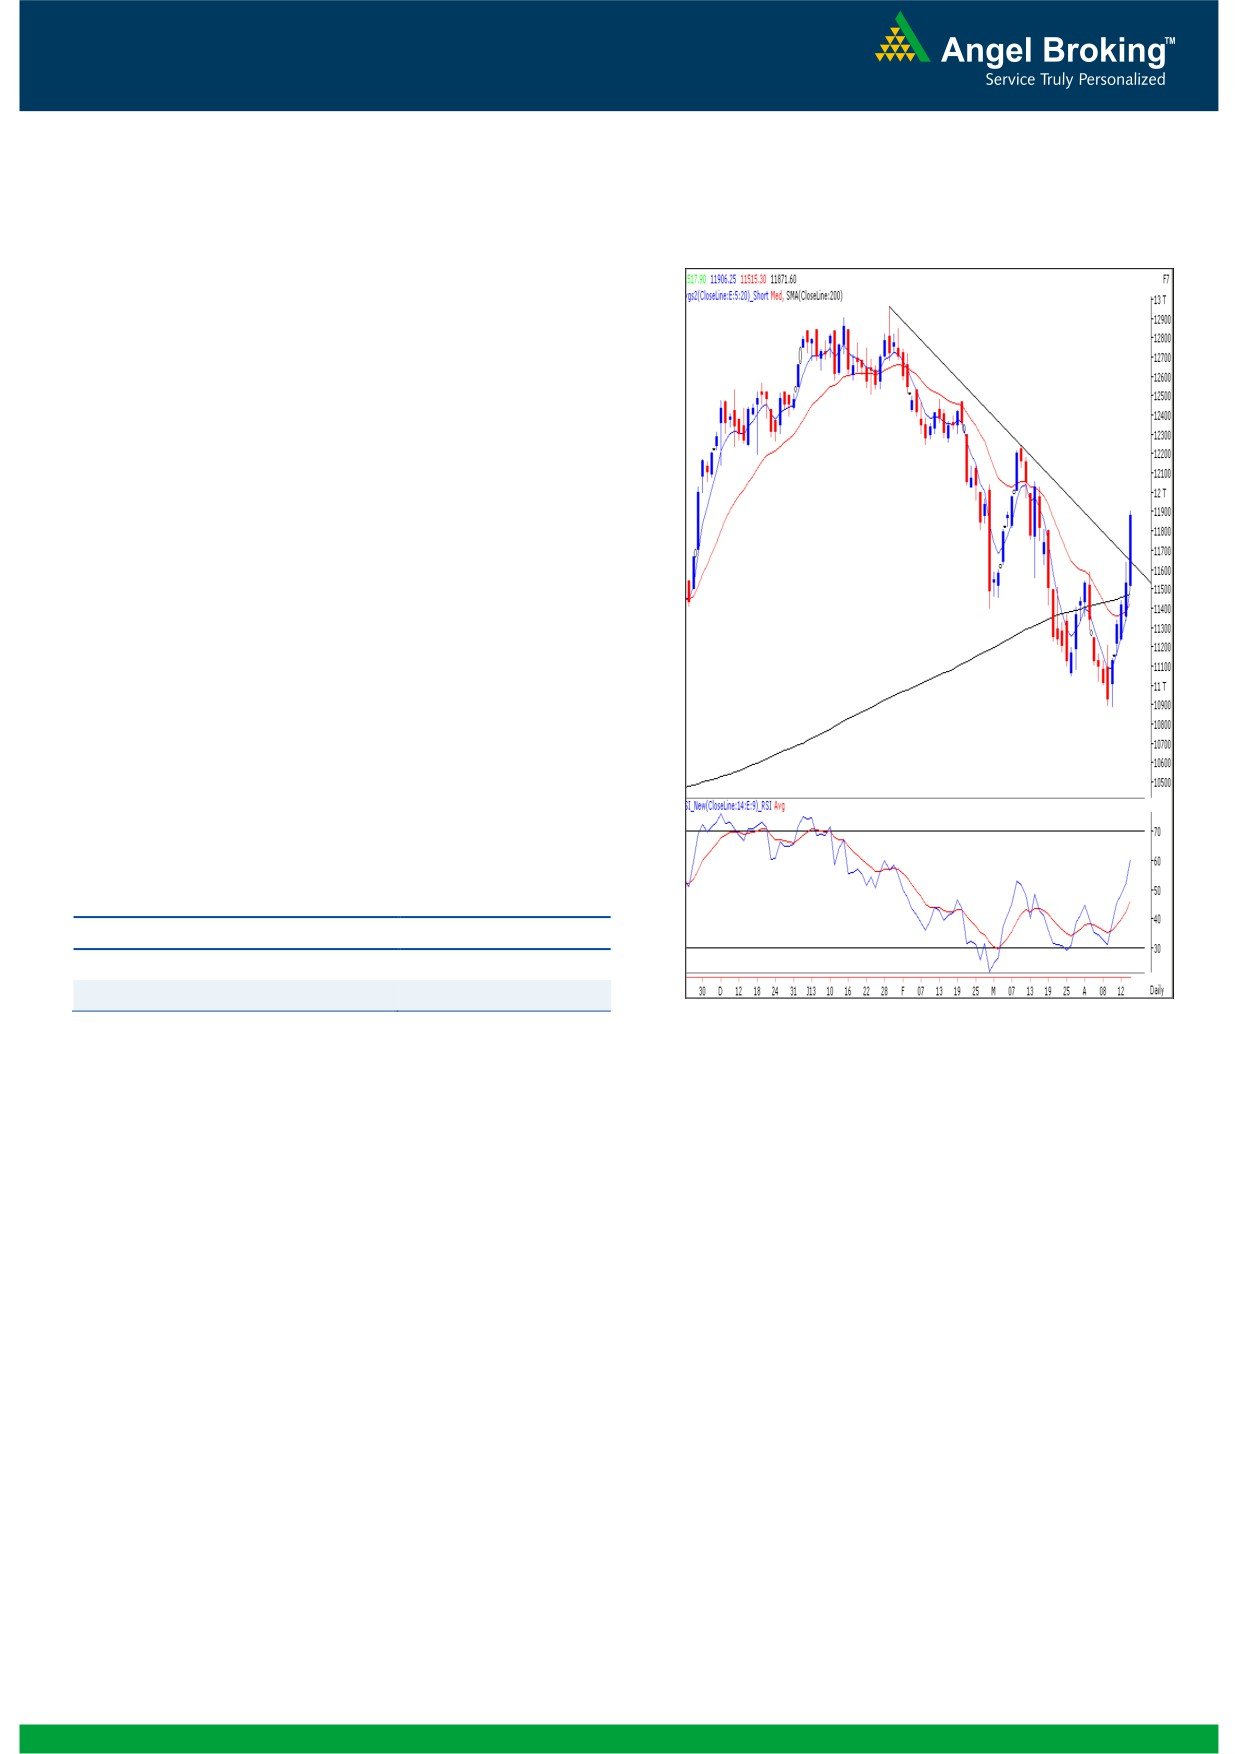
Exhibit 2: Bank Nifty Daily Chart
Bank Nifty Outlook - (11872)
Yesterday, Bank Nifty opened on a flat to positive note
ignoring the bearish global sentiments and continued to
soar higher throughout the session to close with a massive
gain of 3 %. The momentum oscillators on the hourly
chart continue to be placed well inside the overbought
territory. However, one should remember that the
oscillators can stay in the overbought zone for a long
period of time. We are now approaching the ‘Falling
Wedge’ pattern target of 12100. We are also witnessing
a trend line breakout by joining the two significant highs
of January 29, 2013 and March 11, 2013. Traders
holding long positions in the index can book partial
profits near 12100 and should trail their stop losses to
11480 levels. We reiterate our view that any dip in the
index should be used to create long positions. For the day
12058 - 12169 levels are likely to act as resistance,
whereas 11720 - 11680 levels are likely to act as
support.
Actionable points:
View
Bullish Above 11906
Expected Target
12058 - 12169
Support Levels
11720 - 11680
Source: Falcon:
2
Daily Technical Report
April 17, 2013
Daily Pivot Levels for Nifty 50 Stocks
SCRIPS
S2
S1
PIVOT
R1
R2
SENSEX
18,168
18,457
18,614
18,902
19,060
NIFTY
5,505
5,597
5,648
5,740
5,791
BANKNIFTY
11,373
11,623
11,764
12,013
12,155
ACC
1,105
1,140
1,163
1,198
1,221
AMBUJACEM
170
175
178
184
187
ASIANPAINT
4,597
4,642
4,681
4,726
4,764
AXISBANK
1,252
1,308
1,338
1,394
1,425
BAJAJ-AUTO
1,688
1,729
1,755
1,796
1,821
BANKBARODA
670
675
680
686
690
BHARTIARTL
276
280
283
288
291
BHEL
176
179
181
184
187
BPCL
391
399
404
412
417
CAIRN
283
286
288
290
293
CIPLA
391
396
399
403
406
COALINDIA
290
292
294
297
299
DLF
236
241
244
248
251
DRREDDY
1,821
1,872
1,904
1,956
1,988
GAIL
315
318
320
323
325
GRASIM
2,721
2,777
2,808
2,864
2,895
HCLTECH
751
757
764
770
776
HDFC
760
782
794
817
829
HDFCBANK
634
649
657
672
681
HEROMOTOCO
1,415
1,452
1,475
1,512
1,536
HINDALCO
88
91
92
94
96
HINDUNILVR
466
476
481
491
497
ICICIBANK
1,029
1,054
1,069
1,094
1,110
IDFC
142
148
152
158
161
INDUSINDBK
396
407
414
425
433
INFY
2,264
2,280
2,303
2,319
2,342
ITC
294
301
305
312
316
JINDALSTEL
319
328
335
344
350
JPASSOCIAT
71
73
74
75
76
KOTAKBANK
628
641
649
662
671
LT
1,357
1,392
1,411
1,446
1,465
LUPIN
643
650
656
663
668
M&M
795
820
834
859
873
MARUTI
1,389
1,435
1,462
1,508
1,535
NMDC
125
127
128
130
131
NTPC
138
141
143
146
148
ONGC
315
324
328
337
341
PNB
718
729
739
751
761
POWERGRID
102
105
106
109
110
RANBAXY
432
441
445
454
459
RELIANCE
776
790
800
815
825
RELINFRA
344
356
363
374
381
SBIN
2,118
2,151
2,172
2,205
2,226
SESAGOA
139
141
143
145
146
SUNPHARMA
859
874
884
900
910
TATAMOTORS
259
265
269
275
278
TATAPOWER
94
95
97
98
101
TATASTEEL
289
294
297
302
305
TCS
1,443
1,463
1,478
1,498
1,514
ULTRACEMCO
1,825
1,861
1,886
1,922
1,947
3
Daily Technical Report
April 17, 2013
Research Team Tel: 022 - 30940000
DISCLAIMER
This document is solely for the personal information of the recipient, and must not be singularly used as the basis of any investment
decision. Nothing in this document should be construed as investment or financial advice. Each recipient of this document should make
such investigations as they deem necessary to arrive at an independent evaluation of an investment in the securities of the companies
referred to in this document (including the merits and risks involved), and should consult their own advisors to determine the merits and
risks of such an investment.
Angel Broking Limited, its affiliates, directors, its proprietary trading and investment businesses may, from time to time, make
investment decisions that are inconsistent with or contradictory to the recommendations expressed herein. The views contained in this
document are those of the analyst, and the company may or may not subscribe to all the views expressed within.
Reports based on technical and derivative analysis center on studying charts of a stock's price movement, outstanding positions and
trading volume, as opposed to focusing on a company's fundamentals and, as such, may not match with a report on a company's
fundamentals.
The information in this document has been printed on the basis of publicly available information, internal data and other reliable
sources believed to be true, but we do not represent that it is accurate or complete and it should not be relied on as such, as this
document is for general guidance only. Angel Broking Limited or any of its affiliates/ group companies shall not be in any way
responsible for any loss or damage that may arise to any person from any inadvertent error in the information contained in this report.
Angel Broking Limited has not independently verified all the information contained within this document. Accordingly, we cannot testify,
nor make any representation or warranty, express or implied, to the accuracy, contents or data contained within this document. While
Angel Broking Limited endeavors to update on a reasonable basis the information discussed in this material, there may be regulatory,
compliance, or other reasons that prevent us from doing so.
This document is being supplied to you solely for your information, and its contents, information or data may not be reproduced,
redistributed or passed on, directly or indirectly.
Angel Broking Limited and its affiliates may seek to provide or have engaged in providing corporate finance, investment banking or
other advisory services in a merger or specific transaction to the companies referred to in this report, as on the date of this report or in
the past.
Neither Angel Broking Limited, nor its directors, employees or affiliates shall be liable for any loss or damage that may arise from or in
connection with the use of this information.
Note: Please refer to the important `Stock Holding Disclosure' report on the Angel website (Research Section). Also, please refer to the
latest update on respective stocks for the disclosure status in respect of those stocks. Angel Broking Limited and its affiliates may have
investment positions in the stocks recommended in this report.
Research Team
Shardul Kulkarni
-
Head - Technicals
Sameet Chavan
-
Technical Analyst
Sacchitanand Uttekar
-
Technical Analyst
Ankur Lakhotia
-
Technical Analyst
Angel Broking Pvt. Ltd.
Registered Office: G-1, Ackruti Trade Centre, Rd. No. 7, MIDC, Andheri (E), Mumbai - 400 093.
Corporate Office: 6th Floor, Ackruti Star, MIDC, Andheri (E), Mumbai - 400 093. Tel: (022) 30940000
Sebi Registration No: INB 010996539
4