Daily Technical Report
April 16, 2013
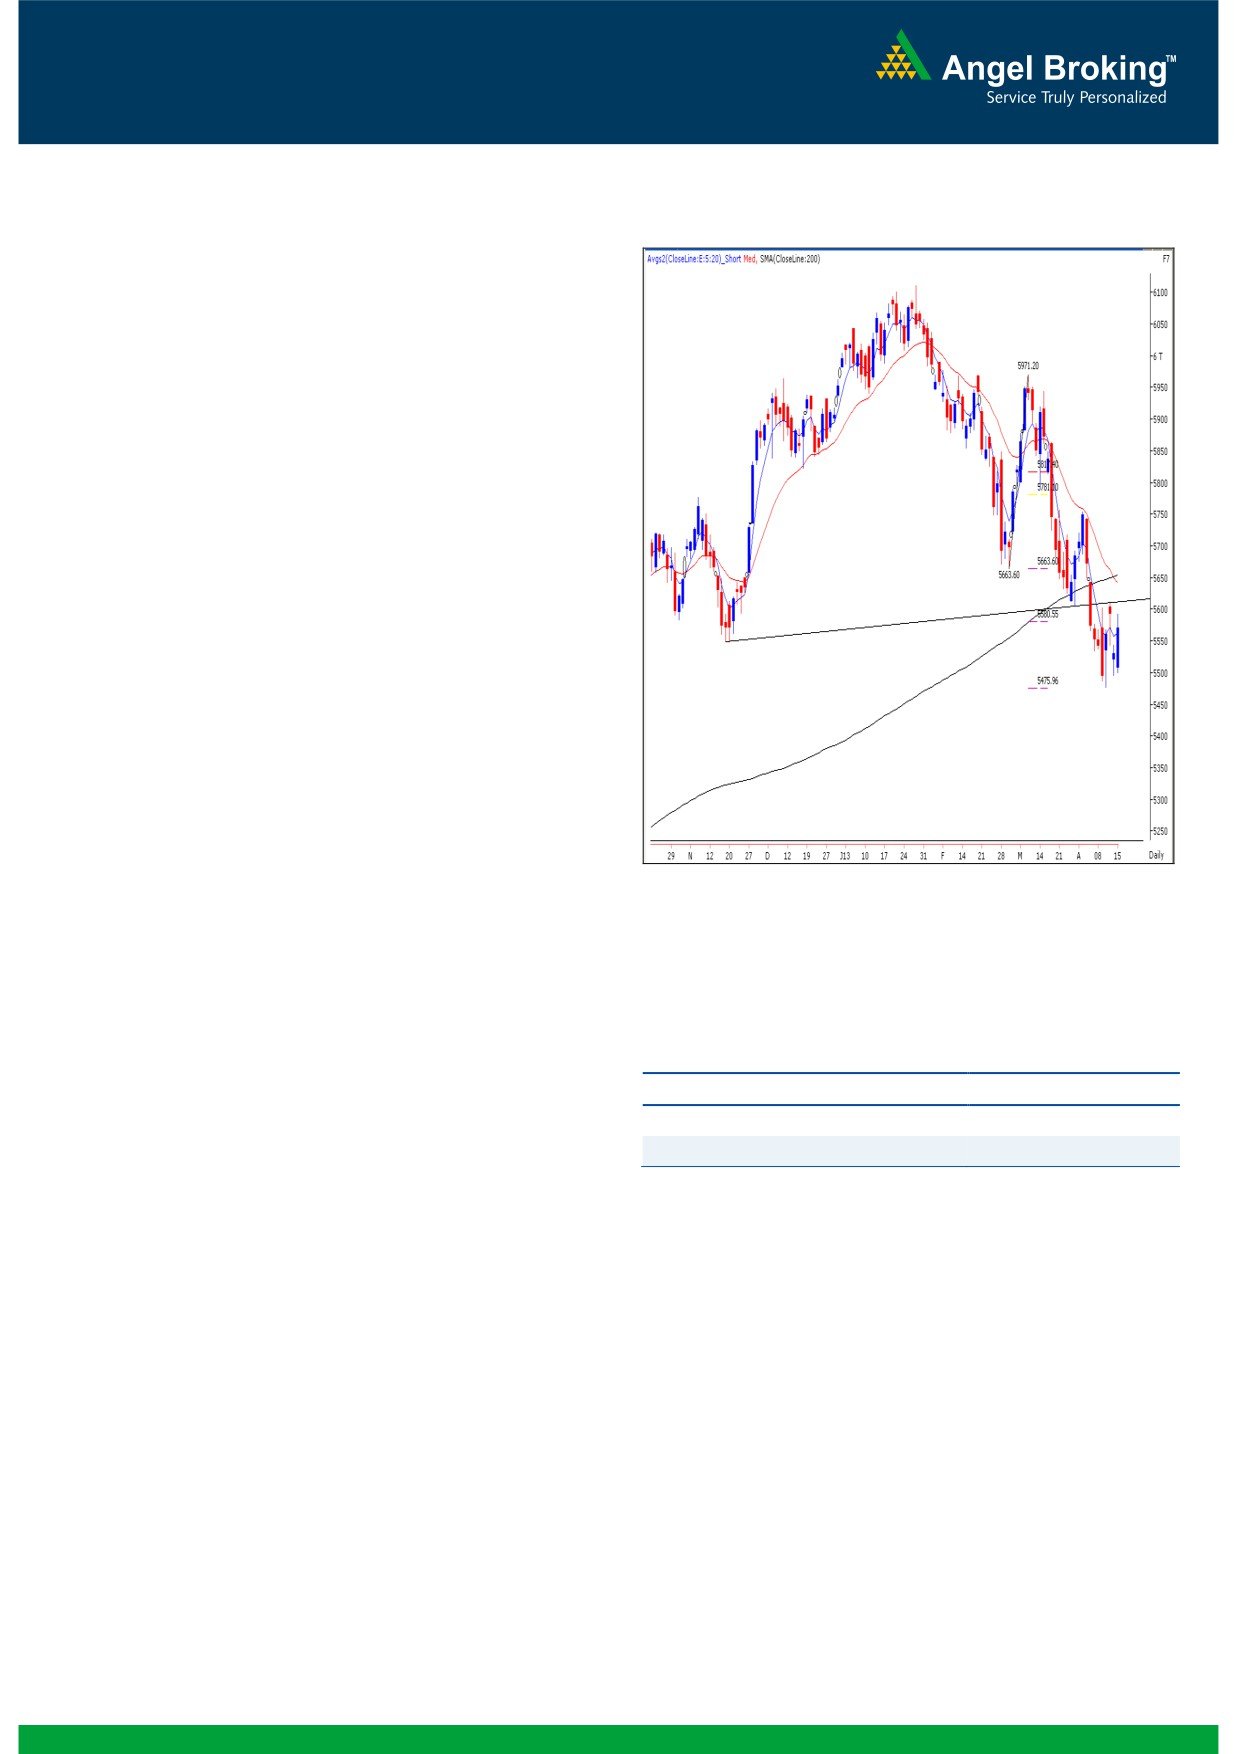
Exhibit 1: Nifty Daily Chart
Sensex (18358) / NIFTY (5568)
The first session of the week began marginally lower in-line
with weak Asian bourses. Post the announcement of inflation
numbers we witnessed a sudden spurt in the market, which
pushed indices significantly higher to end the session well
inside the positive territory. During the day Oil & Gas,
FMCG and PSU counters were among the major gainers
whereas Consumer Durables, Metal and Auto stocks ended
in the red. The advance to decline ratio was in favor of
advancing counters (A=1266 D=1042)
(Source-
Formation
The ’20-week EMA’ and the ’20-day EMA’ are placed at
18949 / 5736 and 18682 / 5641 levels, respectively.
The ’89-week EMA’ and the ‘200-day SMA’ are placed
at 18195 / 5503 and 18648 / 5654, respectively.
The ‘Lower Top Lower Bottom’ formation on weekly
chart is still intact.
Source: Falcon:
We are observing a ‘Spinning Top’ (only in Nifty)
Japanese candlestick pattern on the weekly chart.
Actionable points:
Trading strategy:
Despite strong negative cues from major Asian bourses, our
View
Bullish Above 5593
benchmark indices managed to trade with positive bias
Expected Targets
5611 - 5654
throughout the second half of the session. Since, there is no
Support levels
5494 - 5477
major change in the chart structure, we reiterate our view
that 18600 / 5611 remains to be an important hurdle for the
bulls. Only a sustainable move beyond this level may push
indices higher to test 19061 / 5755 level. On the flipside,
the crucial support remains at
18173
/
5477. Any
sustainable move below this would trigger further pessimism
in the market. As a result, indices may resume their negative
trend and may slide towards 17976 - 17677 / 5441 - 5332.
Broadly speaking, the indices are presently within the trading
range of 18600 / 5611 - 18170 / 5475. Any sustainable
move outside this range will dictate the direction of the
market in the near term.
1
Daily Technical Report
April 16, 2013
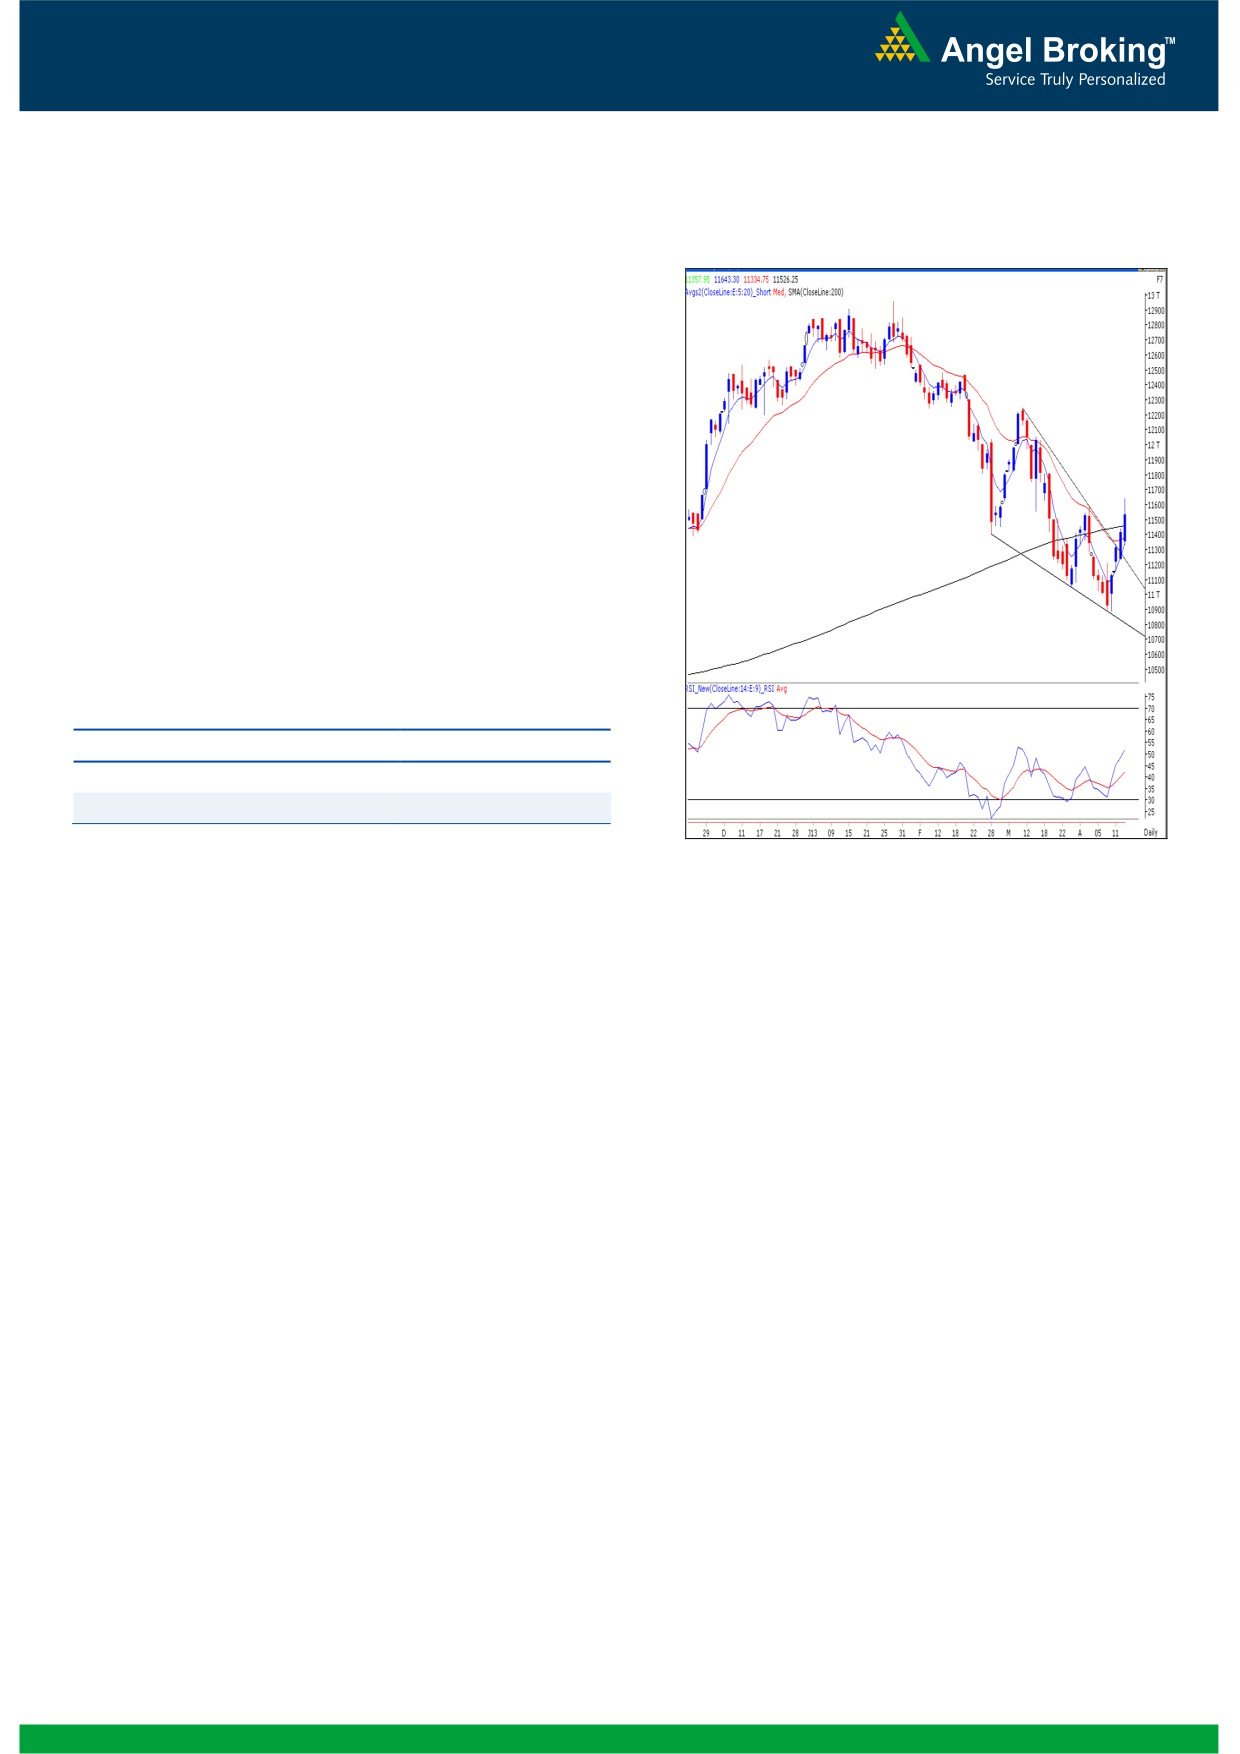
Exhibit 2: Bank Nifty Daily Chart
Bank Nifty Outlook - (11526)
Yesterday, Bank Nifty opened on a flat note unlike our
benchmark indices and showed strength throughout the
session to close in the positive territory. The positive
crossover in ‘RSI’ momentum oscillator on the daily chart
is still intact. However, the momentum oscillators on the
hourly chart are placed well inside the overbought
territory and some consolidation or pullback in the index
cannot be ruled out. As the ‘Falling Wedge’ pattern
breakout in the index is still valid we advise traders to use
these dips in the index to create fresh long positions. On
the downside 11334 - 11288 levels are likely to act as
support for the day.
Actionable points:
View
Neutral
Resistance Levels
11580 - 11643
Support Levels
11334 - 11288
Source: Falcon:
2
Daily Technical Report
April 16, 2013
Research Team Tel: 022 - 30940000
DISCLAIMER
This document is solely for the personal information of the recipient, and must not be singularly used as the basis of any investment
decision. Nothing in this document should be construed as investment or financial advice. Each recipient of this document should make
such investigations as they deem necessary to arrive at an independent evaluation of an investment in the securities of the companies
referred to in this document (including the merits and risks involved), and should consult their own advisors to determine the merits and
risks of such an investment.
Angel Broking Limited, its affiliates, directors, its proprietary trading and investment businesses may, from time to time, make
investment decisions that are inconsistent with or contradictory to the recommendations expressed herein. The views contained in this
document are those of the analyst, and the company may or may not subscribe to all the views expressed within.
Reports based on technical and derivative analysis center on studying charts of a stock's price movement, outstanding positions and
trading volume, as opposed to focusing on a company's fundamentals and, as such, may not match with a report on a company's
fundamentals.
The information in this document has been printed on the basis of publicly available information, internal data and other reliable
sources believed to be true, but we do not represent that it is accurate or complete and it should not be relied on as such, as this
document is for general guidance only. Angel Broking Limited or any of its affiliates/ group companies shall not be in any way
responsible for any loss or damage that may arise to any person from any inadvertent error in the information contained in this report.
Angel Broking Limited has not independently verified all the information contained within this document. Accordingly, we cannot testify,
nor make any representation or warranty, express or implied, to the accuracy, contents or data contained within this document. While
Angel Broking Limited endeavors to update on a reasonable basis the information discussed in this material, there may be regulatory,
compliance, or other reasons that prevent us from doing so.
This document is being supplied to you solely for your information, and its contents, information or data may not be reproduced,
redistributed or passed on, directly or indirectly.
Angel Broking Limited and its affiliates may seek to provide or have engaged in providing corporate finance, investment banking or
other advisory services in a merger or specific transaction to the companies referred to in this report, as on the date of this report or in
the past.
Neither Angel Broking Limited, nor its directors, employees or affiliates shall be liable for any loss or damage that may arise from or in
connection with the use of this information.
Note: Please refer to the important `Stock Holding Disclosure' report on the Angel website (Research Section). Also, please refer to the
latest update on respective stocks for the disclosure status in respect of those stocks. Angel Broking Limited and its affiliates may have
investment positions in the stocks recommended in this report.
Research Team
Shardul Kulkarni
-
Head - Technicals
Sameet Chavan
-
Technical Analyst
Sacchitanand Uttekar
-
Technical Analyst
Ankur Lakhotia
-
Technical Analyst
Angel Broking Pvt. Ltd.
Registered Office: G-1, Ackruti Trade Centre, Rd. No. 7, MIDC, Andheri (E), Mumbai - 400 093.
Corporate Office: 6th Floor, Ackruti Star, MIDC, Andheri (E), Mumbai - 400 093. Tel: (022) 30940000
Sebi Registration No: INB 010996539
4