Daily Technical Report
January 16, 2013
Sensex (19987) / NIFTY (6057)
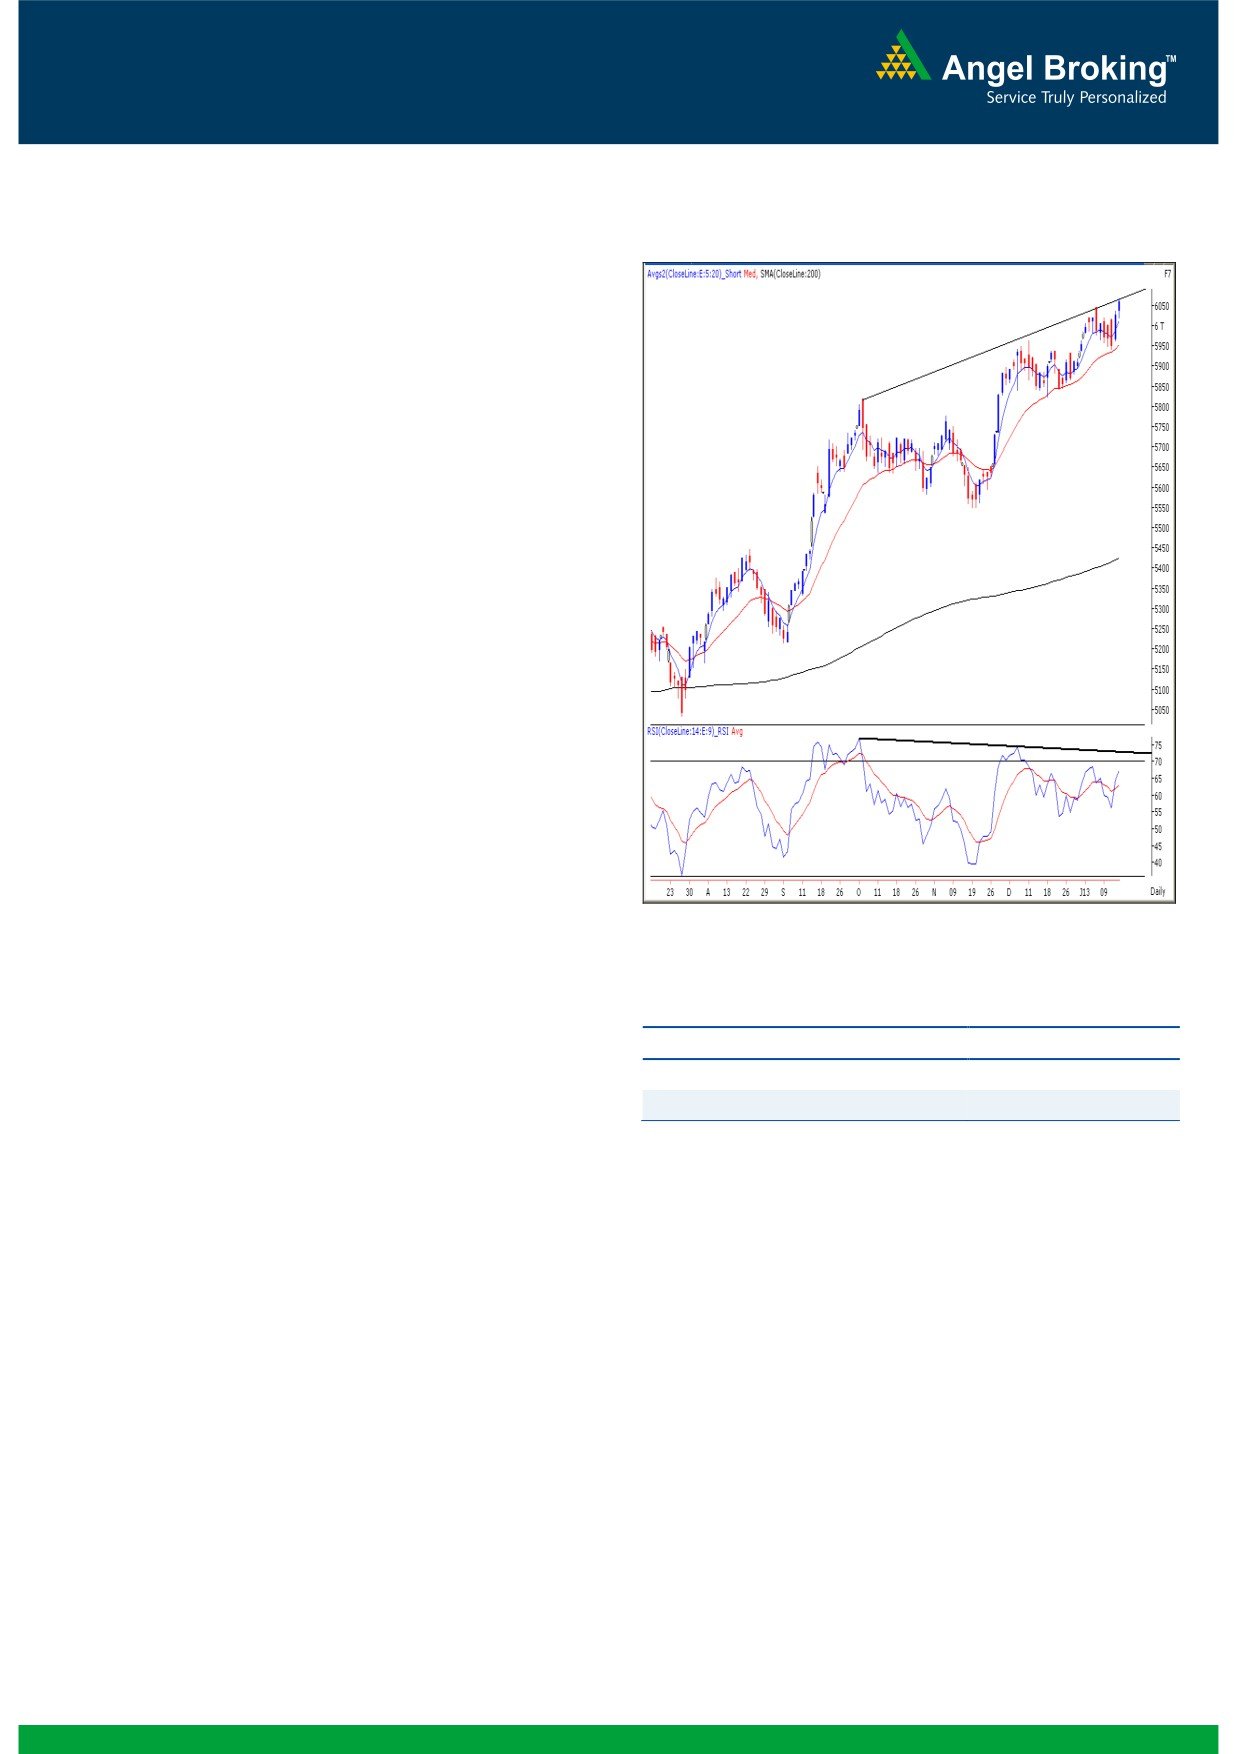
Exhibit 1: Nifty Daily Chart
Yesterday, our benchmark indices opened marginally higher
on the back of strong quarterly results from the IT major
TCS. Subsequently markets traded with a positive bias to
close at a new 52 week high. Yesterday’s rally was led by the
rate sensitive sectors, the Realty and the Banking counters;
whereas Metal counters remained marginally under
pressure. The advance to decline ratio was in favor of
declining counters (A=1126 D=1154) (Source
-
Formation
The ’20-day EMA’ and the ’20-week EMA’ are placed at
19562 / 5942 and 18937 / 5749 levels, respectively.
On the daily chart, the benchmark indices are facing
resistance near the ‘Upward Sloping Trend Line’ drawn
by joining the highs of October 5, 2012 and December
11, 2012.
The daily ‘RSI - Smoothened’ is negatively poised.
We are also observing a ‘Negative Divergence’ in the
Source: Falcon:
daily ‘RSI’ momentum oscillator.
Actionable points:
Trading strategy:
View
Neutral
The strong closing on Monday was followed by a marginal
Resistance Levels
6070 - 6125
gap up opening yesterday. Further, we observed immense
Support Levels
6046 - 6018
buying interest during the second half of the session. In the
process, indices have now precisely tested ‘Upward Sloping
Trend Line’ (please refer exhibit) and also have confirmed yet
another ‘Negative Divergence’ in daily ‘RSI’ momentum
oscillator. Hence, going forward, we reiterate that traders
should consider reducing long positions and partial profit
booking in individual large cap counters near to the 19950 -
20100 / 6070 - 6125 . On the flipside, yesterday’s low of
19880 / 6018 would act as a key support level in coming
trading session. A fall below this level of 19880 / 6018 will
attract significant profit booking and the markets may then
head towards 19770 / 5970 level.
1
Daily Technical Report
January 16, 2013
Bank Nifty Outlook - (12855)
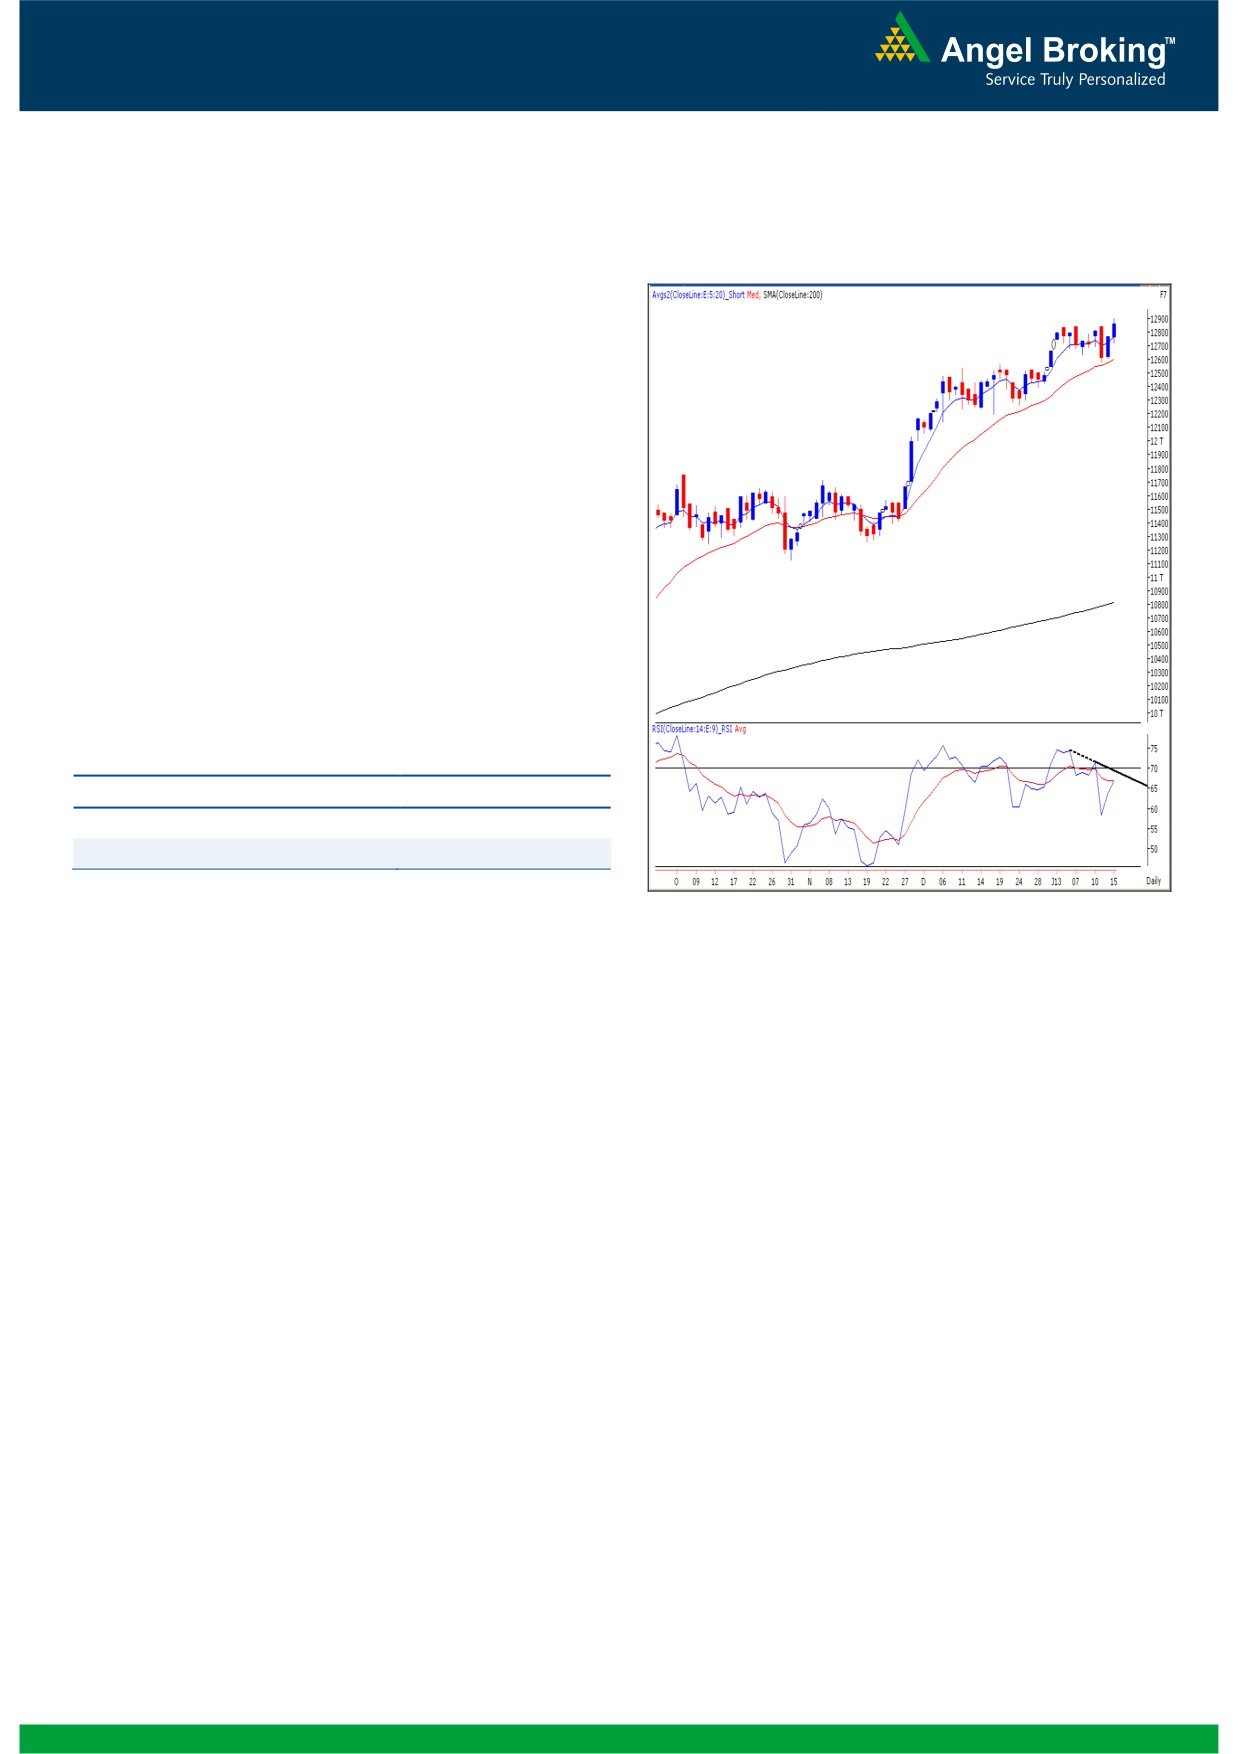
Exhibit 2: Bank Nifty Daily Chart
Yesterday, Bank Nifty opened flat and traded in a narrow
range during the first half of the session. However, the
expectations of a generous rate cut by the RBI lifted the
sentiments in the second half and the index tested the
mentioned level of 12902 surpassing the range of 12838 -
12442 levels. Despite registering and closing at a new ’52-
Week’ high, we are witnessing a negative divergence in ‘RSI’
oscillator on the daily chart of Bank Nifty. Going forward,
this could be a sign of concern for the bulls. On the upside,
a sustainable move above the 12910 level would lead index
to higher levels of 13000. At this juncture, considering the
negative divergence, we advise traders to reduce long
positions and wait for declines to enter into the market.
Actionable points:
View
Neutral
Resistance levels
12910 - 13000
Support Levels
12808 - 12718
Source: Falcon:
2
Daily Technical Report
January 16, 2013
Research Team Tel: 022 - 39357800
DISCLAIMER
This document is solely for the personal information of the recipient, and must not be singularly used as the basis of any investment
decision. Nothing in this document should be construed as investment or financial advice. Each recipient of this document should make
such investigations as they deem necessary to arrive at an independent evaluation of an investment in the securities of the companies
referred to in this document (including the merits and risks involved), and should consult their own advisors to determine the merits and
risks of such an investment.
Angel Broking Limited, its affiliates, directors, its proprietary trading and investment businesses may, from time to time, make
investment decisions that are inconsistent with or contradictory to the recommendations expressed herein. The views contained in this
document are those of the analyst, and the company may or may not subscribe to all the views expressed within.
Reports based on technical and derivative analysis center on studying charts of a stock's price movement, outstanding positions and
trading volume, as opposed to focusing on a company's fundamentals and, as such, may not match with a report on a company's
fundamentals.
The information in this document has been printed on the basis of publicly available information, internal data and other reliable
sources believed to be true, but we do not represent that it is accurate or complete and it should not be relied on as such, as this
document is for general guidance only. Angel Broking Limited or any of its affiliates/ group companies shall not be in any way
responsible for any loss or damage that may arise to any person from any inadvertent error in the information contained in this report.
Angel Broking Limited has not independently verified all the information contained within this document. Accordingly, we cannot testify,
nor make any representation or warranty, express or implied, to the accuracy, contents or data contained within this document. While
Angel Broking Limited endeavours to update on a reasonable basis the information discussed in this material, there may be regulatory,
compliance, or other reasons that prevent us from doing so.
This document is being supplied to you solely for your information, and its contents, information or data may not be reproduced,
redistributed or passed on, directly or indirectly.
Angel Broking Limited and its affiliates may seek to provide or have engaged in providing corporate finance, investment banking or
other advisory services in a merger or specific transaction to the companies referred to in this report, as on the date of this report or in
the past.
Neither Angel Broking Limited, nor its directors, employees or affiliates shall be liable for any loss or damage that may arise from or in
connection with the use of this information.
Note: Please refer to the important `Stock Holding Disclosure' report on the Angel website (Research Section). Also, please refer to the
latest update on respective stocks for the disclosure status in respect of those stocks. Angel Broking Limited and its affiliates may have
investment positions in the stocks recommended in this report.
Research Team
Shardul Kulkarni
-
Head - Technicals
Sameet Chavan
-
Technical Analyst
Sacchitanand Uttekar
-
Technical Analyst
Mehul Kothari
-
Technical Analyst
Ankur Lakhotia
-
Technical Analyst
Angel Broking Pvt. Ltd.
Registered Office: G-1, Ackruti Trade Centre, Rd. No. 7, MIDC, Andheri (E), Mumbai - 400 093.
Corporate Office: 6th Floor, Ackruti Star, MIDC, Andheri (E), Mumbai - 400 093. Tel: (022) 3952 6600
Sebi Registration No: INB 010996539
4