Daily Technical Report
April 15, 2013
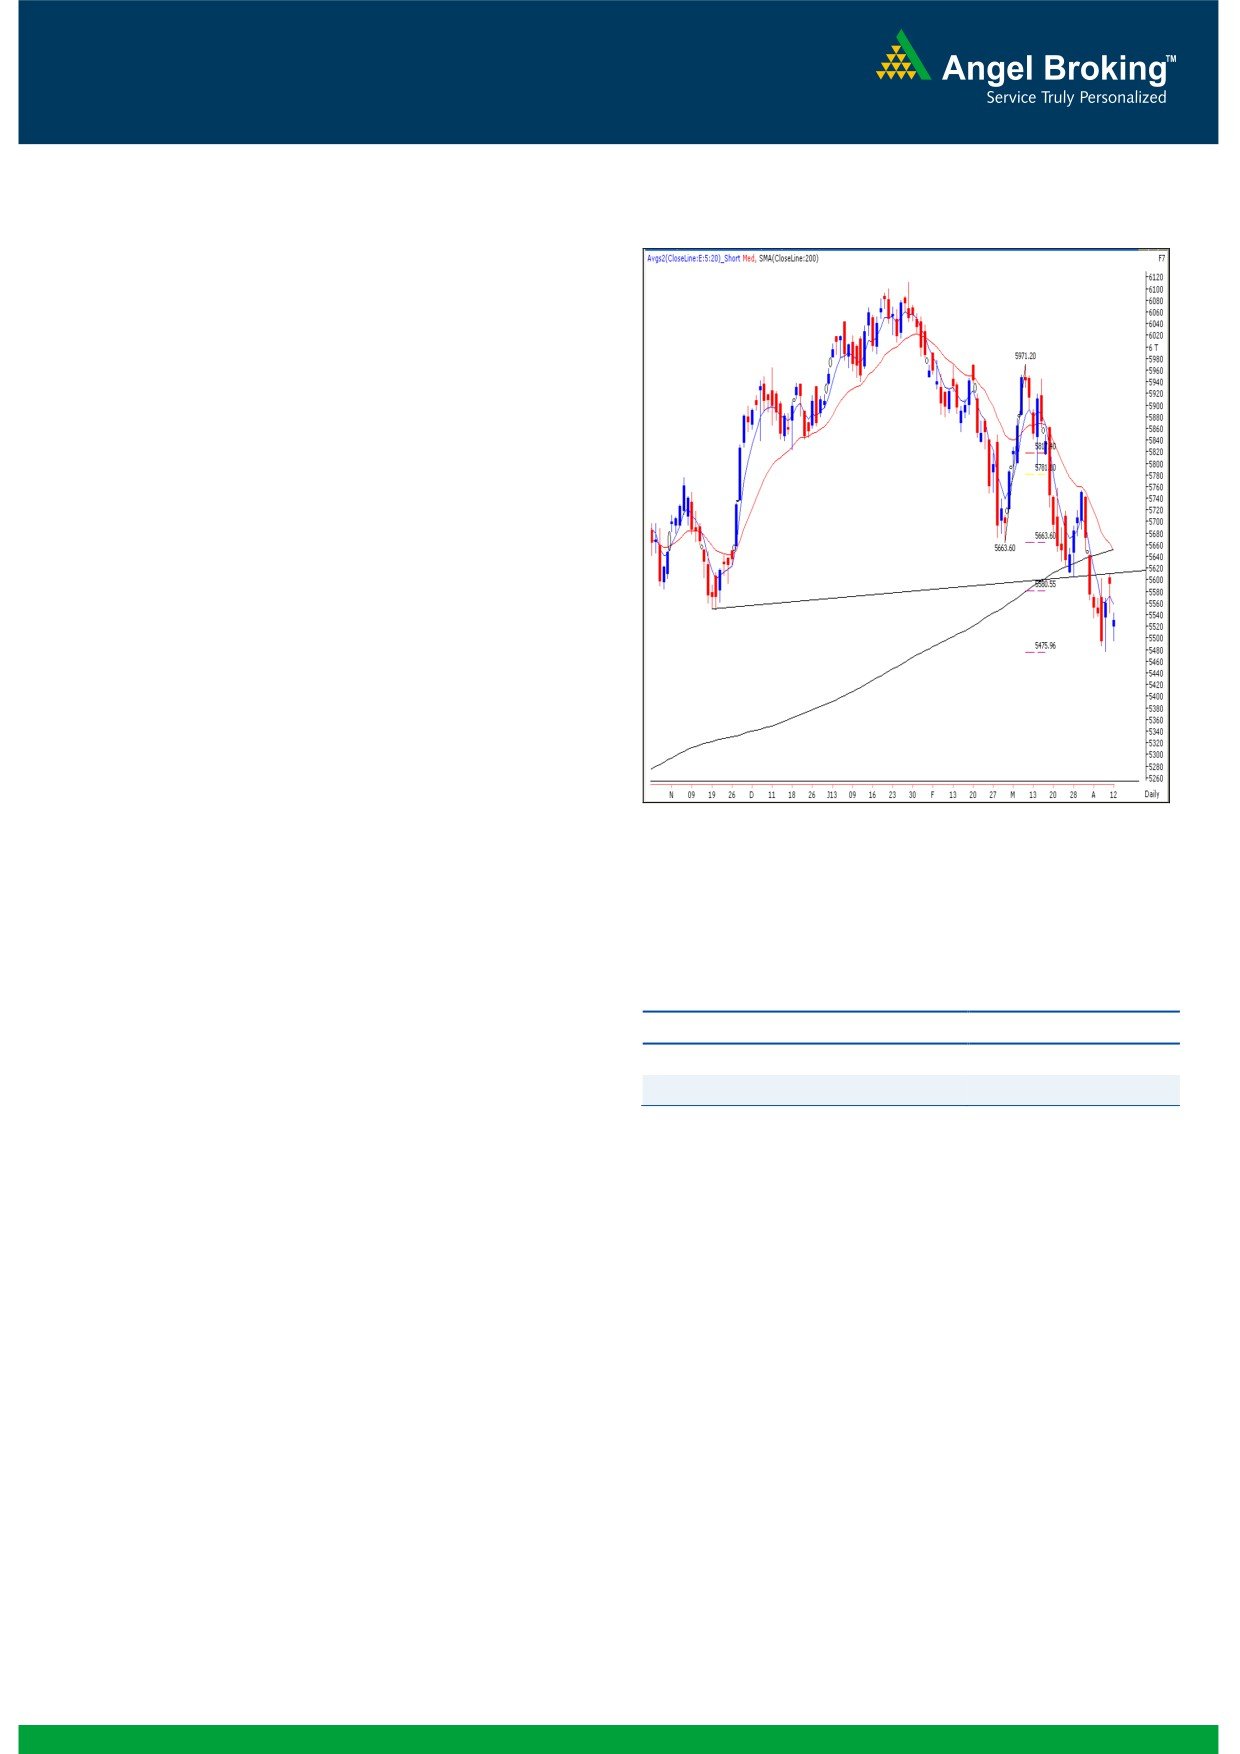
Exhibit 1: Nifty Daily Chart
Sensex (18243) / NIFTY (5529)
On Friday, our benchmark indices opened with a downside
gap on account of poor results posted by IT giant INFOSYS.
Thereafter indices traded in a narrow range to eventually
close near the initial opening level. During the day FMCG,
Power and Banking counters were among the major gainers
whereas IT, Teck and Capital Goods stocks ended in the red.
The advance to decline ratio was in favor of declining
Formation
The ’20-week EMA’ and the ’20-day EMA’ are placed at
19012 / 5753 and 18716 / 5650 levels, respectively.
The ’89-week EMA’ and the ‘200-day SMA’ are placed
at 18190 / 5500 and 18641 / 5650, respectively.
The ‘Lower Top Lower Bottom’ formation on weekly
chart is still intact.
Source: Falcon:
We are observing a ‘Spinning Top’ (only in Nifty)
Japanese candlestick pattern on the weekly chart.
Actionable points:
Trading strategy:
The week was evenly dominated by both, the bulls as well as
View
Bullish Above 5545
the bears. As expected, the indices precisely tested the
Expected Targets
5610 - 5654
mentioned support zone of weekly '89 EMA' and the 161.8%
Support levels
5494 - 5477
Fibonacci retracement level of the rise from 18760 / 5663
(low on March 04, 2013) to 19755 / 5971(high on March
A move below this week's low of 18173 / 5477 would trigger
11, 2013), during the week. The weekly chart now depicts a'
further pessimism in the market. As a result, indices may
Spinning Top' (only in Nifty) Japanese candlestick pattern. An
resume their negative trend and may slide towards 17976 -
occurrence of such a pattern at the support level indicates
17677 / 5441 - 5332. Broadly speaking, the indices are
presently within the trading range of 18600 / 5611 - 18170
uncertainty among market participants. Hence, a sustainable
/ 5475. Any sustainable move outside this range will dictate
move beyond the high (18600 / 5611) of the pattern would
the direction of the market in the near term.
open up possibilities of near term bounce. In this scenario,
indices may go back to test 19061 / 5755 level. However,
the price movement in the last two sessions does not bode
well for the bulls.
1
Daily Technical Report
April 15, 2013
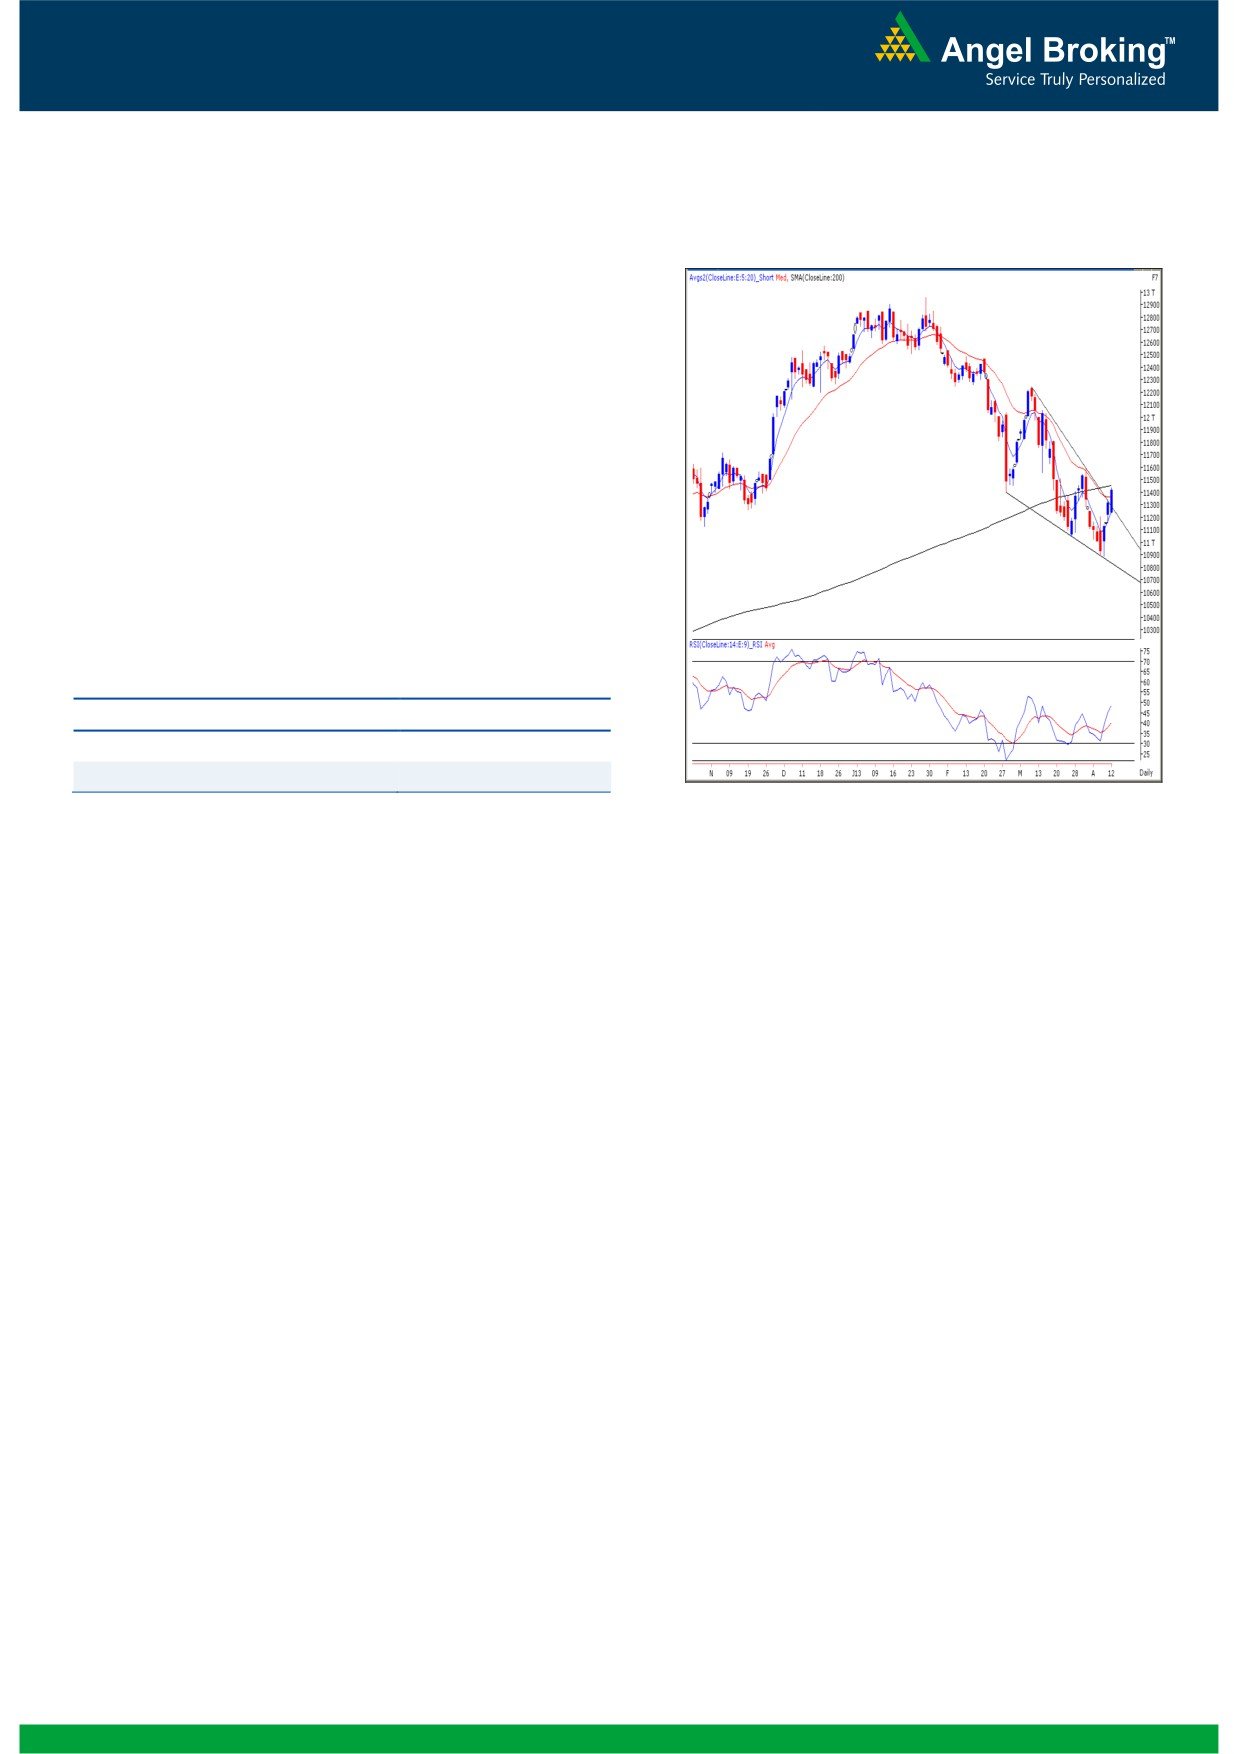
Exhibit 2: Bank Nifty Daily Chart
Bank Nifty Outlook - (11410)
On Friday, Bank Nifty opened on a flat note unlike our
benchmark indices and showed strength throughout the
session to close in the positive territory. The positive
crossover in ‘RSI’ momentum oscillator on the daily chart
is still intact. We are now witnessing a ‘Falling Wedge’
pattern breakout in the index implying a target of 12100
over the next few sessions. Hence going forward any dip
in the index should be used as a buying opportunity. On
the downside 11278 - 11154 levels are likely to act as
support for the day. The stop loss for the trade should be
placed at 10888 levels.
Actionable points:
View
Bullish Above 11443
Expected Target
11510 - 11591
Support Levels
11278 - 11154
Source: Falcon:
2
Daily Technical Report
April 15, 2013
Research Team Tel: 022 - 30940000
DISCLAIMER
This document is solely for the personal information of the recipient, and must not be singularly used as the basis of any investment
decision. Nothing in this document should be construed as investment or financial advice. Each recipient of this document should make
such investigations as they deem necessary to arrive at an independent evaluation of an investment in the securities of the companies
referred to in this document (including the merits and risks involved), and should consult their own advisors to determine the merits and
risks of such an investment.
Angel Broking Limited, its affiliates, directors, its proprietary trading and investment businesses may, from time to time, make
investment decisions that are inconsistent with or contradictory to the recommendations expressed herein. The views contained in this
document are those of the analyst, and the company may or may not subscribe to all the views expressed within.
Reports based on technical and derivative analysis center on studying charts of a stock's price movement, outstanding positions and
trading volume, as opposed to focusing on a company's fundamentals and, as such, may not match with a report on a company's
fundamentals.
The information in this document has been printed on the basis of publicly available information, internal data and other reliable
sources believed to be true, but we do not represent that it is accurate or complete and it should not be relied on as such, as this
document is for general guidance only. Angel Broking Limited or any of its affiliates/ group companies shall not be in any way
responsible for any loss or damage that may arise to any person from any inadvertent error in the information contained in this report.
Angel Broking Limited has not independently verified all the information contained within this document. Accordingly, we cannot testify,
nor make any representation or warranty, express or implied, to the accuracy, contents or data contained within this document. While
Angel Broking Limited endeavors to update on a reasonable basis the information discussed in this material, there may be regulatory,
compliance, or other reasons that prevent us from doing so.
This document is being supplied to you solely for your information, and its contents, information or data may not be reproduced,
redistributed or passed on, directly or indirectly.
Angel Broking Limited and its affiliates may seek to provide or have engaged in providing corporate finance, investment banking or
other advisory services in a merger or specific transaction to the companies referred to in this report, as on the date of this report or in
the past.
Neither Angel Broking Limited, nor its directors, employees or affiliates shall be liable for any loss or damage that may arise from or in
connection with the use of this information.
Note: Please refer to the important `Stock Holding Disclosure' report on the Angel website (Research Section). Also, please refer to the
latest update on respective stocks for the disclosure status in respect of those stocks. Angel Broking Limited and its affiliates may have
investment positions in the stocks recommended in this report.
Research Team
Shardul Kulkarni
-
Head - Technicals
Sameet Chavan
-
Technical Analyst
Sacchitanand Uttekar
-
Technical Analyst
Ankur Lakhotia
-
Technical Analyst
Angel Broking Pvt. Ltd.
Registered Office: G-1, Ackruti Trade Centre, Rd. No. 7, MIDC, Andheri (E), Mumbai - 400 093.
Corporate Office: 6th Floor, Ackruti Star, MIDC, Andheri (E), Mumbai - 400 093. Tel: (022) 30940000
Sebi Registration No: INB 010996539
4