Daily Technical Report
March 15, 2013
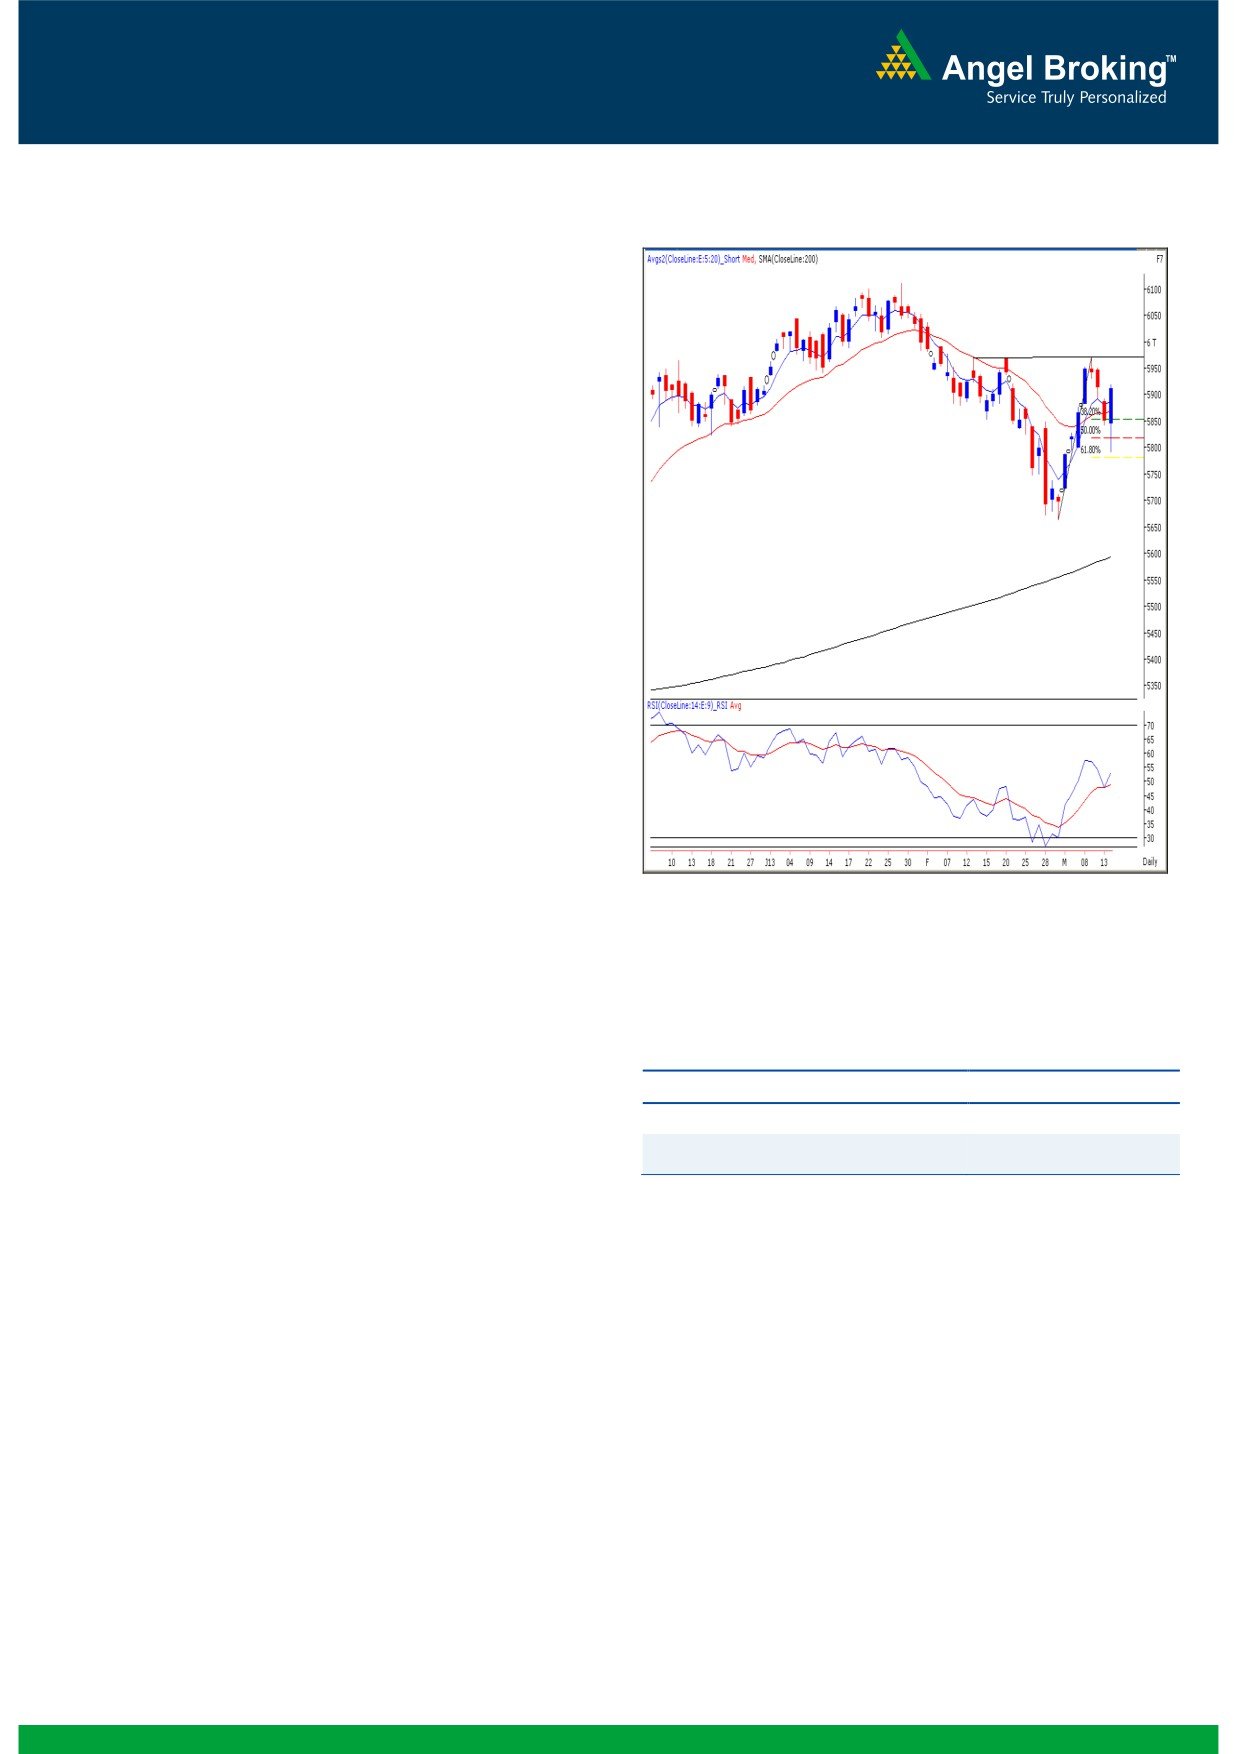
Exhibit 1: Nifty Daily Chart
Sensex (19570) / NIFTY (5909)
Yesterday, indices opened with a neutral bias as indicated by
the SGX Nifty. Subsequently, we observed immense selling
pressure in our market, which resulted in sharp fall of nearly
a percent. However, indices managed to recover from day’s
low to eventually end the session well inside the positive
territory. The Realty, Banking, Capital Goods and Oil & Gas
counters dominated yesterday’s intraday rally; whereas
Consumer Durables was the only sector that remained under
pressure throughout the session. The advance to decline
ratio was marginally in favor of declining counters
(A=1425D=1443)
Formation
The ’20-day EMA’ and the ’20-week EMA’ are placed at
19408 / 5868 and 19257 / 5833 levels, respectively.
The weekly chart exhibits a ‘Bullish Engulfing’ pattern but
the monthly chart exhibits a ‘Bearish Engulfing’ pattern.
The daily ‘ADX
(14)’ indicator and the weekly
‘Stochastic’ momentum oscillator is now signaling a
Source: Falcon:
positive crossover.
The level of the weekly ‘RSI’ momentum oscillator has
now bounced back sharply to 58.20 after dropping
below the 50 mark.
Actionable points:
Indices have closed above the ‘Downward Sloping Trend
Line’, drawn by joining two significant highs of 21109 /
View
Bullish above 5920
6339 (high of November 05, 2010 weekly candle) and
Expected target
5971
19137 / 5816 (high of October 05, 2012 weekly
5893 - 5850
candle).
Support levels
Trading strategy:
After a flat opening, indices immediately slipped below the
Considering yesterday’s strong closing, we are of the opinion
critical support level of 19322 / 5837.This resulted in a swift
that indices are likely to test their immediate swing high of
decline on higher volumes to precisely test the next
19755 / 5971, if they sustain above 19605 / 5920. The
mentioned support level of 19195 / 5790. In this process,
daily ‘RSI’ oscillator has turned upwards from the 50 mark,
indices managed to fill a minor upside gap created on
indicating strength in the upside momentum. A move beyond
March 06, 2013. This 19195 /5970 level also coincides with
19755 / 5971 would confirm a higher degree breakout of
the 61.80% Fibonacci retracement level of the rise from
the bullish pattern. This may attract immense buying interest
18760 / 5663 (low on March 04, 2012) to 19755 / 5971
among market participants. In this scenario, indices may
(high on March 11, 2013). Therefore, immense buying
initially rally towards 19884 / 6008 level. On the flipside,
interest around this level resulted in a recovery as markets
19338 / 5842 and 19179 / 5791 are likely to act as key
managed to cross previous high of 18512 / 5894 and
support levels for our market in coming trading session.
eventually, close convincingly above it.
1
Daily Technical Report
March 15, 2013
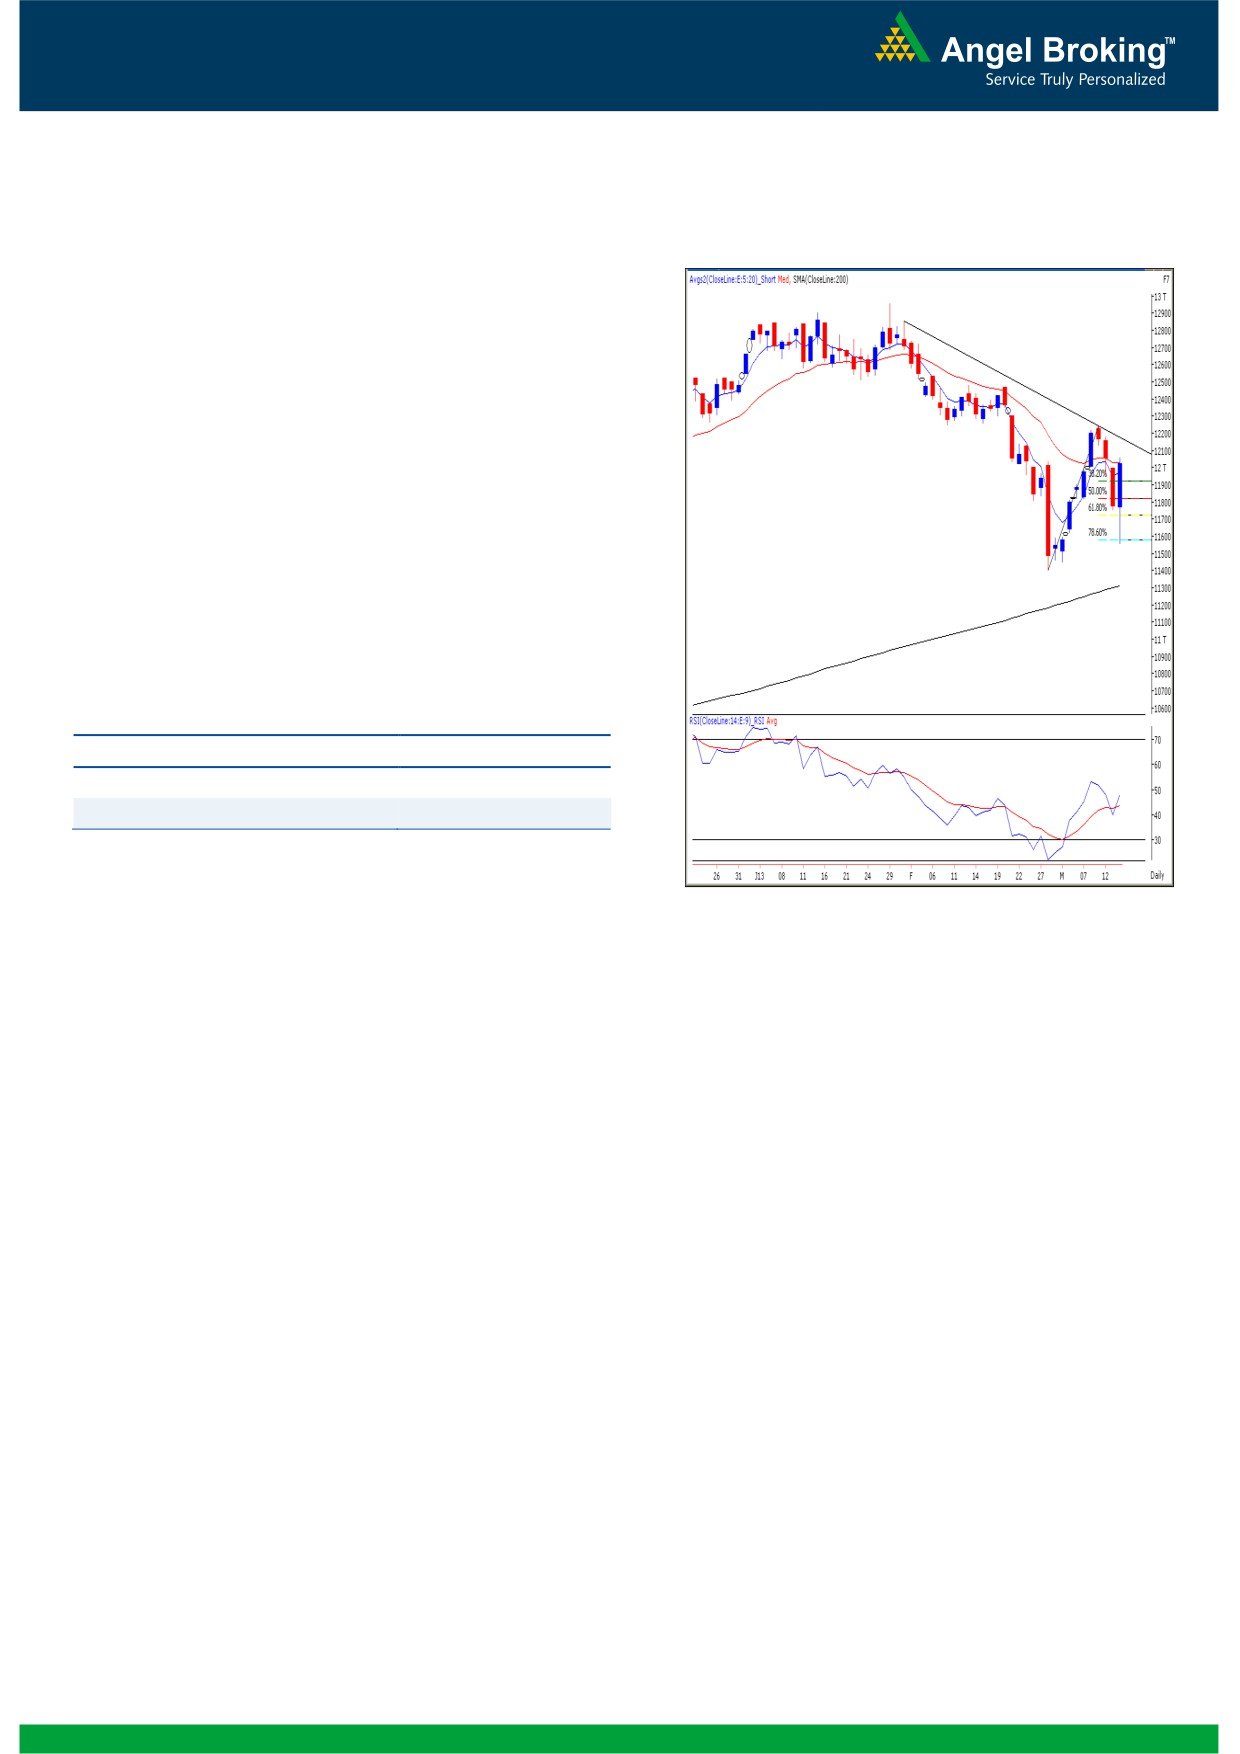
Exhibit 2: Bank Nifty Daily Chart
Bank Nifty Outlook - (12021)
Yesterday, Bank Nifty too opened flat in-line with our
benchmark indices and eventually index slipped below
Wednesday's low to test the 78.6% Fibonacci retracement
level. This level acted as a strong support as the Index
bounced back sharply to eventually close well inside the
positive territory. Going forward, we may witness continuation
of yesterdays up move once index sustains above yesterday's
high of 12059. This may result in a further continuation of
positive momentum and the index may test 12183 / 12241
levels. On the downside, 11828 - 11754 are key support
levels for the index.
Actionable points:
View
Bullish above 12059
Expected Target
12183 - 12241
Support Levels
11828 - 11754
Source: Falcon:
2
Daily Technical Report
March 15, 2013
Daily Pivot Levels for Nifty 50 Stocks
SCRIPS
S2
S1
PIVOT
R1
R2
SENSEX
19,026
19,298
19,451
19,724
19,877
NIFTY
5,745
5,827
5,874
5,955
6,002
BANKNIFTY
11,375
11,698
11,878
12,201
12,381
ACC
1,230
1,245
1,255
1,269
1,279
AMBUJACEM
185
188
190
192
194
ASIANPAINT
4,709
4,803
4,874
4,968
5,039
AXISBANK
1,273
1,313
1,339
1,379
1,405
BAJAJ-AUTO
1,815
1,835
1,863
1,883
1,912
BANKBARODA
698
711
723
736
748
BHARTIARTL
305
310
314
318
322
BHEL
194
196
198
201
203
BPCL
383
390
396
403
408
CAIRN
289
292
296
299
302
CIPLA
378
381
384
388
390
COALINDIA
315
317
319
321
323
DLF
274
279
283
288
291
DRREDDY
1,792
1,804
1,814
1,826
1,836
GAIL
322
327
334
340
347
GRASIM
2,904
2,950
2,990
3,036
3,076
HCLTECH
764
778
787
801
810
HDFC
788
801
811
823
833
HDFCBANK
601
625
639
663
678
HEROMOTOCO
1,639
1,654
1,677
1,691
1,714
HINDALCO
93
94
95
97
98
HINDUNILVR
440
448
454
462
468
ICICIBANK
1,040
1,075
1,096
1,131
1,152
IDFC
149
153
155
159
161
INFY
2,823
2,848
2,869
2,894
2,915
ITC
298
300
302
304
306
JINDALSTEL
340
350
356
366
373
JPASSOCIAT
72
74
76
78
79
KOTAKBANK
627
642
653
669
679
LT
1,457
1,490
1,511
1,543
1,564
LUPIN
591
596
599
604
607
M&M
880
897
910
927
940
MARUTI
1,337
1,378
1,401
1,442
1,466
NTPC
146
146
147
148
148
ONGC
307
313
318
325
329
PNB
762
779
793
811
824
POWERGRID
108
109
109
110
111
RANBAXY
413
423
428
438
444
RELIANCE
825
842
853
871
881
RELINFRA
411
421
426
436
442
SBIN
2,131
2,193
2,227
2,289
2,324
SESAGOA
160
162
164
167
169
SIEMENS
519
529
537
547
555
SUNPHARMA
819
825
834
839
848
TATAMOTORS
289
295
299
305
309
TATAPOWER
96
98
100
102
104
TATASTEEL
342
350
354
361
366
TCS
1,530
1,549
1,563
1,582
1,596
ULTRACEMCO
1,876
1,893
1,905
1,922
1,934
WIPRO
430
434
439
443
448
3
Daily Technical Report
March 15, 2013
Research Team Tel: 022 - 30940000
DISCLAIMER
This document is solely for the personal information of the recipient, and must not be singularly used as the basis of any investment
decision. Nothing in this document should be construed as investment or financial advice. Each recipient of this document should make
such investigations as they deem necessary to arrive at an independent evaluation of an investment in the securities of the companies
referred to in this document (including the merits and risks involved), and should consult their own advisors to determine the merits and
risks of such an investment.
Angel Broking Limited, its affiliates, directors, its proprietary trading and investment businesses may, from time to time, make
investment decisions that are inconsistent with or contradictory to the recommendations expressed herein. The views contained in this
document are those of the analyst, and the company may or may not subscribe to all the views expressed within.
Reports based on technical and derivative analysis center on studying charts of a stock's price movement, outstanding positions and
trading volume, as opposed to focusing on a company's fundamentals and, as such, may not match with a report on a company's
fundamentals.
The information in this document has been printed on the basis of publicly available information, internal data and other reliable
sources believed to be true, but we do not represent that it is accurate or complete and it should not be relied on as such, as this
document is for general guidance only. Angel Broking Limited or any of its affiliates/ group companies shall not be in any way
responsible for any loss or damage that may arise to any person from any inadvertent error in the information contained in this report.
Angel Broking Limited has not independently verified all the information contained within this document. Accordingly, we cannot testify,
nor make any representation or warranty, express or implied, to the accuracy, contents or data contained within this document. While
Angel Broking Limited endeavours to update on a reasonable basis the information discussed in this material, there may be regulatory,
compliance, or other reasons that prevent us from doing so.
This document is being supplied to you solely for your information, and its contents, information or data may not be reproduced,
redistributed or passed on, directly or indirectly.
Angel Broking Limited and its affiliates may seek to provide or have engaged in providing corporate finance, investment banking or
other advisory services in a merger or specific transaction to the companies referred to in this report, as on the date of this report or in
the past.
Neither Angel Broking Limited, nor its directors, employees or affiliates shall be liable for any loss or damage that may arise from or in
connection with the use of this information.
Note: Please refer to the important `Stock Holding Disclosure' report on the Angel website (Research Section). Also, please refer to the
latest update on respective stocks for the disclosure status in respect of those stocks. Angel Broking Limited and its affiliates may have
investment positions in the stocks recommended in this report.
Research Team
Shardul Kulkarni
-
Head - Technicals
Sameet Chavan
-
Technical Analyst
Sacchitanand Uttekar
-
Technical Analyst
Ankur Lakhotia
-
Technical Analyst
Angel Broking Pvt. Ltd.
Registered Office: G-1, Ackruti Trade Centre, Rd. No. 7, MIDC, Andheri (E), Mumbai - 400 093.
Corporate Office: 6th Floor, Ackruti Star, MIDC, Andheri (E), Mumbai - 400 093. Tel: (022) 30940000
Sebi Registration No: INB 010996539
4