Daily Technical Report
December 14, 2012
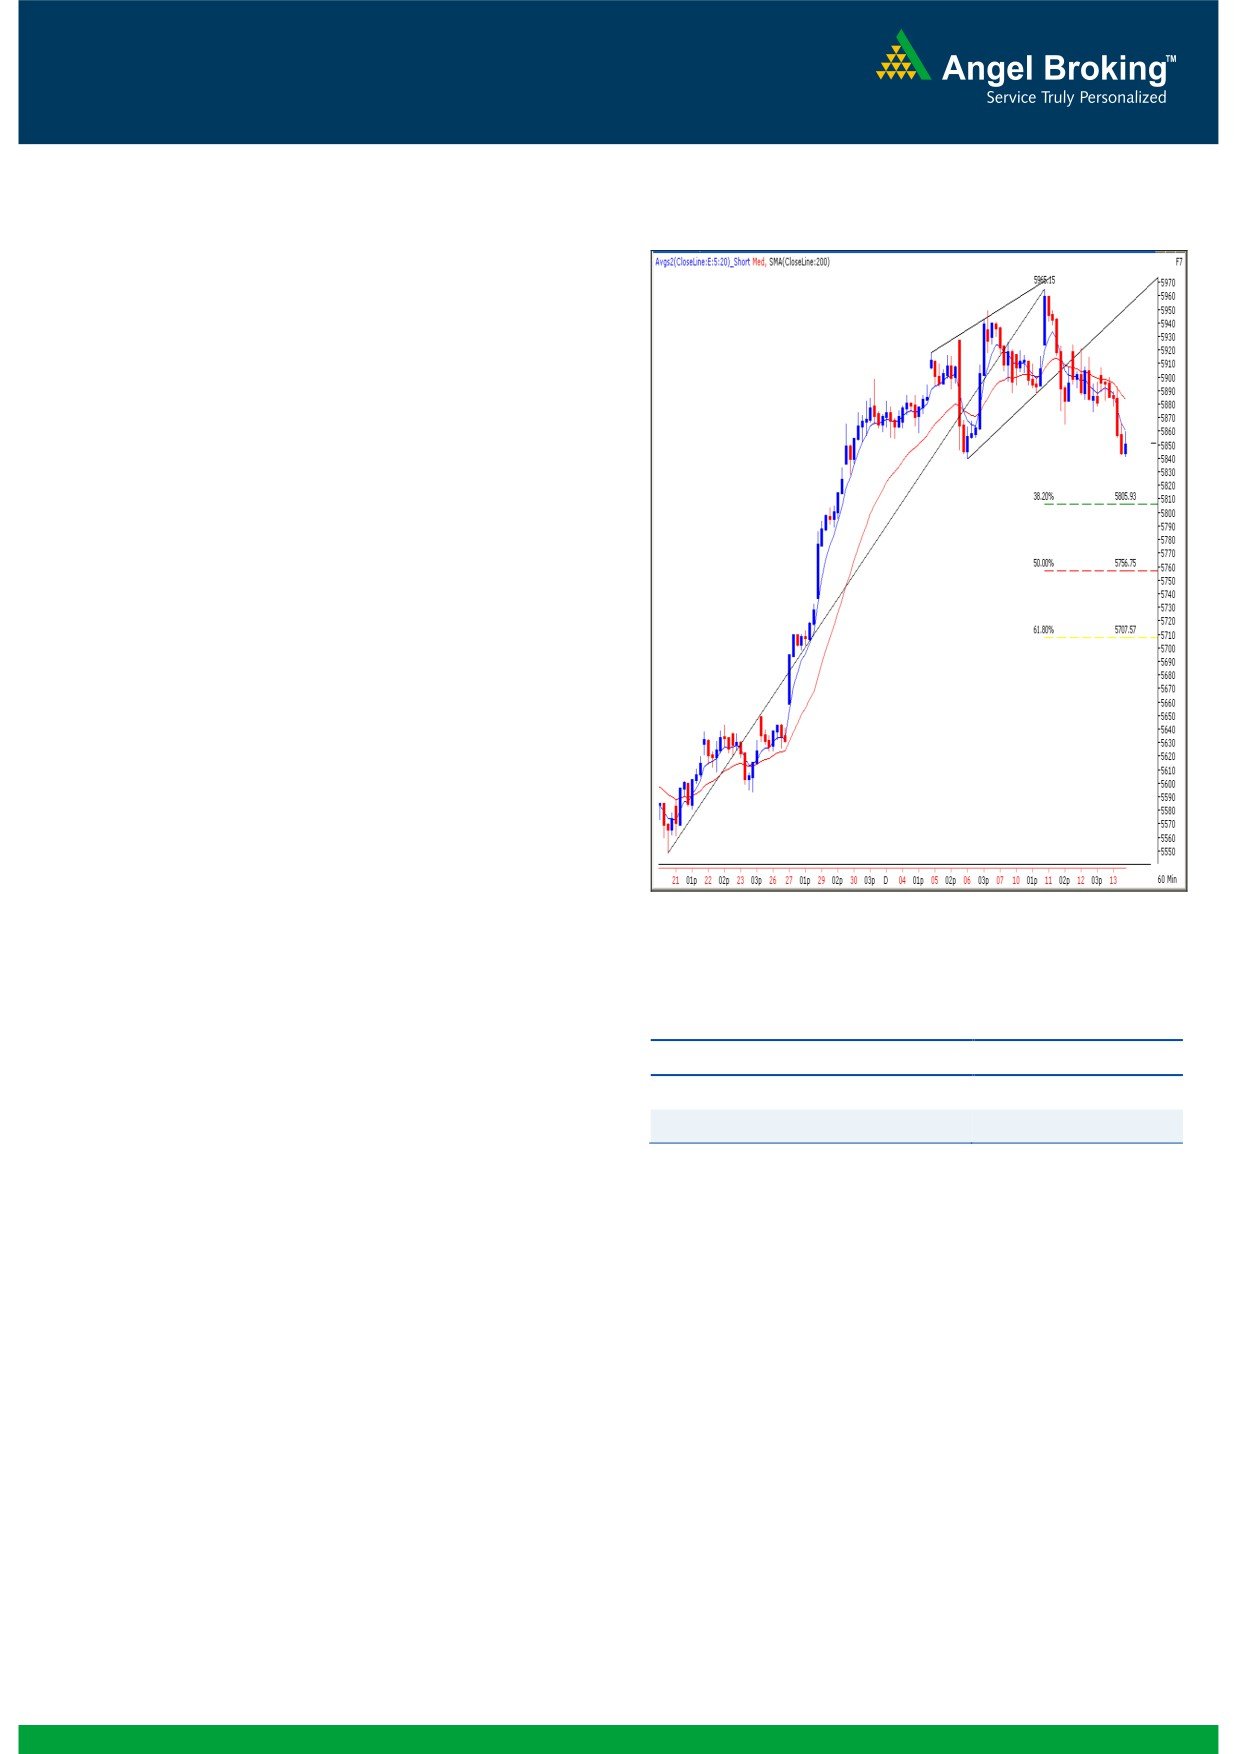
Exhibit 1: Nifty Hourly Chart
Sensex (19929) / NIFTY (5852)
Yesterday, our benchmark indices opened marginally higher
in-line with mixed cues from Asian bourses. However, the
hourly
’20” Exponential Moving average acted as a
resistance and immense selling pressure during the second
half resulted in sharp down move. Defensive sectors like
Consumer Durables and FMCG along with high beta sectors
like Realty contributed heavily in yesterday’s fall; whereas the
Auto and Oil & Gas counters ended marginally in the
positive territory. The advance to decline ratio was strongly in
favor of declining counters (A=1106 D=1834) (Source -
Formation
The ’20-day EMA’ and the ’20-week EMA’ are placed at
18980 / 5770 and 18390 / 5586 levels, respectively.
On the weekly chart, we are witnessing a breakout from
‘Downward Sloping Trend Line’ joining two significant
swing high of 19811 / 5944 (April 2011) and 19137 /
5815 (Oct 2012) at 19050 / 5800 level .
The 78.60% Fibonacci retracement level of the fall from
November 5, 2010 (the high was 21109 / 6339) to
Source: Falcon:
December 23, 2011 (the low was 15135 / 4531) is at
19812 / 5945.
Actionable points:
On the daily chart, we are observing a ‘Hanging Man’
candlestick pattern, occurred on December 6, 2012.
View for the day
Bearish below 5840
Trading strategy:
Expected Targets
5800 - 5780
We had a quiet opening in our market and indices then
Resistance Levels
5925 - 5965
made a feeble attempt to cross the resistance of hourly ’20
EMA’ during the initial couple of hours. Subsequently, selling
pressure near this resistance level led to a breakdown of
hourly trend line near 19300 / 5880. Indices then went on to
break even Tuesday’s low of 19285 / 5865, confirming a
‘Lower Top Lower Bottom’ formation in hourly chart.
Morover, the daily ‘RSI-Smoothened’ oscillator has now
signaled a negative crossover. This is also supported by the
negatively poised ‘3 & 8 day EMA’. Hence, the possibility of
testing the next support zone of 19100 - 19050 / 5820 -
5800 is quite high. On the flipside, 19479 - 19612 / 5925
- 5965 levels remain to be a strong resistance in coming
trading session.
1
Daily Technical Report
December 14, 2012
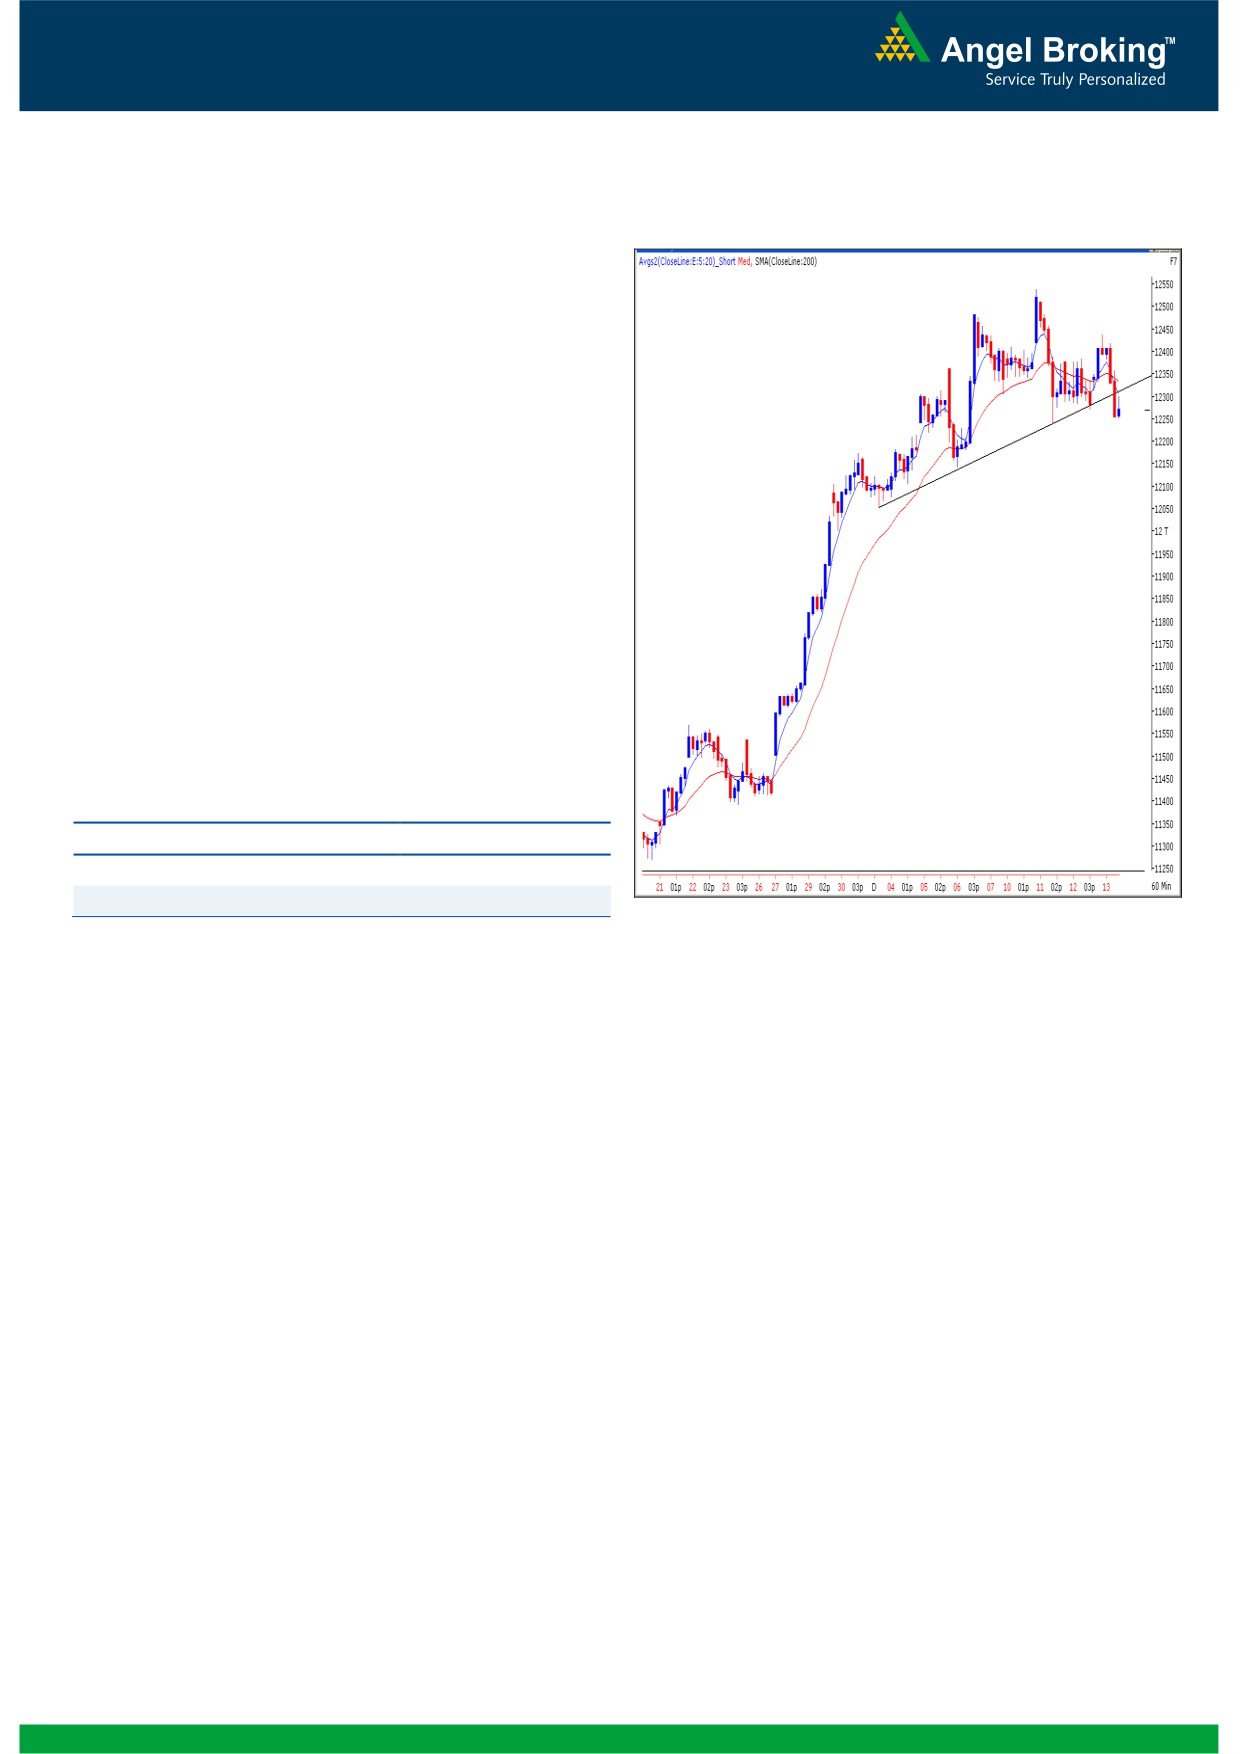
Exhibit 2: Bank Nifty Hourly Chart
Bank Nifty Outlook - (12269)
Yesterday, Bank Nifty opened on a flat note and traded in a
narrow range during first half of the session. However, during
the second half selling pressure led the index to close near
day’s low. The support trend line on the hourly chart
mentioned in our previous reports has been breached. This
has now resulted into a breakdown of a bearish “Head and
Shoulder” pattern in the hourly chart. The pattern has an
eventual downside target of
12000. Also the negative
crossover in “RSI” momentum oscillator on the daily chart is
still intact. Thus, a sustainable move below 12238 level is
likely to intensify selling pressure in the index and The Bank
Nifty may drift towards 12148 - 12048 levels. On the upside
12439 - 12474 levels are likely to act as resistance for the
day.
Actionable points:
View for the day
Bearish Below 12238
Expected targets
12148 - 12048
Resistance Levels
12439 - 12474
Source: Falcon:
2
Daily Technical Report
December 14, 2012
Daily Pivot Levels for Nifty 50 Stocks
SCRIPS
S2
S1
PIVOT
R1
R2
SENSEX
19,058
19,143
19,283
19,368
19,508
NIFTY
5,801
5,826
5,867
5,892
5,933
BANKNIFTY
12,132
12,201
12,320
12,388
12,507
ACC
1,325
1,361
1,403
1,438
1,480
AMBUJACEM
197
202
208
213
219
ASIANPAINT
4,268
4,289
4,316
4,337
4,364
AXISBANK
1,298
1,311
1,329
1,343
1,360
BAJAJ-AUTO
2,020
2,052
2,077
2,109
2,134
BANKBARODA
801
809
821
829
841
BHARTIARTL
306
312
316
322
326
BHEL
222
225
229
232
237
BPCL
346
349
353
356
361
CAIRN
316
318
320
322
324
CIPLA
397
402
410
415
423
COALINDIA
348
351
354
357
360
DLF
209
212
216
219
223
DRREDDY
1,815
1,833
1,866
1,884
1,916
GAIL
339
343
349
353
359
GRASIM
3,095
3,116
3,141
3,162
3,188
HCLTECH
613
617
622
626
631
HDFC
839
846
859
867
879
HDFCBANK
685
688
692
695
699
HEROMOTOCO
1,851
1,865
1,888
1,902
1,925
HINDALCO
113
114
117
118
121
HINDUNILVR
504
512
522
530
540
ICICIBANK
1,105
1,113
1,123
1,131
1,141
IDFC
166
169
174
178
183
INFY
2,249
2,266
2,290
2,307
2,331
ITC
285
290
298
303
311
JINDALSTEL
408
414
418
425
429
JPASSOCIAT
100
101
104
105
108
KOTAKBANK
637
645
654
662
671
LT
1,601
1,614
1,634
1,647
1,668
LUPIN
598
604
611
616
623
M&M
926
934
945
954
965
MARUTI
1,454
1,464
1,480
1,490
1,506
NTPC
148
149
151
153
155
ONGC
256
258
259
262
263
PNB
798
809
827
838
855
POWERGRID
117
118
118
119
119
RANBAXY
493
497
501
505
510
RELIANCE
825
829
835
840
846
RELINFRA
498
507
519
528
541
SBIN
2,211
2,237
2,281
2,307
2,351
SESAGOA
174
178
184
187
193
SIEMENS
678
683
691
695
703
SUNPHARMA
705
712
720
727
736
TATAMOTORS
278
283
287
292
296
TATAPOWER
104
105
106
107
108
TATASTEEL
381
385
391
395
402
TCS
1,207
1,215
1,225
1,232
1,242
ULTRACEMCO
1,902
1,926
1,945
1,969
1,988
WIPRO
369
371
375
378
382
3
Daily Technical Report
December 14, 2012
Research Team Tel: 022 - 39357800
DISCLAIMER
This document is solely for the personal information of the recipient, and must not be singularly used as the basis of any investment
decision. Nothing in this document should be construed as investment or financial advice. Each recipient of this document should make
such investigations as they deem necessary to arrive at an independent evaluation of an investment in the securities of the companies
referred to in this document (including the merits and risks involved), and should consult their own advisors to determine the merits and
risks of such an investment.
Angel Broking Limited, its affiliates, directors, its proprietary trading and investment businesses may, from time to time, make
investment decisions that are inconsistent with or contradictory to the recommendations expressed herein. The views contained in this
document are those of the analyst, and the company may or may not subscribe to all the views expressed within.
Reports based on technical and derivative analysis center on studying charts of a stock's price movement, outstanding positions and
trading volume, as opposed to focusing on a company's fundamentals and, as such, may not match with a report on a company's
fundamentals.
The information in this document has been printed on the basis of publicly available information, internal data and other reliable
sources believed to be true, but we do not represent that it is accurate or complete and it should not be relied on as such, as this
document is for general guidance only. Angel Broking Limited or any of its affiliates/ group companies shall not be in any way
responsible for any loss or damage that may arise to any person from any inadvertent error in the information contained in this report.
Angel Broking Limited has not independently verified all the information contained within this document. Accordingly, we cannot testify,
nor make any representation or warranty, express or implied, to the accuracy, contents or data contained within this document. While
Angel Broking Limited endeavours to update on a reasonable basis the information discussed in this material, there may be regulatory,
compliance, or other reasons that prevent us from doing so.
This document is being supplied to you solely for your information, and its contents, information or data may not be reproduced,
redistributed or passed on, directly or indirectly.
Angel Broking Limited and its affiliates may seek to provide or have engaged in providing corporate finance, investment banking or
other advisory services in a merger or specific transaction to the companies referred to in this report, as on the date of this report or in
the past.
Neither Angel Broking Limited, nor its directors, employees or affiliates shall be liable for any loss or damage that may arise from or in
connection with the use of this information.
Note: Please refer to the important `Stock Holding Disclosure' report on the Angel website (Research Section). Also, please refer to the
latest update on respective stocks for the disclosure status in respect of those stocks. Angel Broking Limited and its affiliates may have
investment positions in the stocks recommended in this report.
Research Team
Shardul Kulkarni
-
Head - Technicals
Sameet Chavan
-
Technical Analyst
Sacchitanand Uttekar
-
Technical Analyst
Mehul Kothari
-
Technical Analyst
Ankur Lakhotia
-
Technical Analyst
Angel Broking Pvt. Ltd.
Registered Office: G-1, Ackruti Trade Centre, Rd. No. 7, MIDC, Andheri (E), Mumbai - 400 093.
Corporate Office: 6th Floor, Ackruti Star, MIDC, Andheri (E), Mumbai - 400 093. Tel: (022) 3952 6600
Sebi Registration No: INB 010996539
4