Daily Technical Report
June 14, 2013
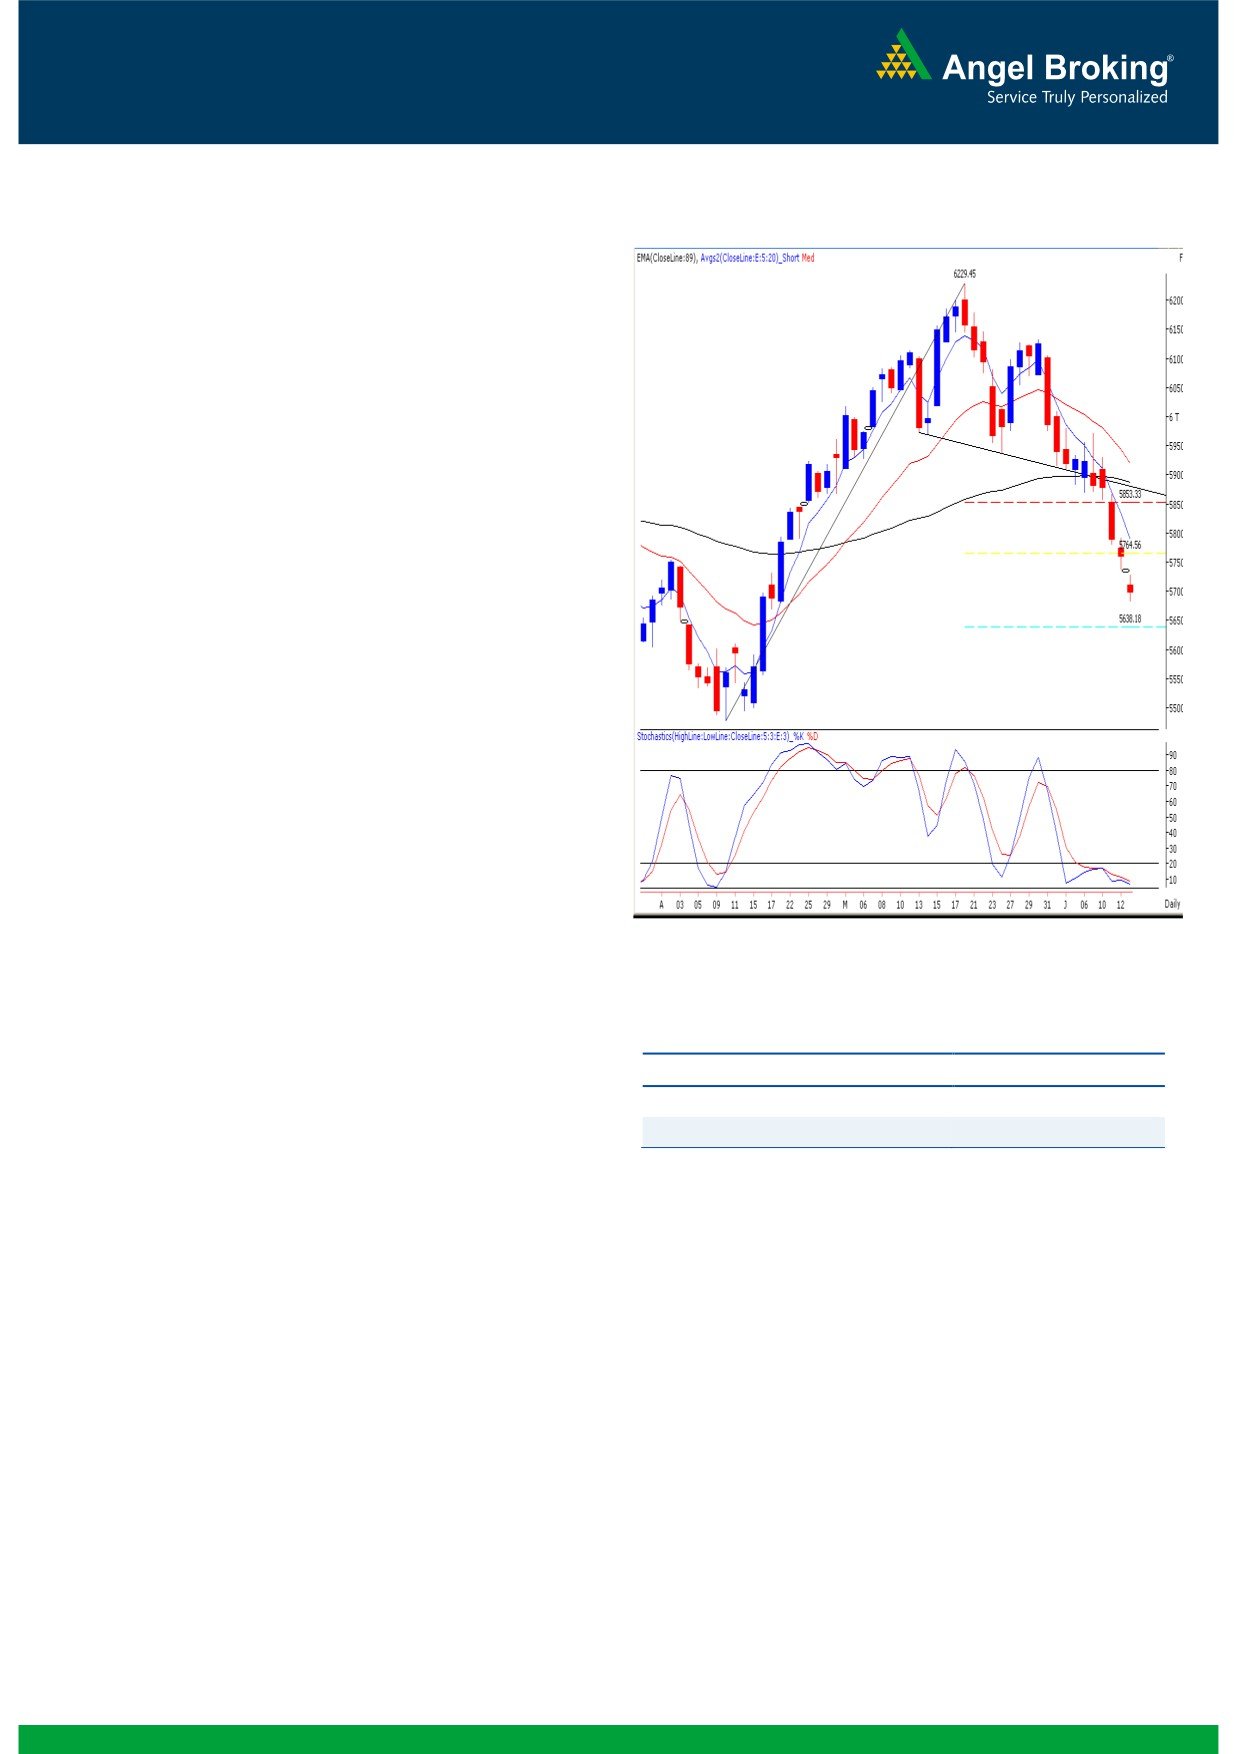
Exhibit 1: Nifty Daily Chart
Sensex (18827) / NIFTY (5699)
Yesterday, our benchmark indices opened significantly lower
on the back of strong pessimism across the globe and
continued to slide further during the initial hour of the
session. However, the fall got arrested as the indices
approached the support level of 18673 / 5669 and then
traded within a narrow trading range to eventually close with
significant losses. During the session, the Consumer
Durables counters corrected heavily along with the Metal and
IT stocks; whereas the Health Care and Oil & Gas sectors
defended the market. The advance to decline ratio was in
favor of declining counters.
(A=967 D=1398)
Formation
The ’20-week EMA’ and the ’20-day EMA’ are placed at
19325/ 5858 and 19534/ 5919 levels, respectively.
The ’89-day EMA’ and the ‘200-day SMA’ are placed at
19422/ 5887 and 19120 / 5797, respectively.
The weekly ‘RSI’ and ‘Stochastic’ momentum oscillators
are still negatively poised.
Source: Falcon:
The weekly ‘Bearish Engulfing’ and the monthly
‘Shooting Star’ Japanese candlestick patterns are still
Actionable points:
intact.
View
Neutral
Resistance Levels
5738
Trading strategy:
Support levels
5683 - 5638
Yesterday, our market opened with a downside gap and
remained under pressure during the first half. In the process,
indices posted a low of 18765 / 5683 and immediately
managed to bounce off the lows. The daily chart now depicts
yet another ‘Narrow Range’ body formation. The gap area
(18969 / 5738 - 18914 / 5729) formed in yesterday’s
session is now a significant resistance zone for the indices.
The momentum oscillators on the daily chart are extremely
oversold and thus although the primary trend remain down,
there is a possibility of an intermediate bounce. Going
forward, a sustainable move beyond the gap area of 18969
/ 5738 would attract some buying interest. In this scenario,
indices may bounce towards 19143 / 5793. On the flipside,
if indices sustain below 18765 / 5683 then selling may
intensify further and indices may slide towards the 78.6%
Fibonacci retracement level of 18636 / 5638.
1
Daily Technical Report
June 14, 2013
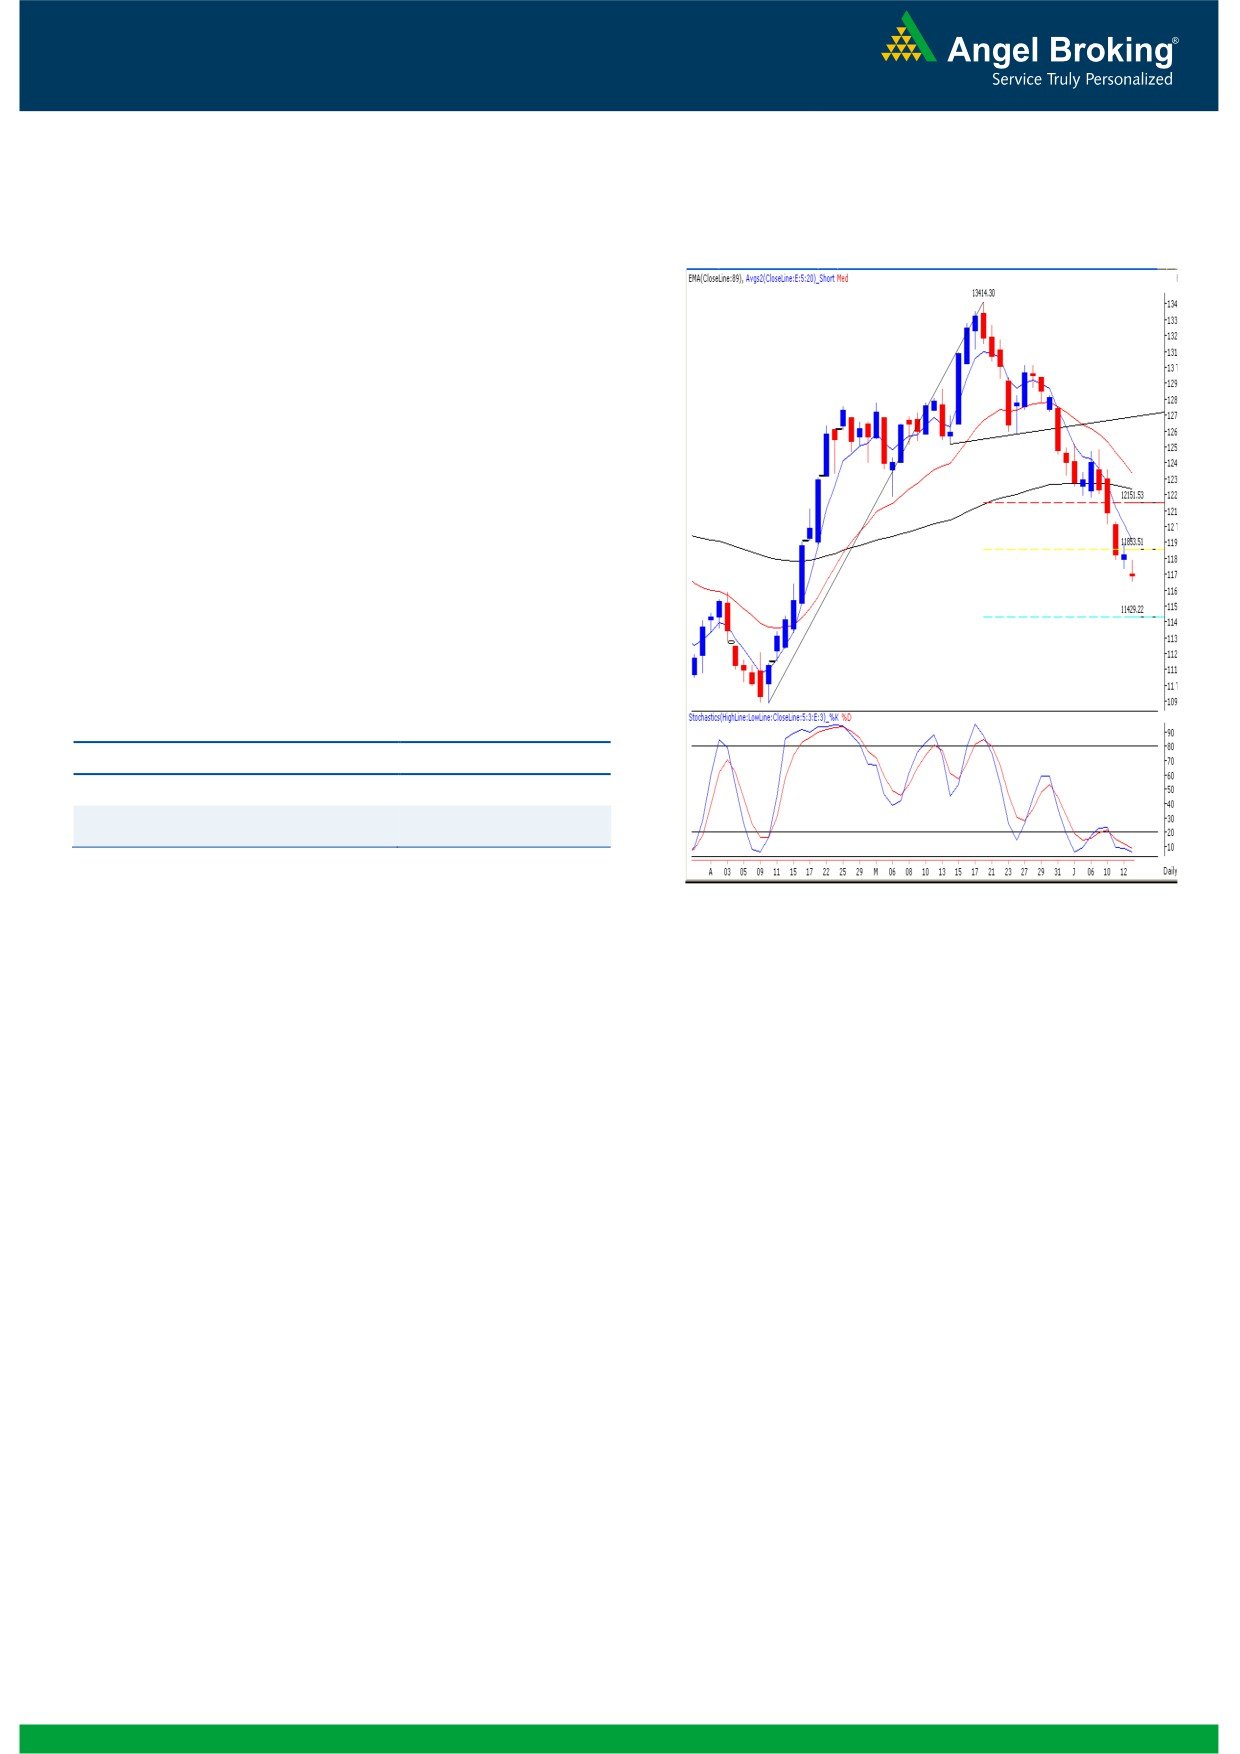
Exhibit 2: Bank Nifty Daily Chart
Bank Nifty Outlook - (11687)
Yesterday, the Bank Nifty too opened substantially lower
in-line with our benchmark indices. However the index
constituents such as SBI and Axis Bank attracted significant
buying interest through the session. The daily chart of Bank
Nifty depicts a ‘Narrow Range’ body formation. Hence,
yesterday’s high of 11793 would be the major hurdle for
the bulls in coming trading session. Going forward, if Bank
Nifty stays above 11793 then we may witness an intraday
rally towards 11899 - 12031 levels. On the flipside, a
breach of yesterday’s low of 11656 would trigger further
pessimism in the index. In this case, Bank Nifty may correct
towards the next support level of 11429.
Actionable points:
View
Bullish Above 11793
Expected Targets
11899 - 12031
Support Levels
11656 - 11429
Source: Falcon:
2
Daily Technical Report
June 14, 2013
Daily Pivot Levels for Nifty 50 Stocks
SCRIPS
S2
S1
PIVOT
R1
R2
SENSEX
18,687
18,757
18,836
18,906
18,984
NIFTY
5,657
5,678
5,704
5,725
5,751
BANKNIFTY
11,576
11,631
11,712
11,768
11,849
ACC
1,180
1,192
1,207
1,219
1,234
AMBUJACEM
168
171
174
178
180
ASIANPAINT
4,369
4,406
4,464
4,502
4,560
AXISBANK
1,239
1,255
1,273
1,289
1,308
BAJAJ-AUTO
1,673
1,691
1,713
1,730
1,753
BANKBARODA
612
619
627
634
642
BHARTIARTL
270
279
284
293
298
BHEL
172
173
176
178
180
BPCL
349
353
358
362
366
CAIRN
282
286
288
293
295
CIPLA
371
375
379
383
387
COALINDIA
292
295
299
303
306
DLF
181
184
187
190
194
DRREDDY
2,118
2,138
2,169
2,189
2,220
GAIL
286
291
298
304
310
GRASIM
2,709
2,728
2,749
2,768
2,789
HCLTECH
745
751
759
765
773
HDFC
799
805
811
818
823
HDFCBANK
649
652
656
660
664
HEROMOTOCO
1,544
1,579
1,609
1,644
1,674
HINDALCO
88
93
95
99
102
HINDUNILVR
591
593
594
596
597
ICICIBANK
1,055
1,062
1,073
1,080
1,090
IDFC
135
137
140
141
144
INDUSINDBK
475
482
488
495
501
INFY
2,343
2,362
2,393
2,412
2,443
ITC
320
324
327
330
334
JINDALSTEL
222
230
235
242
247
JPASSOCIAT
59
60
61
62
63
KOTAKBANK
733
738
743
748
753
LT
1,371
1,383
1,394
1,406
1,417
LUPIN
741
751
766
776
791
M&M
892
908
929
946
967
MARUTI
1,418
1,437
1,449
1,469
1,481
NMDC
100
104
108
111
116
NTPC
147
148
149
151
152
ONGC
302
306
309
312
315
PNB
708
715
725
732
741
POWERGRID
103
105
107
108
110
RANBAXY
361
368
377
384
393
RELIANCE
775
783
788
795
800
RELINFRA
331
337
343
349
355
SBIN
1,963
1,991
2,013
2,041
2,064
SESAGOA
136
138
141
143
146
SUNPHARMA
895
922
943
970
991
TATAMOTORS
274
279
284
289
295
TATAPOWER
75
77
79
80
82
TATASTEEL
255
261
270
276
285
TCS
1,419
1,433
1,448
1,461
1,477
ULTRACEMCO
1,790
1,806
1,821
1,837
1,852
3
Daily Technical Report
June 14, 2013
Research Team Tel: 022 - 30940000
DISCLAIMER
This document is solely for the personal information of the recipient, and must not be singularly used as the basis of any investment
decision. Nothing in this document should be construed as investment or financial advice. Each recipient of this document should make
such investigations as they deem necessary to arrive at an independent evaluation of an investment in the securities of the companies
referred to in this document (including the merits and risks involved), and should consult their own advisors to determine the merits and
risks of such an investment.
Angel Broking Limited, its affiliates, directors, its proprietary trading and investment businesses may, from time to time, make
investment decisions that are inconsistent with or contradictory to the recommendations expressed herein. The views contained in this
document are those of the analyst, and the company may or may not subscribe to all the views expressed within.
Reports based on technical and derivative analysis center on studying charts of a stock's price movement, outstanding positions and
trading volume, as opposed to focusing on a company's fundamentals and, as such, may not match with a report on a company's
fundamentals.
The information in this document has been printed on the basis of publicly available information, internal data and other reliable
sources believed to be true, but we do not represent that it is accurate or complete and it should not be relied on as such, as this
document is for general guidance only. Angel Broking Limited or any of its affiliates/ group companies shall not be in any way
responsible for any loss or damage that may arise to any person from any inadvertent error in the information contained in this report.
Angel Broking Limited has not independently verified all the information contained within this document. Accordingly, we cannot testify,
nor make any representation or warranty, express or implied, to the accuracy, contents or data contained within this document. While
Angel Broking Limited endeavors to update on a reasonable basis the information discussed in this material, there may be regulatory,
compliance, or other reasons that prevent us from doing so.
This document is being supplied to you solely for your information, and its contents, information or data may not be reproduced,
redistributed or passed on, directly or indirectly.
Angel Broking Limited and its affiliates may seek to provide or have engaged in providing corporate finance, investment banking or
other advisory services in a merger or specific transaction to the companies referred to in this report, as on the date of this report or in
the past.
Neither Angel Broking Limited, nor its directors, employees or affiliates shall be liable for any loss or damage that may arise from or in
connection with the use of this information.
Note: Please refer to the important `Stock Holding Disclosure' report on the Angel website (Research Section). Also, please refer to the
latest update on respective stocks for the disclosure status in respect of those stocks. Angel Broking Limited and its affiliates may have
investment positions in the stocks recommended in this report.
Research Team
Shardul Kulkarni
-
Head - Technicals
Sameet Chavan
-
Technical Analyst
Sacchitanand Uttekar
-
Technical Analyst
Angel Broking Pvt. Ltd.
Registered Office: G-1, Ackruti Trade Centre, Rd. No. 7, MIDC, Andheri (E), Mumbai - 400 093.
Corporate Office: 6th Floor, Ackruti Star, MIDC, Andheri (E), Mumbai - 400 093. Tel: (022) 30940000
Sebi Registration No: INB 010996539
4