Daily Technical Report
May 14, 2013
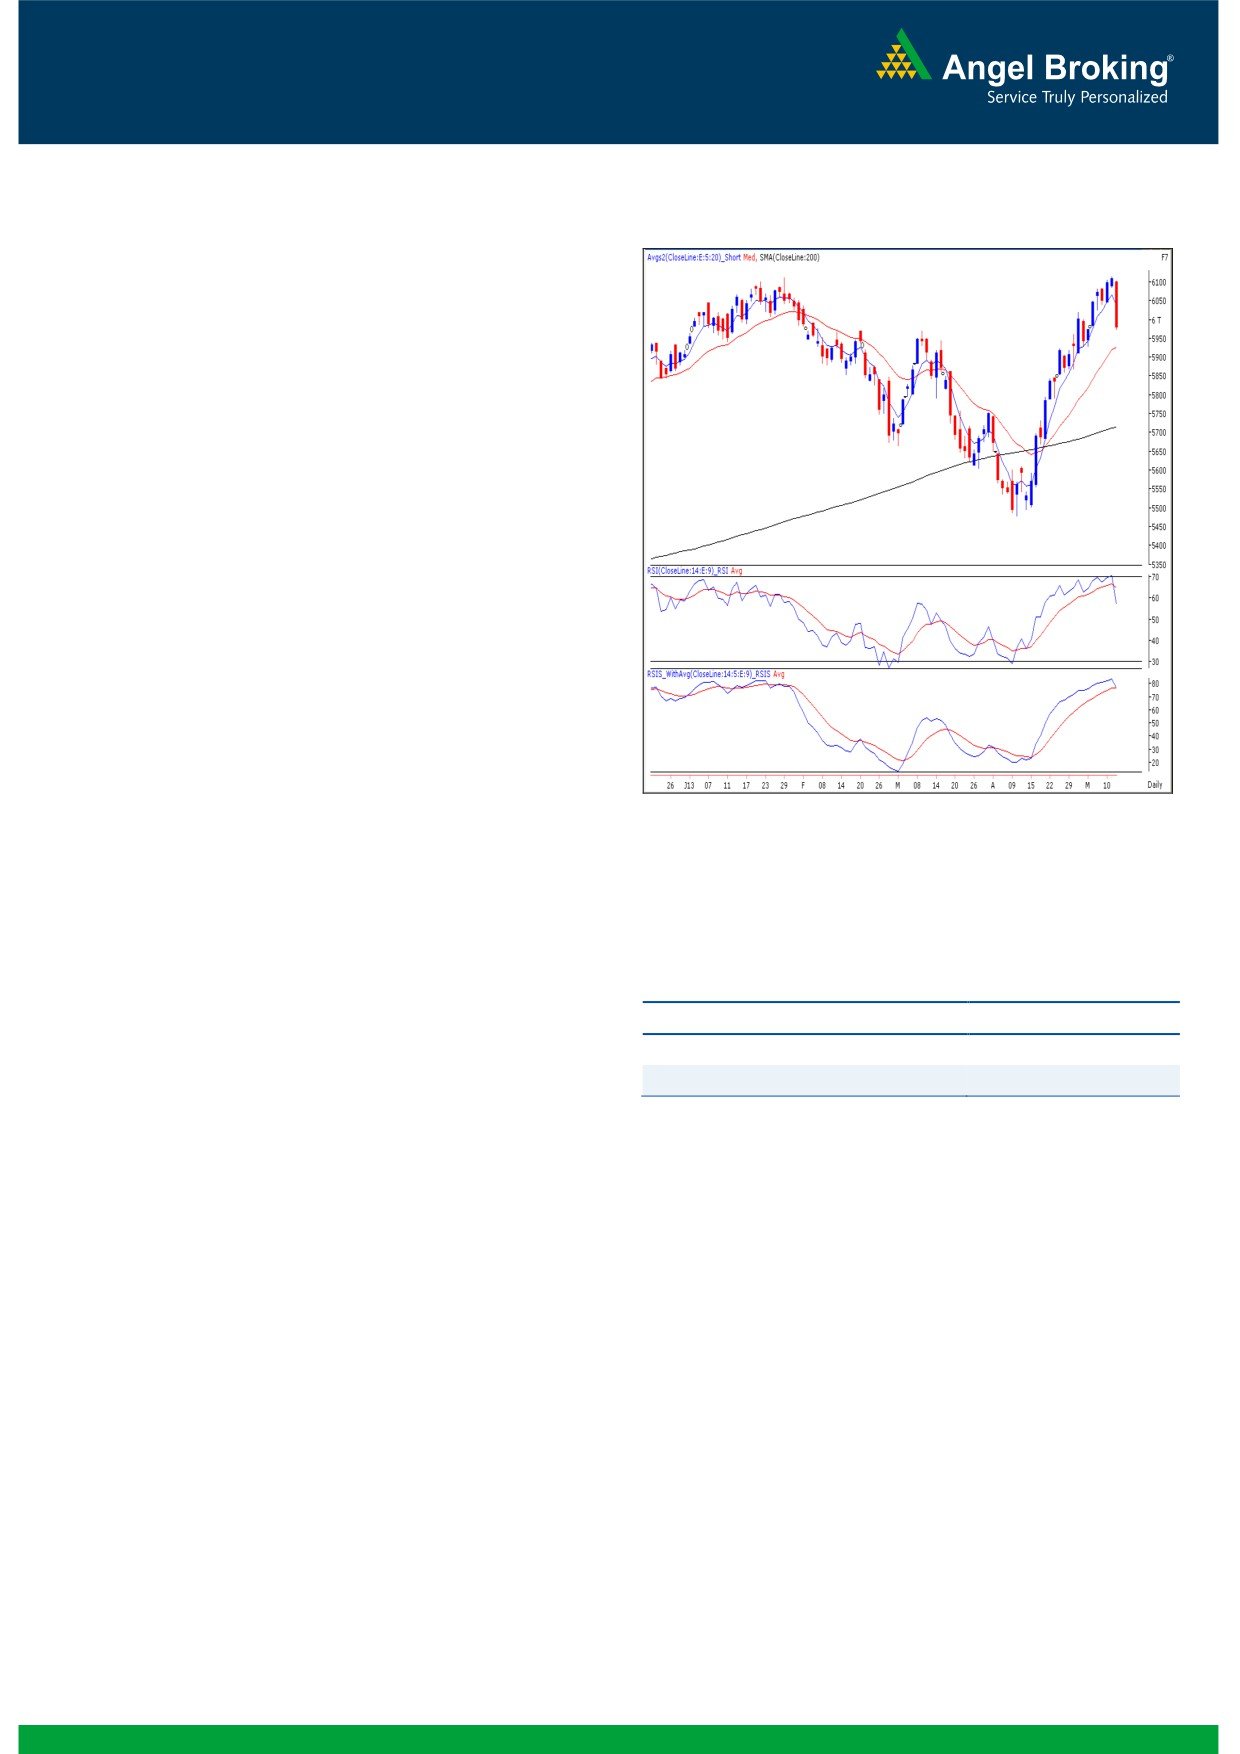
Exhibit 1: Nifty Daily Chart
Sensex (19692) / NIFTY (5980)
The opening session of the week started on a flat note but
immediately witnessed selling pressure in FMCG
heavyweight ITC. The trade deficit data proved to be
extremely disappointing and the marked cracked further to
close at the lowest point of the session. For the day all the
sectors ended in the red among which FMCG, Capital
Goods and Metal counters were among the major losers.
The advance to decline ratio was strongly in favor of
declining
counters.
(A=808 D=1542) (Source-
Formation
The ’20-week EMA’ and the ’20-day EMA’ are placed at
19236/ 5830 and 19522/ 5925 levels, respectively.
The ’89-day EMA’ and the ‘200-day SMA’ are placed at
19212/ 5822 and 18846 / 5714, respectively.
Source: Falcon:
The daily “RSI” and “RSI Smoothened” momentum
oscillators have given a negative crossover.
Actionable points:
Trading strategy:
In line with our expectations, the market fell below the crucial
View
Sell below 5972
support level of 19903 / 6040 and corrected lower to test
Expected targets
5928 - 5900
the mentioned level of 19743 / 5993. The market has
Resistance Levels
6030 - 6060
witnessed broad based selling and the leading sectors such
as Banking and FMCG fell significantly in yesterday’s
session. Also, the ‘RSI’ and ‘RSI smoothened’ momentum
oscillators have given a negative crossover in the overbought
zone. Going forward, if the market sustains below
yesterday’s low of 19667 / 5972, then the possibility of
testing the 19542 - 19450 / 5928 - 5900 levels cannot be
ruled out. On the upside 19851 - 19964 / 6030 - 6060
levels may act as resistance for the day.
1
Daily Technical Report
May 14, 2013
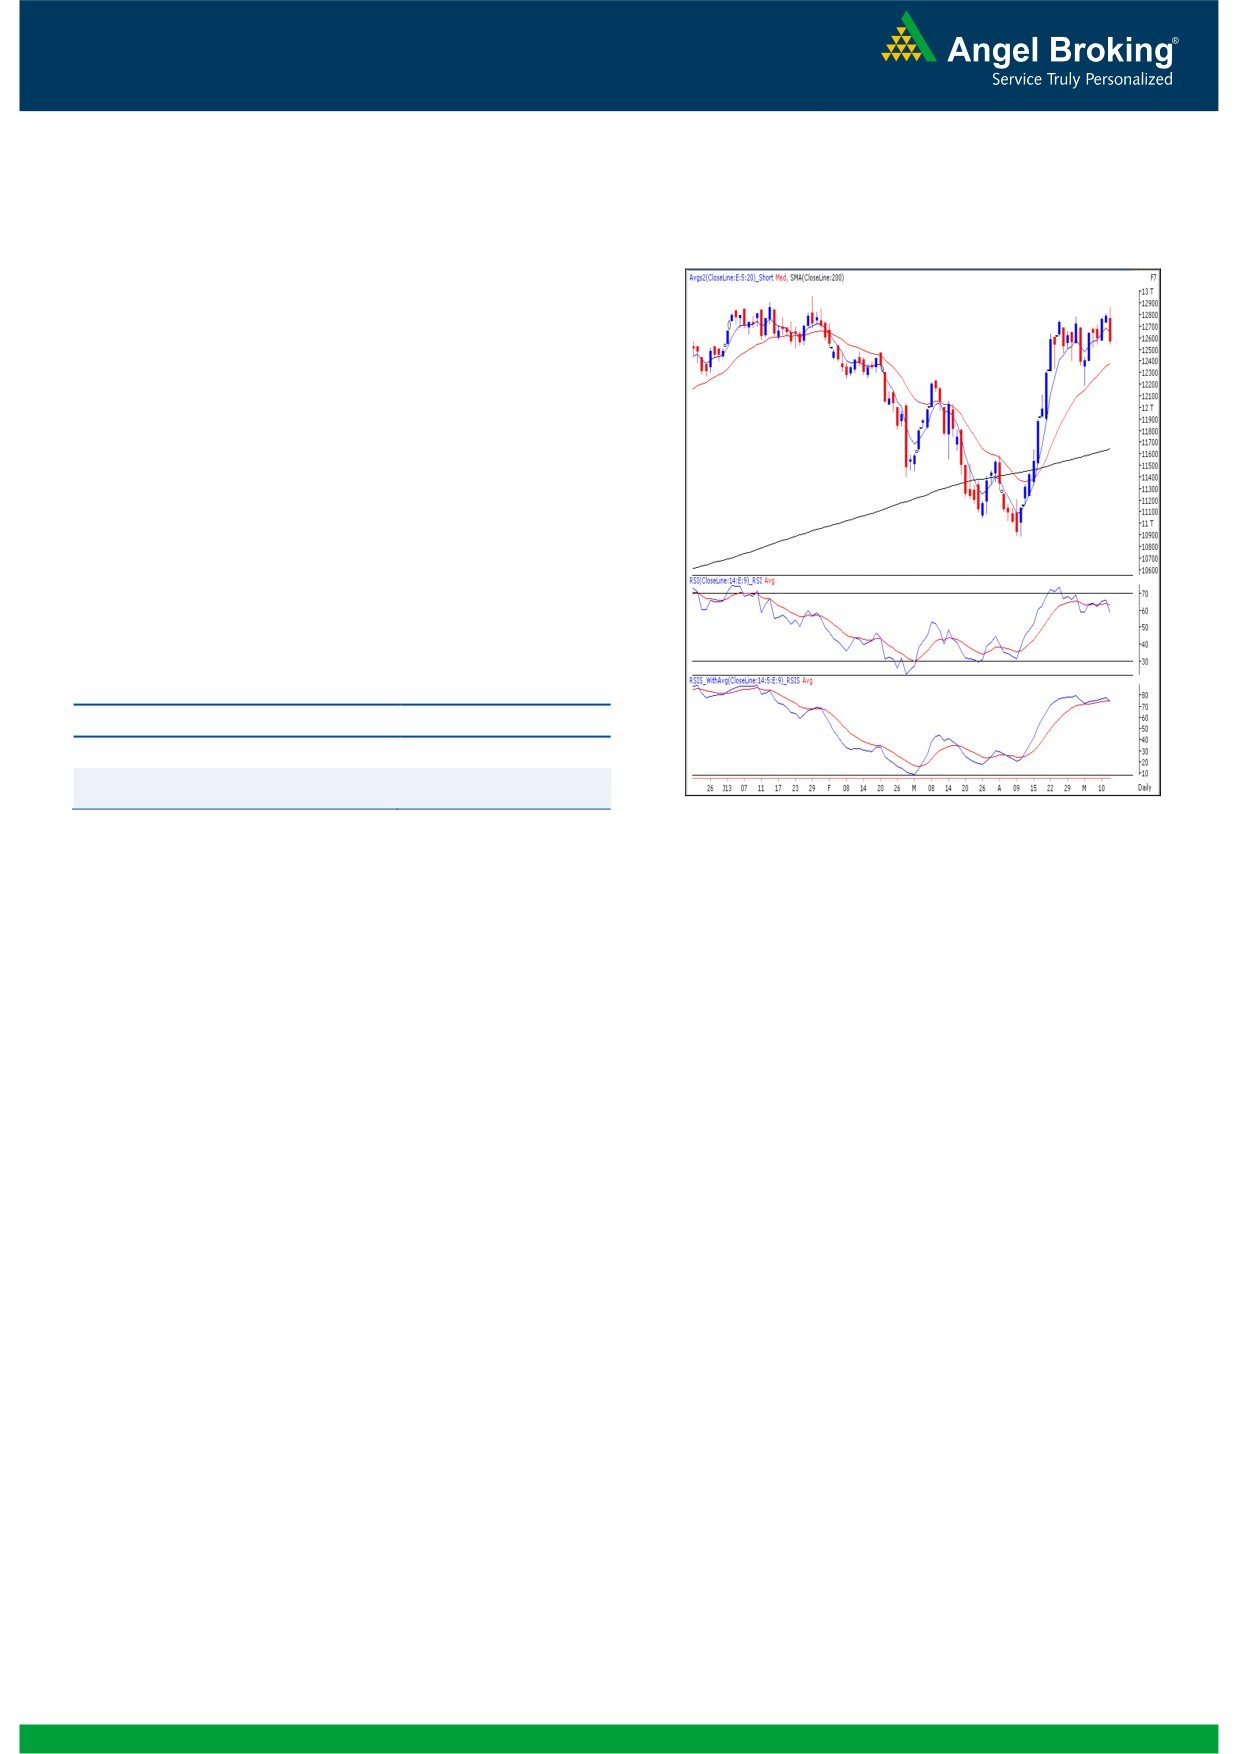
Exhibit 2: Bank Nifty Daily Chart
Bank Nifty Outlook - (12569)
Yesterday, Bank Nifty too opened on a flat note in line with
our benchmark indices but selling pressure throughout the
day led the index to close with a loss of 1.65%. Similar to
the charts of the benchmark indices the momentum
oscillators in the Bank Nifty daily chart have given a
negative crossover The effect of this technical tool would
be seen only if the index sustains below the 12514 level. In
this scenario the index is likely to drift lower towards
12447 - 12378 levels. On the upside 12670 - 12720
levels are likely to act as resistance for the day.
Actionable points:
View
Bearish Below 12514
Expected Targets
12447 - 12348
Resistance Levels
12670 - 12720
Source: Falcon:
2
Daily Technical Report
May 14, 2013
Research Team Tel: 022 - 30940000
DISCLAIMER
This document is solely for the personal information of the recipient, and must not be singularly used as the basis of any investment
decision. Nothing in this document should be construed as investment or financial advice. Each recipient of this document should make
such investigations as they deem necessary to arrive at an independent evaluation of an investment in the securities of the companies
referred to in this document (including the merits and risks involved), and should consult their own advisors to determine the merits and
risks of such an investment.
Angel Broking Limited, its affiliates, directors, its proprietary trading and investment businesses may, from time to time, make
investment decisions that are inconsistent with or contradictory to the recommendations expressed herein. The views contained in this
document are those of the analyst, and the company may or may not subscribe to all the views expressed within.
Reports based on technical and derivative analysis center on studying charts of a stock's price movement, outstanding positions and
trading volume, as opposed to focusing on a company's fundamentals and, as such, may not match with a report on a company's
fundamentals.
The information in this document has been printed on the basis of publicly available information, internal data and other reliable
sources believed to be true, but we do not represent that it is accurate or complete and it should not be relied on as such, as this
document is for general guidance only. Angel Broking Limited or any of its affiliates/ group companies shall not be in any way
responsible for any loss or damage that may arise to any person from any inadvertent error in the information contained in this report.
Angel Broking Limited has not independently verified all the information contained within this document. Accordingly, we cannot testify,
nor make any representation or warranty, express or implied, to the accuracy, contents or data contained within this document. While
Angel Broking Limited endeavors to update on a reasonable basis the information discussed in this material, there may be regulatory,
compliance, or other reasons that prevent us from doing so.
This document is being supplied to you solely for your information, and its contents, information or data may not be reproduced,
redistributed or passed on, directly or indirectly.
Angel Broking Limited and its affiliates may seek to provide or have engaged in providing corporate finance, investment banking or
other advisory services in a merger or specific transaction to the companies referred to in this report, as on the date of this report or in
the past.
Neither Angel Broking Limited, nor its directors, employees or affiliates shall be liable for any loss or damage that may arise from or in
connection with the use of this information.
Note: Please refer to the important `Stock Holding Disclosure' report on the Angel website (Research Section). Also, please refer to the
latest update on respective stocks for the disclosure status in respect of those stocks. Angel Broking Limited and its affiliates may have
investment positions in the stocks recommended in this report.
Research Team
Shardul Kulkarni
-
Head - Technicals
Sameet Chavan
-
Technical Analyst
Sacchitanand Uttekar
-
Technical Analyst
Ankur Lakhotia
-
Technical Analyst
Angel Broking Pvt. Ltd.
Registered Office: G-1, Ackruti Trade Centre, Rd. No. 7, MIDC, Andheri (E), Mumbai - 400 093.
Corporate Office: 6th Floor, Ackruti Star, MIDC, Andheri (E), Mumbai - 400 093. Tel: (022) 30940000
Sebi Registration No: INB 010996539
4