Daily Technical Report
March 14, 2013
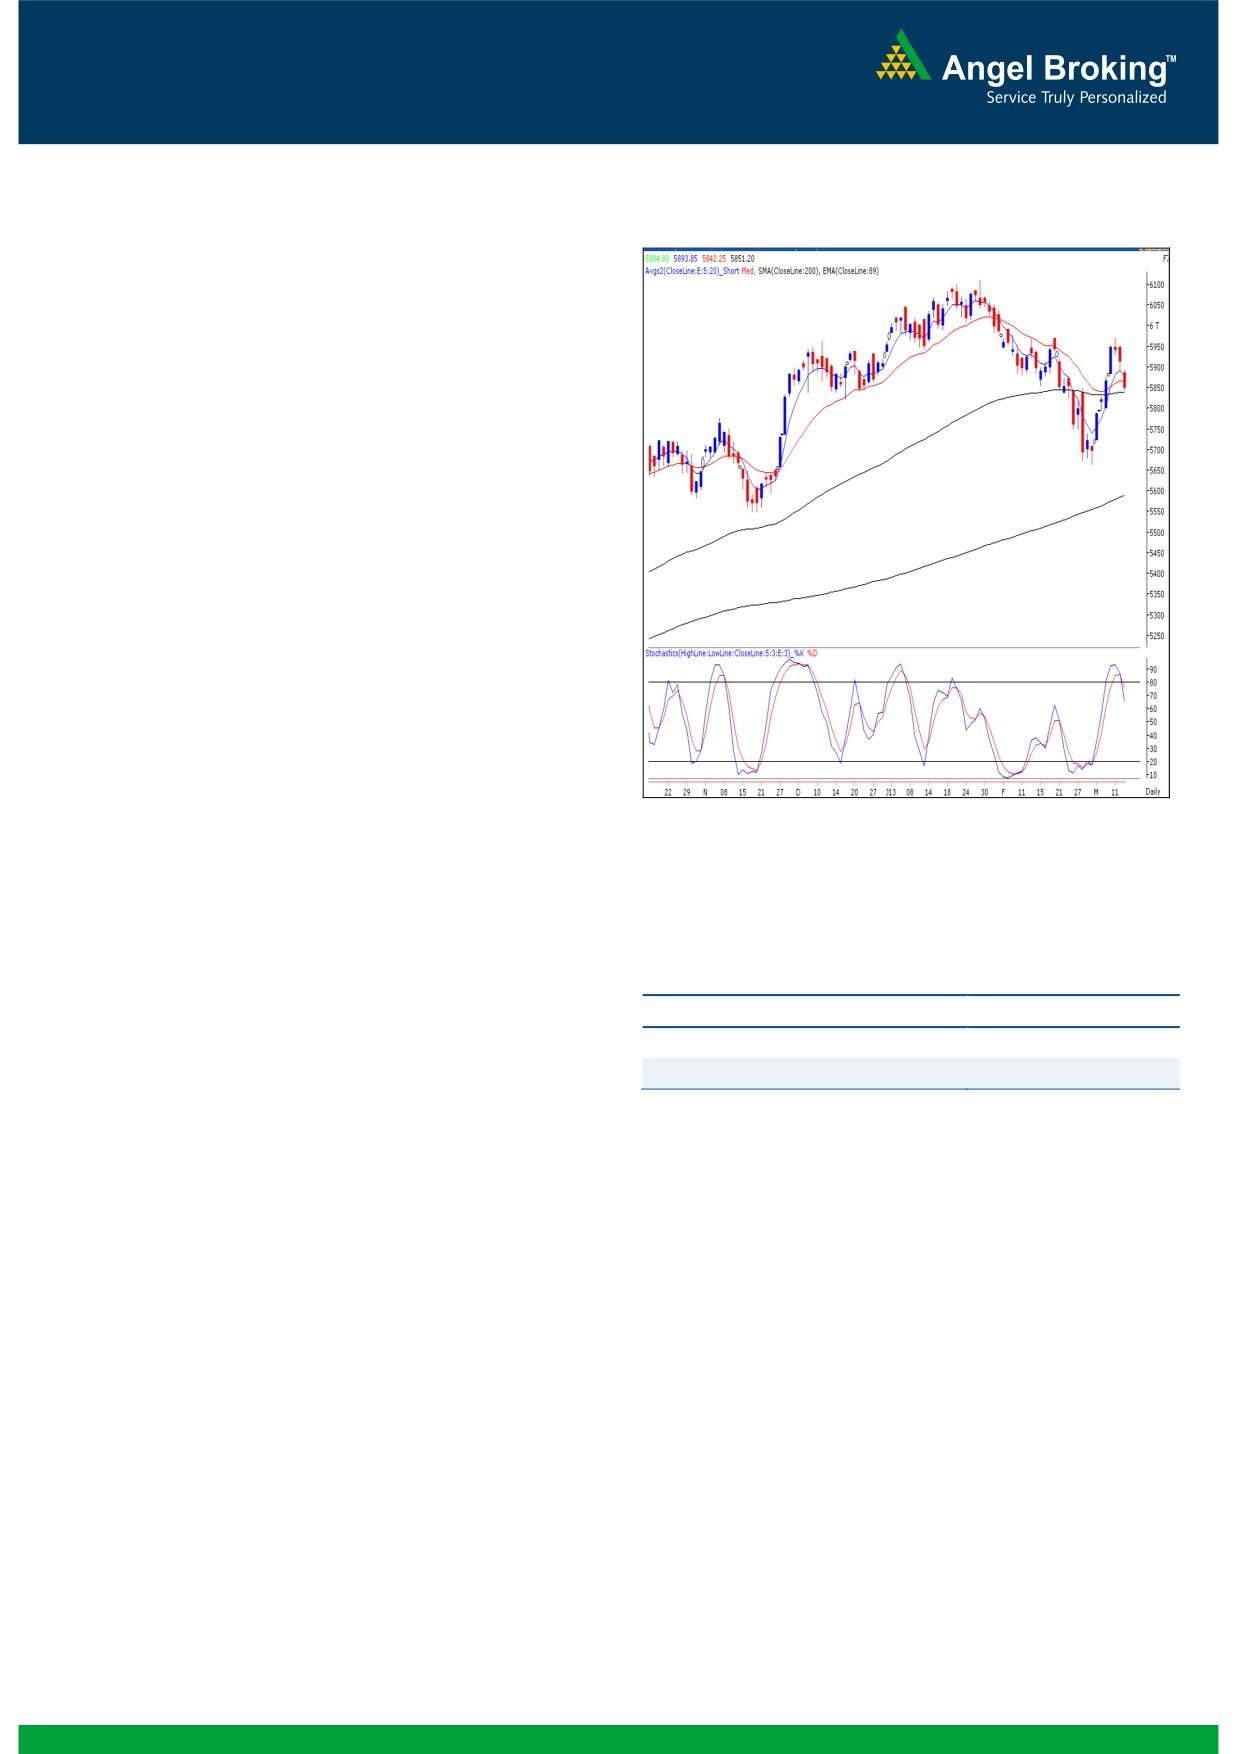
Exhibit 1: Nifty Daily Chart
Sensex (19363) / NIFTY (5851)
Yesterday, indices opened with half a percent downside gap
considering weak global cues and struggled to move higher
on the back of extreme selling pressure in the banking
counters. The lower top lower bottom cycle in the hourly
charts eventually led the indices to close near the days low.
During the day, the Banking, Consumer Durables and Auto
were among the major draggers; whereas only FMCG sector
managed to close in the positive territory. The advance to
decline ratio was strongly in favor of declining counters
Formation
The ’20-day EMA’ and the ’20-week EMA’ are placed at
19430 / 5880 and 19224 / 5826 levels, respectively.
The weekly chart exhibits a ‘Bullish Engulfing’ pattern but
the monthly chart exhibits a ‘Bearish Engulfing’ pattern.
The daily ‘ADX
(14)’ indicator and the weekly
Source: Falcon:
‘Stochastic’ momentum oscillator is now signaling a
positive crossover.
The level of the weekly ‘RSI’ momentum oscillator has
now bounced back sharply to 58.20 after dropping
Actionable points:
below the 50 mark.
View
Bearish below 5837
Indices have closed above the ‘Downward Sloping Trend
Line’, drawn by joining two significant highs of 21109 /
Expected target
5790 - 5750
6339 (high of November 05, 2010 weekly candle) and
Resistance levels
5894
19137 / 5816 (high of October 05, 2012 weekly
candle).
Trading strategy:
For the third consecutive session, indices have struggled to
move upwards and eventually closed almost at the lowest
point of the day. Yesterday's corrective move has pulled
indices near crucial support zone of 19391 - 19322 / 5850 -
5837, which coincides with '20-day EMA' as well as '89-day
EMA'. Hence, the next few trading sessions are very crucial
for our markets. The 'Stochastic' momentum oscillator on
daily chart is now signaling a negative crossover in the
overbought zone. The impact of this tool would be seen if
indices sustain below the previous swing of 19322 / 5837. In
this scenario, indices may further correct to test 19195 -
19000 / 5790 - 5750 levels. On the flipside, a move
beyond yesterday's high of 19512 / 5894 would nullify the
current negative momentum and indices then may resume
their last week's upward trend.
1
Daily Technical Report
March 14, 2013
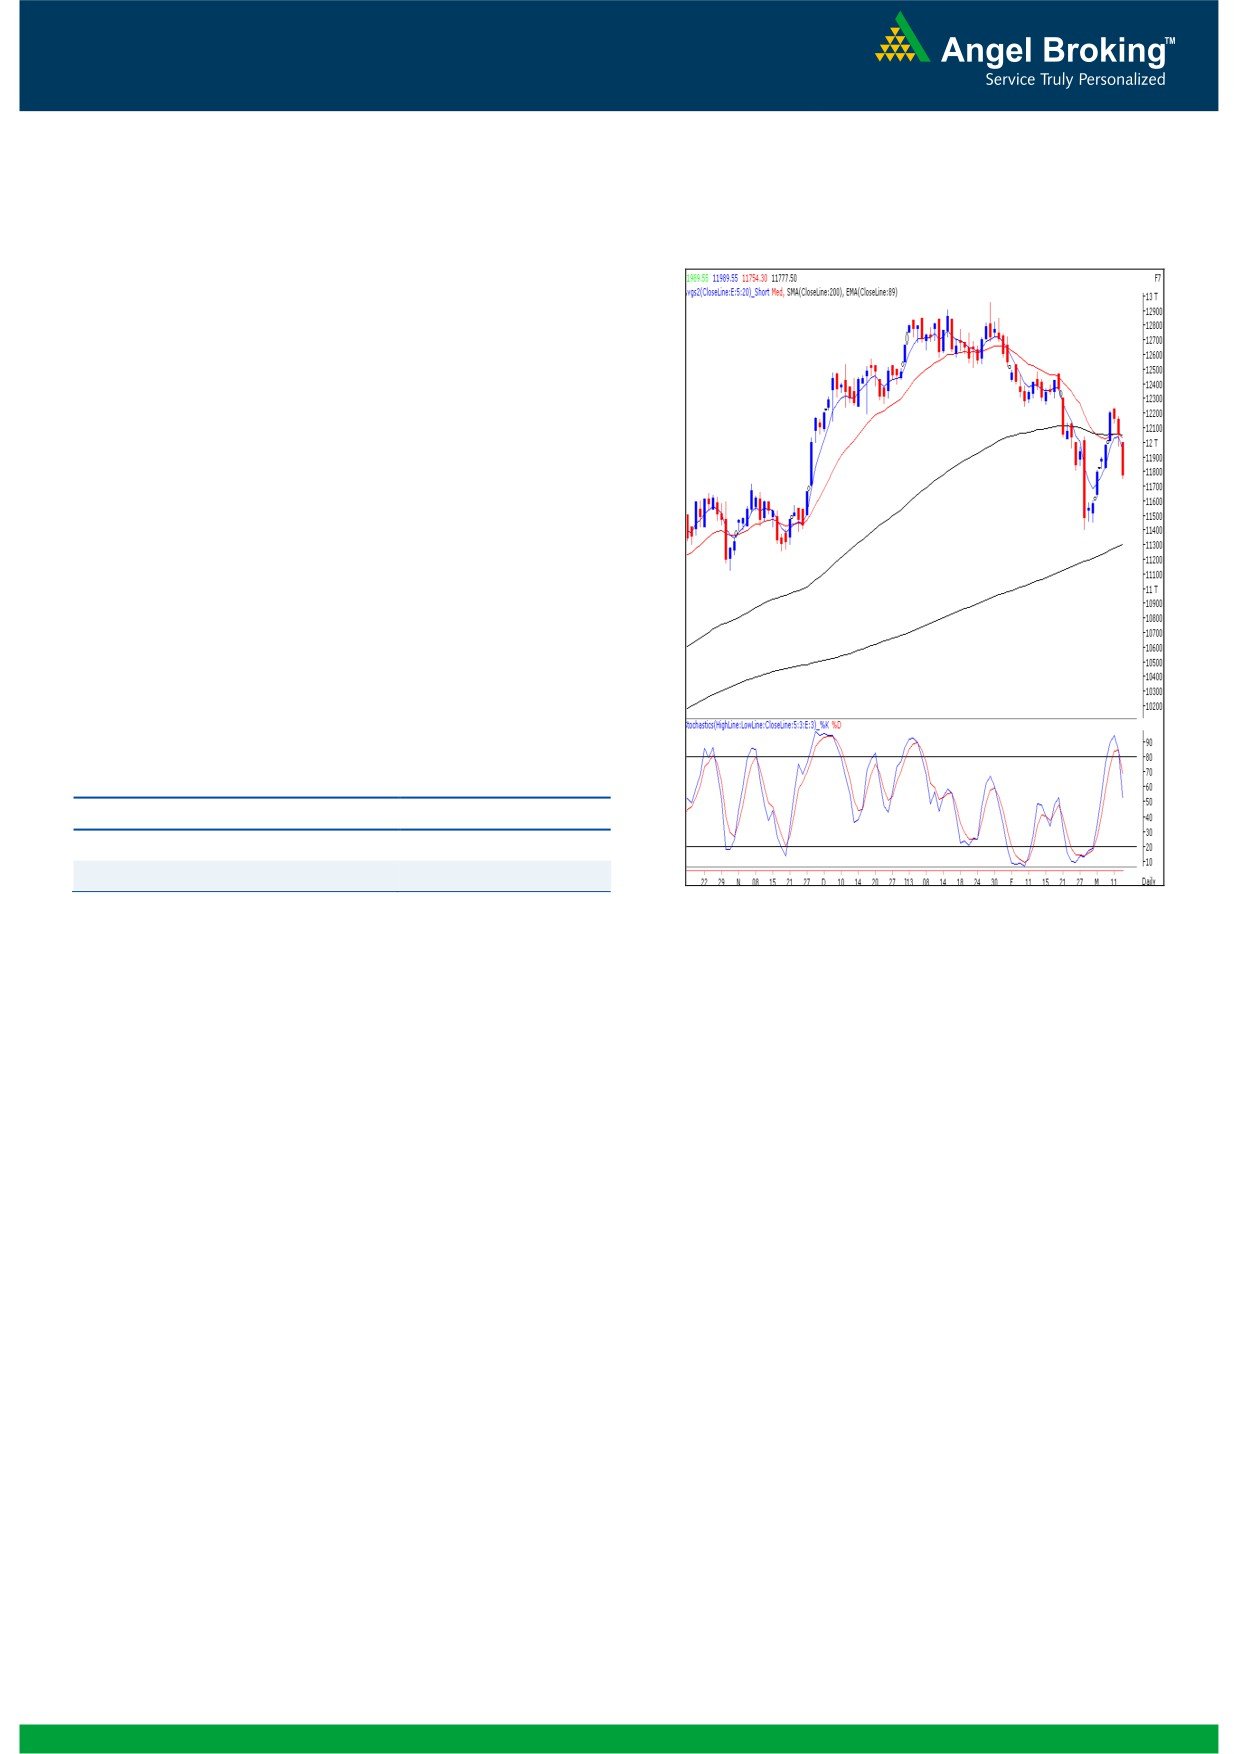
Exhibit 2: Bank Nifty Daily Chart
Bank Nifty Outlook - (11778)
Yesterday, Bank Nifty too opened with a downside gap in-line
with our benchmark indices. During the opening trade, index
opened well below the mentioned support level of 11971.As
a result, we observed immense selling in Bank Nifty and the
index closed at the lowest point of the session. Similar to our
benchmark indices, the 'Stochastic' oscillator in Bank Nifty too
has signaled a negative crossover. Moreover, the daily chart
too is in a strong lower top lower bottom cycle. Hence, we
may witness continuation of yesterday's corrective move if
index sustain below yesterday's low of 11754. In this scenario,
Bank Nifty may slide towards 11623/ 11458-. On the upside,
yesterday's high of 11990 will now act as a resistance for
coming trading session.
Actionable points:
View
Bearish below 11754
Expected Target
11623 -11458
Resistance Levels
11990
Source: Falcon:
2
Daily Technical Report
March 14, 2013
Daily Pivot Levels for Nifty 50 Stocks
SCRIPS
S2
S1
PIVOT
R1
R2
SENSEX
19,231
19,297
19,404
19,470
19,578
NIFTY
5,811
5,831
5,862
5,883
5,914
BANKNIFTY
11,605
11,691
11,840
11,927
12,076
ACC
1,222
1,236
1,260
1,274
1,299
AMBUJACEM
186
187
188
189
191
ASIANPAINT
4,671
4,731
4,780
4,840
4,890
AXISBANK
1,312
1,329
1,354
1,371
1,396
BAJAJ-AUTO
1,841
1,868
1,914
1,941
1,986
BANKBARODA
701
711
726
736
751
BHARTIARTL
307
312
316
321
326
BHEL
193
195
198
200
203
BPCL
383
387
393
397
403
CAIRN
293
295
297
299
301
CIPLA
380
382
384
386
388
COALINDIA
312
315
319
323
327
DLF
276
278
281
284
287
DRREDDY
1,787
1,798
1,810
1,821
1,833
GAIL
333
336
341
344
348
GRASIM
2,933
2,960
3,002
3,029
3,071
HCLTECH
763
771
777
785
791
HDFC
796
803
812
818
827
HDFCBANK
624
629
638
643
651
HEROMOTOCO
1,645
1,659
1,670
1,685
1,696
HINDALCO
93
95
97
98
100
HINDUNILVR
440
444
447
450
453
ICICIBANK
1,062
1,074
1,094
1,106
1,126
IDFC
153
154
155
156
157
INFY
2,828
2,846
2,868
2,886
2,908
ITC
296
299
301
304
306
JINDALSTEL
346
350
357
361
367
JPASSOCIAT
74
74
76
77
78
KOTAKBANK
632
641
655
664
677
LT
1,469
1,482
1,497
1,510
1,525
LUPIN
593
597
600
604
607
M&M
901
906
911
916
921
MARUTI
1,344
1,359
1,386
1,402
1,429
NTPC
145
146
147
148
149
ONGC
311
314
319
322
327
PNB
773
781
793
801
813
POWERGRID
108
109
110
110
111
RANBAXY
412
416
420
423
427
RELIANCE
831
838
847
854
864
RELINFRA
414
418
424
428
434
SBIN
2,143
2,161
2,190
2,208
2,236
SESAGOA
160
162
164
166
169
SIEMENS
522
529
540
547
558
SUNPHARMA
827
832
836
841
845
TATAMOTORS
292
297
301
306
311
TATAPOWER
97
97
98
99
99
TATASTEEL
347
350
353
356
359
TCS
1,542
1,547
1,553
1,558
1,564
ULTRACEMCO
1,886
1,896
1,908
1,918
1,930
WIPRO
430
435
440
445
450
3
Daily Technical Report
March 14, 2013
Research Team Tel: 022 - 30940000
DISCLAIMER
This document is solely for the personal information of the recipient, and must not be singularly used as the basis of any investment
decision. Nothing in this document should be construed as investment or financial advice. Each recipient of this document should make
such investigations as they deem necessary to arrive at an independent evaluation of an investment in the securities of the companies
referred to in this document (including the merits and risks involved), and should consult their own advisors to determine the merits and
risks of such an investment.
Angel Broking Limited, its affiliates, directors, its proprietary trading and investment businesses may, from time to time, make
investment decisions that are inconsistent with or contradictory to the recommendations expressed herein. The views contained in this
document are those of the analyst, and the company may or may not subscribe to all the views expressed within.
Reports based on technical and derivative analysis center on studying charts of a stock's price movement, outstanding positions and
trading volume, as opposed to focusing on a company's fundamentals and, as such, may not match with a report on a company's
fundamentals.
The information in this document has been printed on the basis of publicly available information, internal data and other reliable
sources believed to be true, but we do not represent that it is accurate or complete and it should not be relied on as such, as this
document is for general guidance only. Angel Broking Limited or any of its affiliates/ group companies shall not be in any way
responsible for any loss or damage that may arise to any person from any inadvertent error in the information contained in this report.
Angel Broking Limited has not independently verified all the information contained within this document. Accordingly, we cannot testify,
nor make any representation or warranty, express or implied, to the accuracy, contents or data contained within this document. While
Angel Broking Limited endeavours to update on a reasonable basis the information discussed in this material, there may be regulatory,
compliance, or other reasons that prevent us from doing so.
This document is being supplied to you solely for your information, and its contents, information or data may not be reproduced,
redistributed or passed on, directly or indirectly.
Angel Broking Limited and its affiliates may seek to provide or have engaged in providing corporate finance, investment banking or
other advisory services in a merger or specific transaction to the companies referred to in this report, as on the date of this report or in
the past.
Neither Angel Broking Limited, nor its directors, employees or affiliates shall be liable for any loss or damage that may arise from or in
connection with the use of this information.
Note: Please refer to the important `Stock Holding Disclosure' report on the Angel website (Research Section). Also, please refer to the
latest update on respective stocks for the disclosure status in respect of those stocks. Angel Broking Limited and its affiliates may have
investment positions in the stocks recommended in this report.
Research Team
Shardul Kulkarni
-
Head - Technicals
Sameet Chavan
-
Technical Analyst
Sacchitanand Uttekar
-
Technical Analyst
Ankur Lakhotia
-
Technical Analyst
Angel Broking Pvt. Ltd.
Registered Office: G-1, Ackruti Trade Centre, Rd. No. 7, MIDC, Andheri (E), Mumbai - 400 093.
Corporate Office: 6th Floor, Ackruti Star, MIDC, Andheri (E), Mumbai - 400 093. Tel: (022) 30940000
Sebi Registration No: INB 010996539
4