Daily Technical Report
December 13, 2012
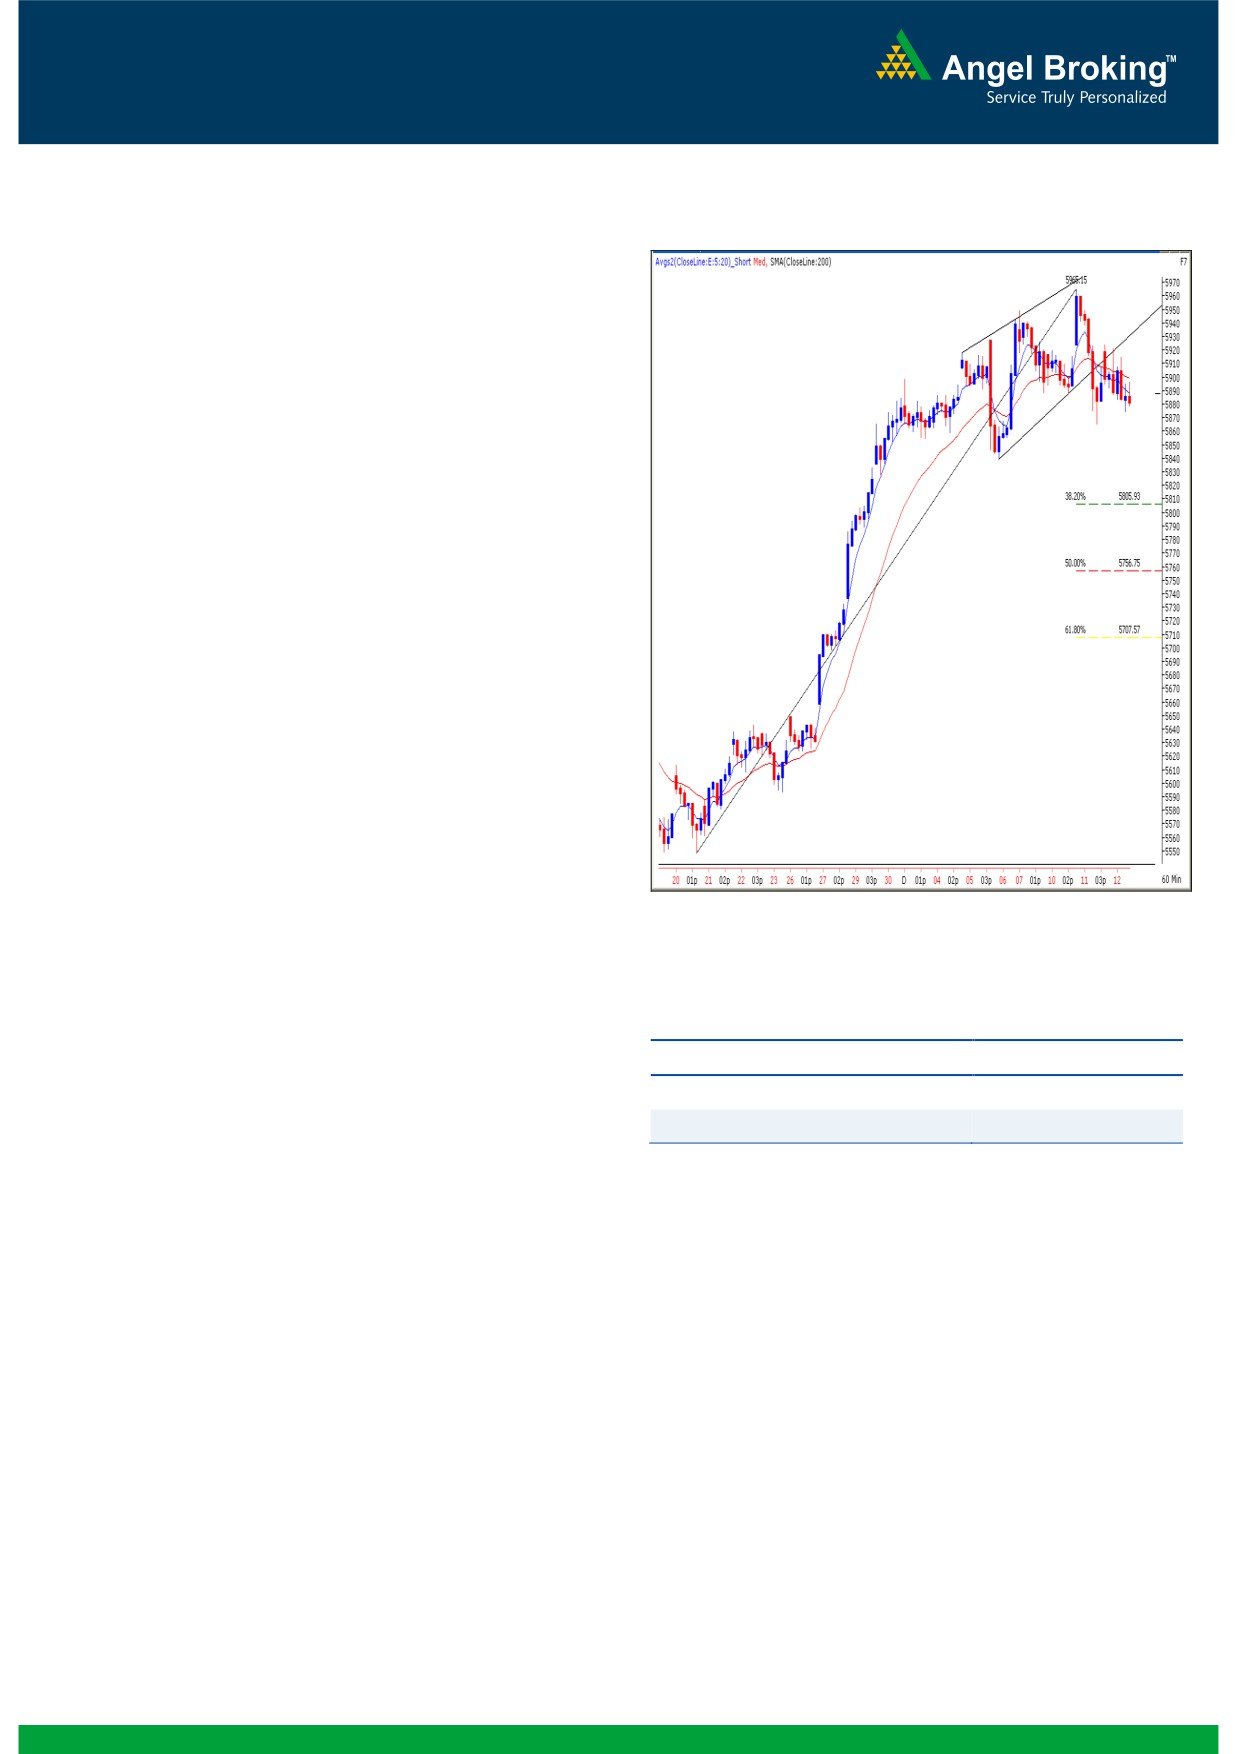
Exhibit 1: Nifty Hourly Chart
Sensex (19355) / NIFTY (5888)
We witnessed a flat opening yesterday in-line with quiet
global cues. During the day, the index traded with extreme
choppiness, although the overall range was 50 points. The
Consumer Durables and the Auto sectors held indices above
intraday support; whereas the Capital Goods and the Metal
counters continuously imposed selling pressure on our
market. The advance to decline ratio was marginally in favor
of declining counters (A=1433 D=1494) (Source
-
Formation
The ’20-day EMA’ and the ’20-week EMA’ are placed at
18980 / 5770 and 18390 / 5586 levels, respectively.
On the weekly chart, we are witnessing a breakout from
‘Downward Sloping Trend Line’ joining two significant
swing high of 19811 / 5944 (April 2011) and 19137 /
5815 (Oct 2012) at 19050 / 5800 level .
The 78.60% Fibonacci retracement level of the fall from
November 5, 2010 (the high was 21109 / 6339) to
December 23, 2011 (the low was 15135 / 4531) is at
19812 / 5945.
Source: Falcon:
On the daily chart, we are observing a ‘Hanging Man’
candlestick pattern, occurred on December 6, 2012.
Actionable points:
Trading strategy:
View for the day
Bearish below 5865
Yesterday’s session was a nightmare for the day traders as
we witnessed a very choppy session. Just before the
Expected Targets
5820 - 5800
midsession, indices recouped their early losses on the back
Resistance Levels
5925 - 5965
of better-than-expected October month IIP numbers but
eventually closed in the negative territory. We reiterate our
view that a move below Tuesday’s low of 19285 / 5865
would confirm ‘Lower Top Lower Bottom’ formation in hourly
chart. In this scenario, Indices may slide down towards the
next support zone of 19100 - 19050 / 5820 - 5800, which
coincides with the ’20-day EMA’ as well as 38.20% Fibonacci
retracement level of the current up move from 18256 / 5548
to 19612 / 5965. On the flipside, 19479 - 19612 / 5925 -
5965 levels are likely to act as a strong resistance in coming
trading session.
1
Daily Technical Report
December 13, 2012
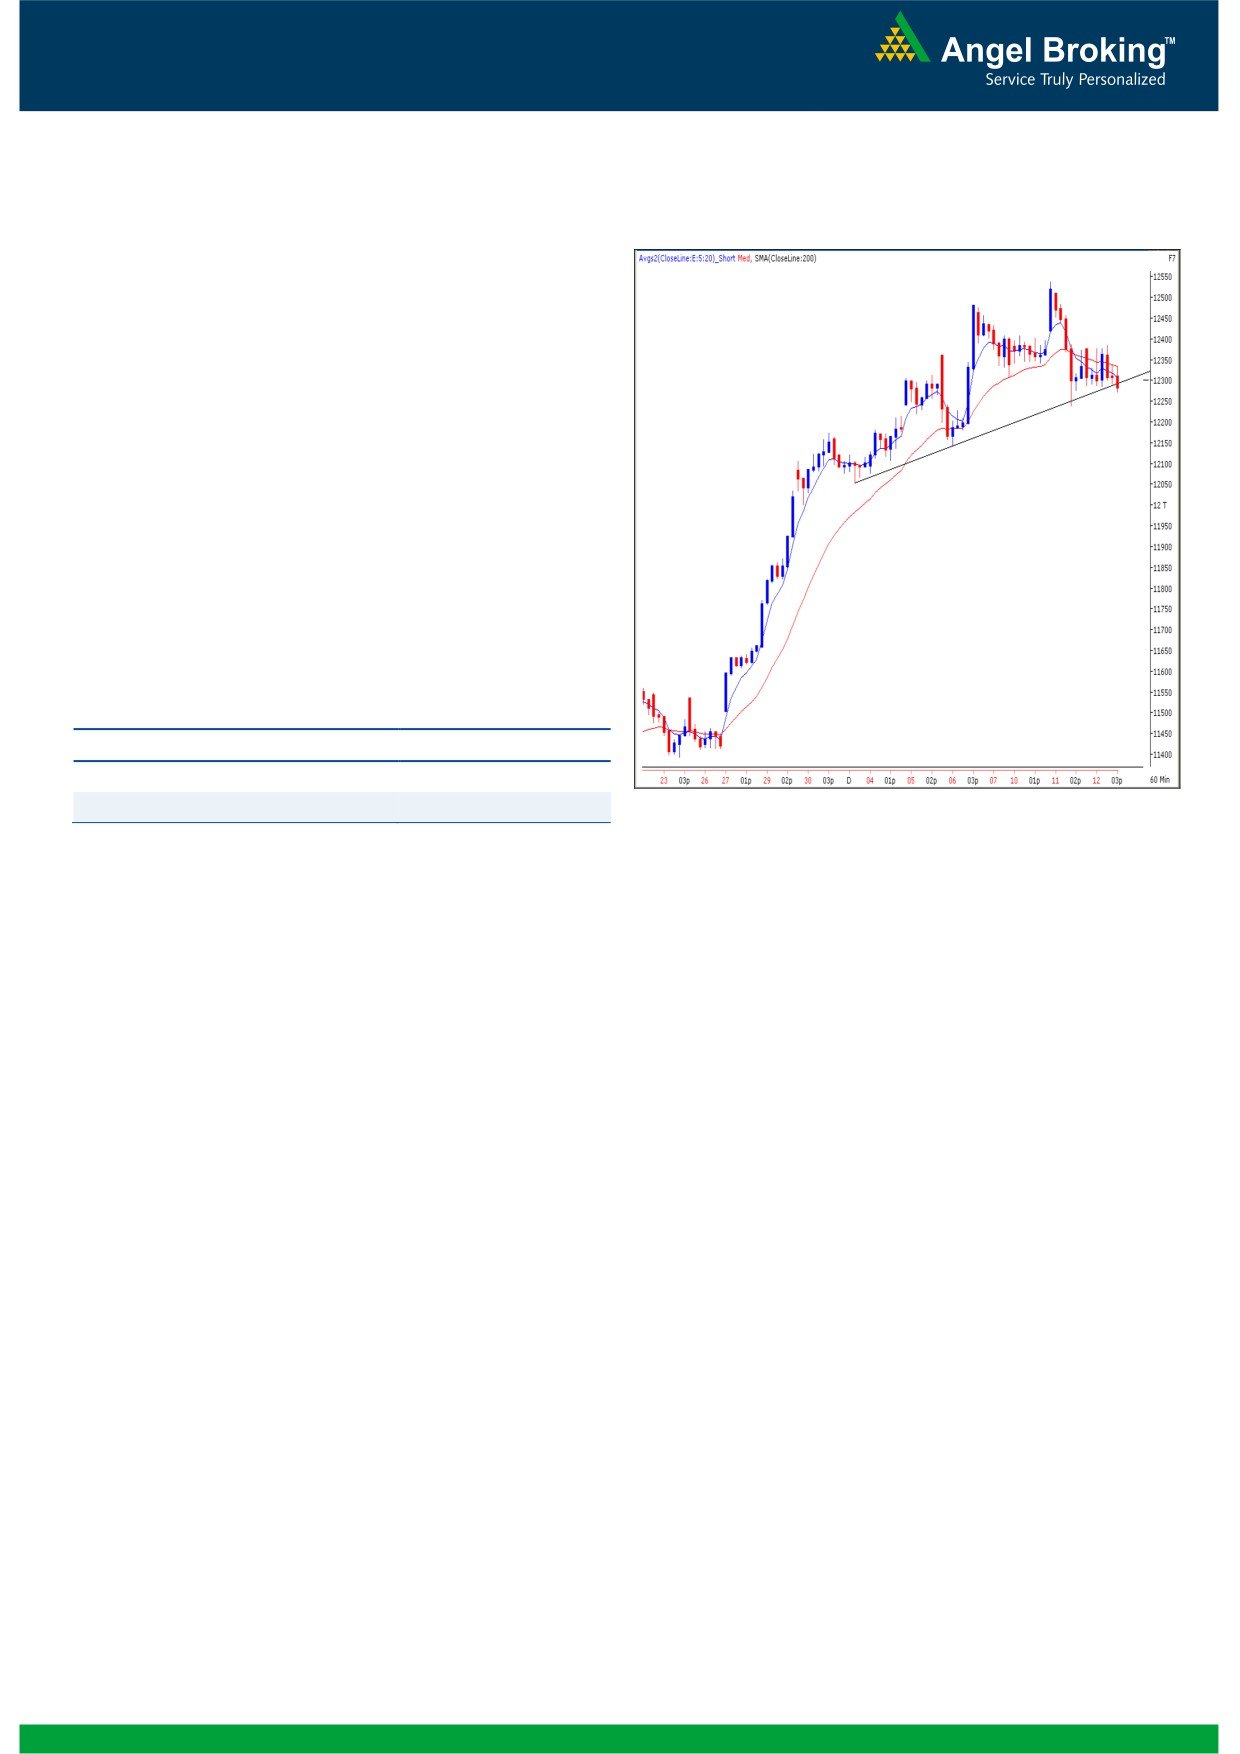
Exhibit 2: Bank Nifty Hourly Chart
Bank Nifty Outlook - (12302)
Yesterday, In line with the benchmark indices the Bank Nifty
too opened on a flat note but traded with extreme choppiness
to finally close with a loss of 0.35%. The index is still trading
above the previously mentioned support trend line formed by
joining the intraday lows of 12053 and 12142. Also we are
now witnessing a negative crossover in “RSI” momentum
oscillator on the daily chart. The effect of the mentioned tool
would be seen if the index sustains below yesterday’s low of
12271 and the Bank Nifty is then likely to drift towards 12142
- 12048 levels. On the upside 12300 - 12388 levels are
likely to act as resistance for the day.
Actionable points:
View for the day
Bearish Below 12271
Expected targets
12142 - 12048
Source: Falcon:
Resistance Levels
12300 - 12388
2
Daily Technical Report
December 13, 2012
Research Team Tel: 022 - 39357800
DISCLAIMER
This document is solely for the personal information of the recipient, and must not be singularly used as the basis of any investment
decision. Nothing in this document should be construed as investment or financial advice. Each recipient of this document should make
such investigations as they deem necessary to arrive at an independent evaluation of an investment in the securities of the companies
referred to in this document (including the merits and risks involved), and should consult their own advisors to determine the merits and
risks of such an investment.
Angel Broking Limited, its affiliates, directors, its proprietary trading and investment businesses may, from time to time, make
investment decisions that are inconsistent with or contradictory to the recommendations expressed herein. The views contained in this
document are those of the analyst, and the company may or may not subscribe to all the views expressed within.
Reports based on technical and derivative analysis center on studying charts of a stock's price movement, outstanding positions and
trading volume, as opposed to focusing on a company's fundamentals and, as such, may not match with a report on a company's
fundamentals.
The information in this document has been printed on the basis of publicly available information, internal data and other reliable
sources believed to be true, but we do not represent that it is accurate or complete and it should not be relied on as such, as this
document is for general guidance only. Angel Broking Limited or any of its affiliates/ group companies shall not be in any way
responsible for any loss or damage that may arise to any person from any inadvertent error in the information contained in this report.
Angel Broking Limited has not independently verified all the information contained within this document. Accordingly, we cannot testify,
nor make any representation or warranty, express or implied, to the accuracy, contents or data contained within this document. While
Angel Broking Limited endeavours to update on a reasonable basis the information discussed in this material, there may be regulatory,
compliance, or other reasons that prevent us from doing so.
This document is being supplied to you solely for your information, and its contents, information or data may not be reproduced,
redistributed or passed on, directly or indirectly.
Angel Broking Limited and its affiliates may seek to provide or have engaged in providing corporate finance, investment banking or
other advisory services in a merger or specific transaction to the companies referred to in this report, as on the date of this report or in
the past.
Neither Angel Broking Limited, nor its directors, employees or affiliates shall be liable for any loss or damage that may arise from or in
connection with the use of this information.
Note: Please refer to the important `Stock Holding Disclosure' report on the Angel website (Research Section). Also, please refer to the
latest update on respective stocks for the disclosure status in respect of those stocks. Angel Broking Limited and its affiliates may have
investment positions in the stocks recommended in this report.
Research Team
Shardul Kulkarni
-
Head - Technicals
Sameet Chavan
-
Technical Analyst
Sacchitanand Uttekar
-
Technical Analyst
Mehul Kothari
-
Technical Analyst
Ankur Lakhotia
-
Technical Analyst
Angel Broking Pvt. Ltd.
Registered Office: G-1, Ackruti Trade Centre, Rd. No. 7, MIDC, Andheri (E), Mumbai - 400 093.
Corporate Office: 6th Floor, Ackruti Star, MIDC, Andheri (E), Mumbai - 400 093. Tel: (022) 3952 6600
Sebi Registration No: INB 010996539
4