Daily Technical Report
June 13, 2013
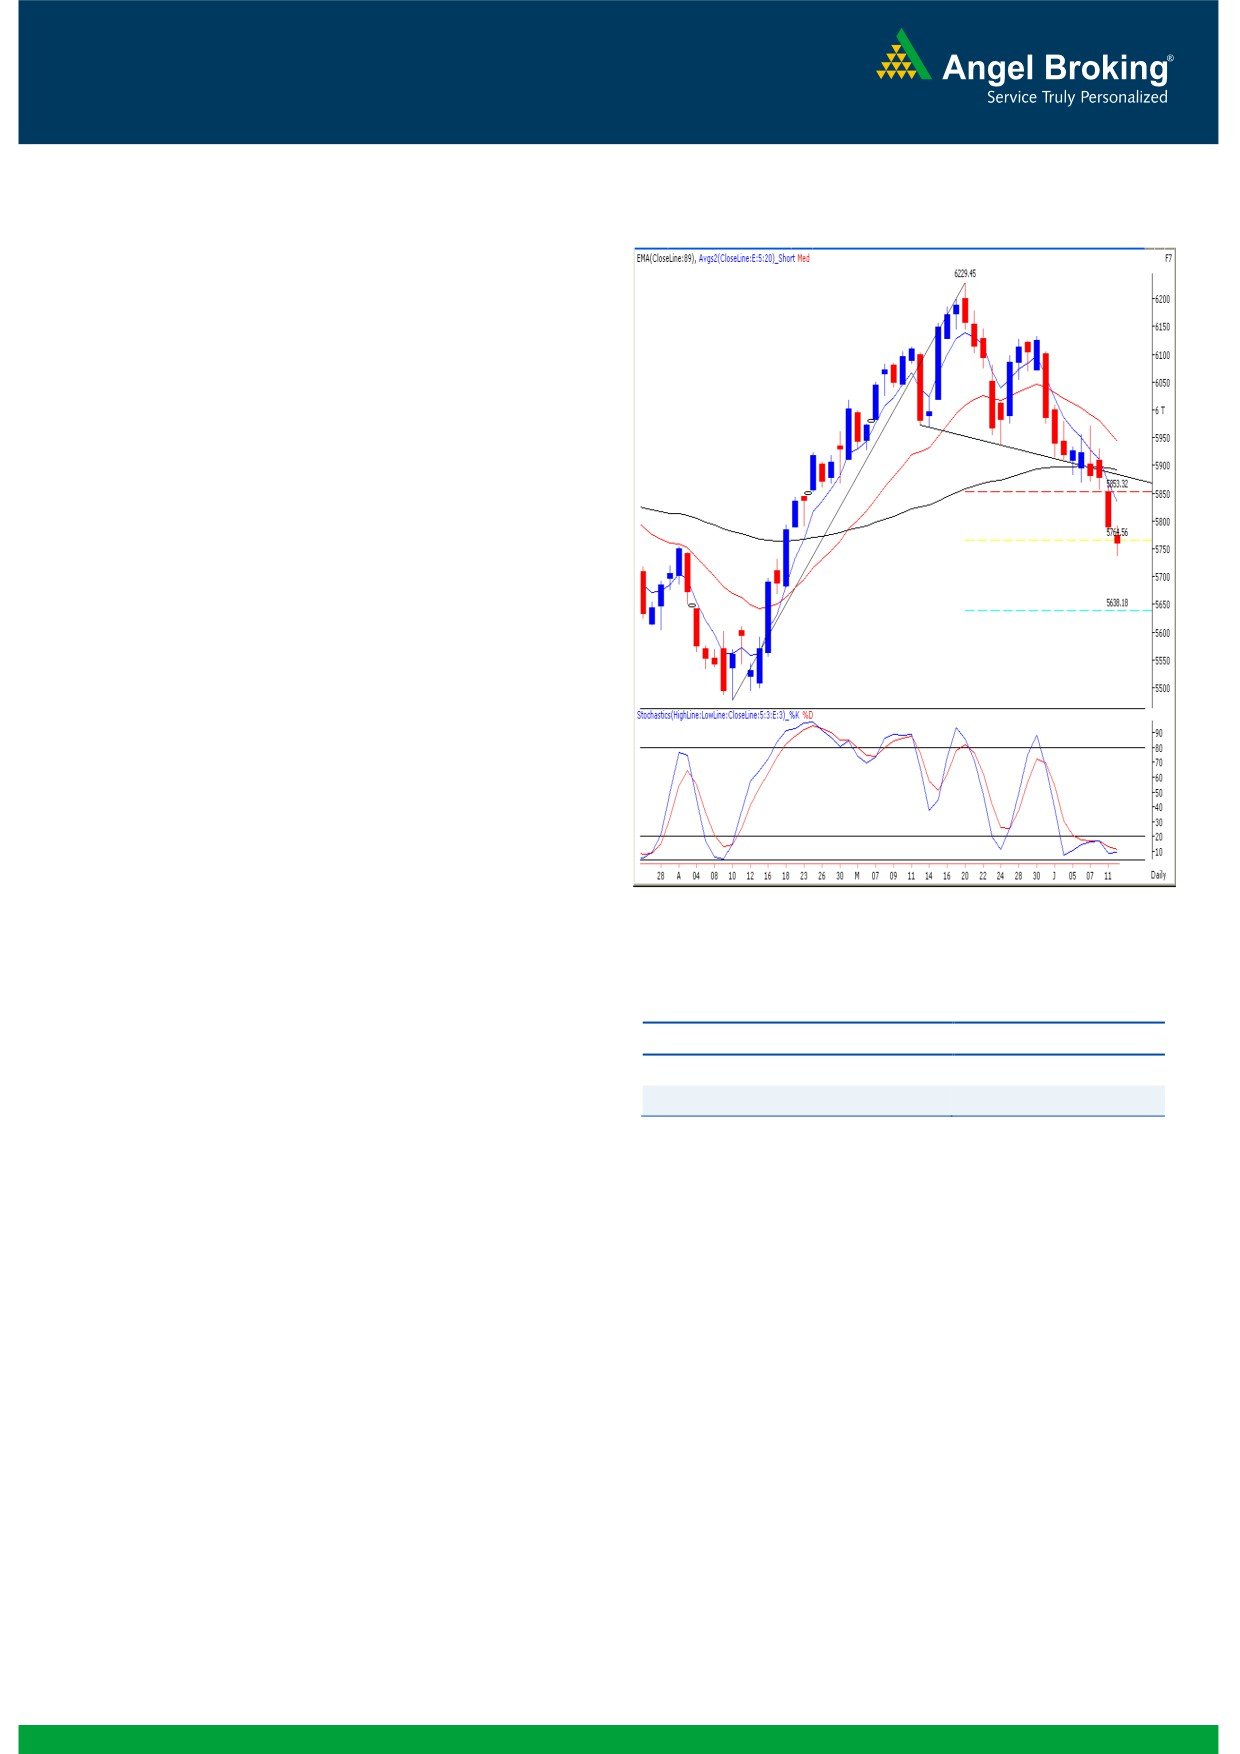
Exhibit 1: Nifty Daily Chart
Sensex (19041) / NIFTY (5760)
Yesterday, our benchmark indices opened slightly lower, in
line with global peers. The bears’ continue to have an upper
hand and pessimism was seen in case of individual index
counters. Overall, the markets ended the session with a half
a percent cut. During the session, the Consumer Durables
counters corrected heavily along with the Metal and IT
stocks; whereas the Health Care and Oil & Gas sectors
defended the market. The advance to decline ratio was in
favor of declining counters.
(A=967 D=1398)
Formation
The ’20-week EMA’ and the ’20-day EMA’ are placed at
19378/ 5875 and 19754/ 5991 levels, respectively.
The ’89-day EMA’ and the ‘200-day SMA’ are placed at
19443/ 5897 and 19095 / 5790, respectively.
The weekly ‘RSI’ and ‘Stochastic’ momentum oscillators
are still negatively poised.
Source: Falcon:
The weekly ‘Bearish Engulfing’ and the monthly
‘Shooting Star’ Japanese candlestick patterns are still
intact.
Actionable points:
View
Bearish below 5732
Trading strategy:
Expected Targets
5669 - 5650
For the third consecutive session, our benchmark indices
Resistance levels
5793 - 5830
posted a closing in the negative territory. During the session,
indices breached the 61.8% Fibonacci retracement level of
19022 / 5764 and corrected towards the mentioned support
level of 18870 / 5732. This level provided a decent support
and as a result, indices bounced to eventually close near
19022 / 5764. Yesterday’s price action has resulted in
formation of candlestick pattern, which resembles a
‘Spinning Top’. An occurrence of such pattern near support
level indicates uncertainty among market participants.
Hence, any sustainable move beyond yesterday’s high of
19143 / 5793 may attract intraday buying interest in the
market. In this scenario, indices may rally towards 19271 -
19395 / 5830 - 5869 levels. On the flipside, if indices
sustain below 18870 / 5732, then it may slide towards
18673 - 5669.
1
Daily Technical Report
June 13, 2013
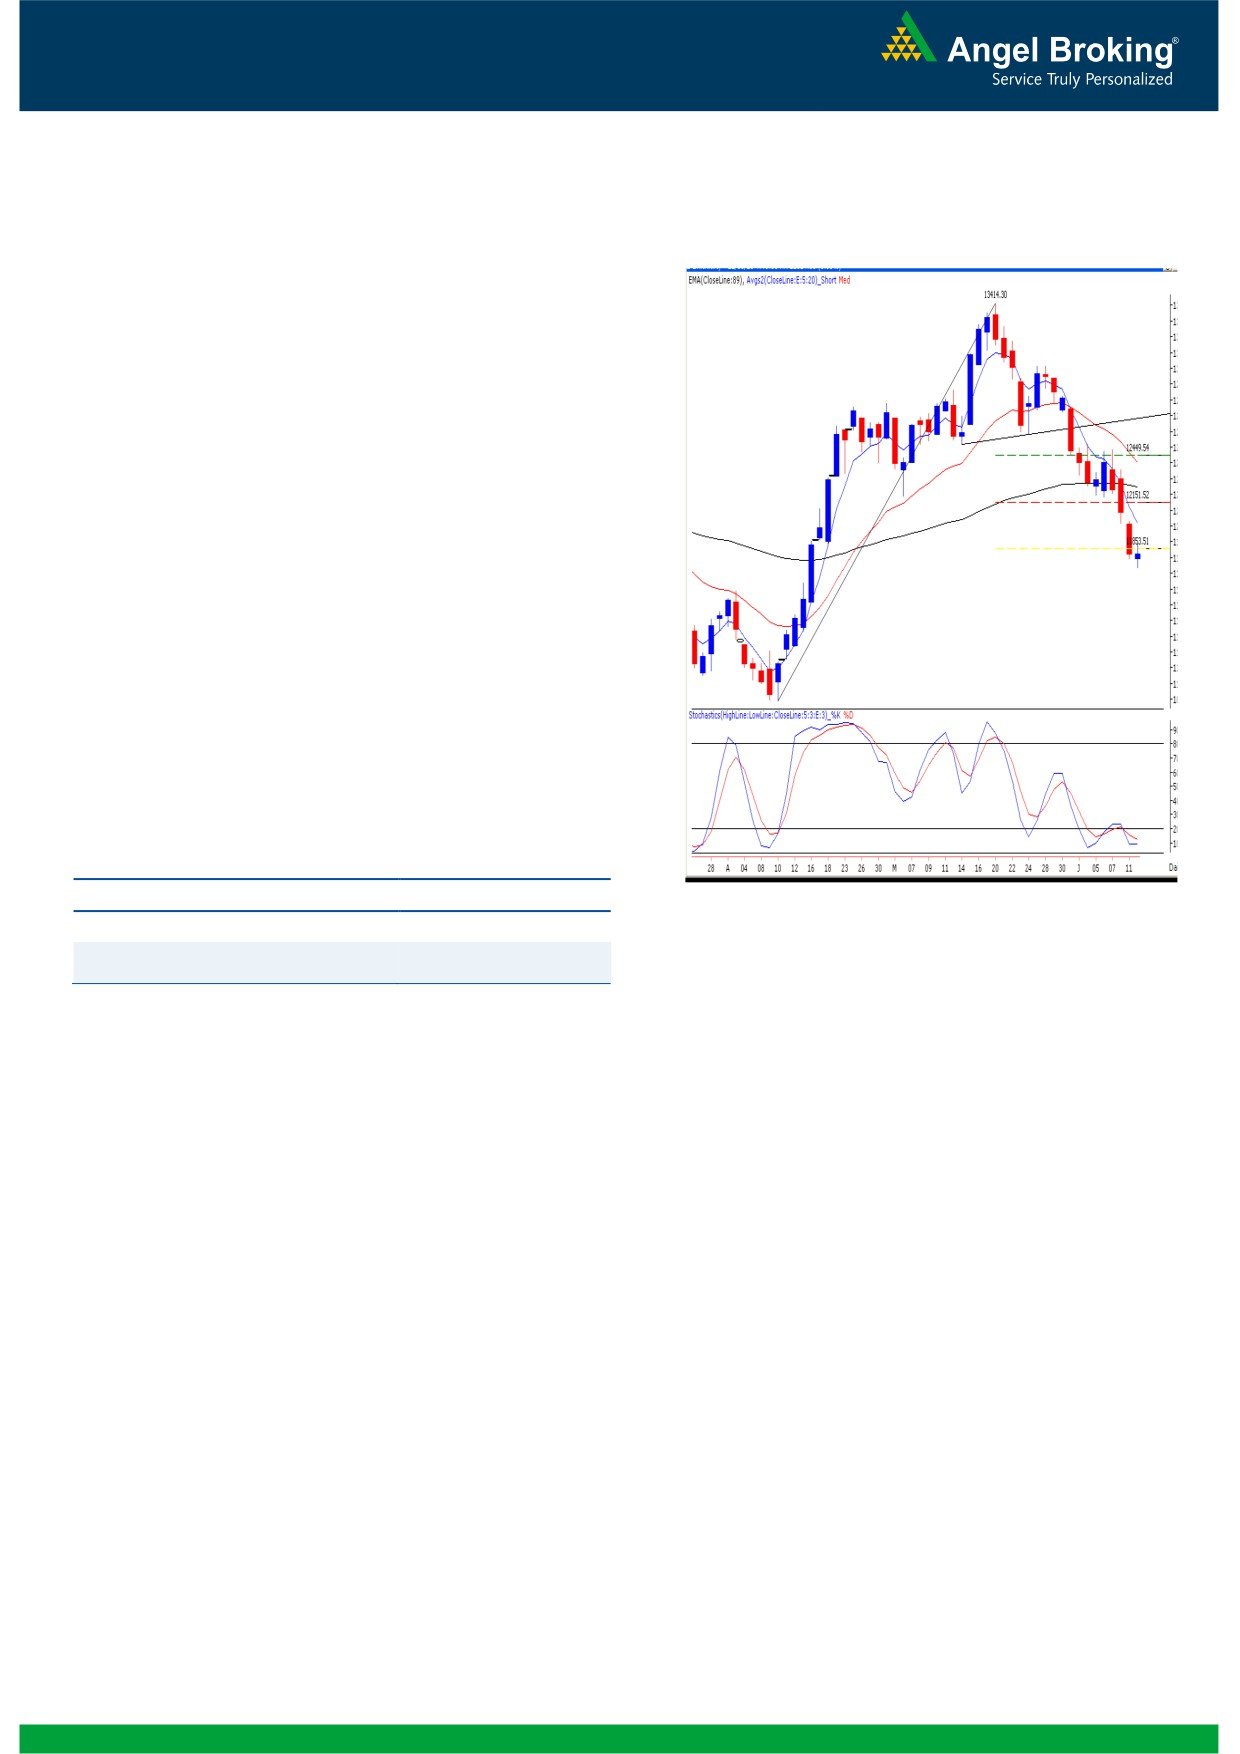
Exhibit 2: Bank Nifty Daily Chart
Bank Nifty Outlook - (11815)
Yesterday, the Bank Nifty opened slightly lower but traded
in a range throughout the session. At present, the Bank
Nifty has closed marginally below the 61.8% Fibonacci
retracement level of
11853. Further, similar to the
benchmark indices, the current daily candle resembles a
‘Spinning Top’ pattern. Hence, only a sustainable move
beyond yesterday’s high of 11899 may attract intraday
optimism. In this case the Bank Nifty may bounce towards
the next resistance levels of 12032 - 12184. Conversely, a
breach of yesterday’s low of 11732 would negate the
pattern and the Bank Nifty then may correct towards
11590 / 11330. It must be noted that the overall chart
structure of the Bank nifty is significantly weaker than the
benchmark indices and selling pressure may intensify
going forward in the next few sessions.
Actionable points:
View
Bearish below 11732
Source: Falcon:
Expected Targets
11590 - 11330
Resistance Levels
12032 - 12184
2
Daily Technical Report
June 13, 2013
Daily Pivot Levels for Nifty 50 Stocks
SCRIPS
S2
S1
PIVOT
R1
R2
SENSEX
18,877
18,959
19,051
19,133
19,225
NIFTY
5,710
5,735
5,764
5,789
5,818
BANKNIFTY
11,649
11,732
11,815
11,898
11,982
ACC
1,161
1,187
1,221
1,246
1,281
AMBUJACEM
170
172
174
176
178
ASIANPAINT
4,406
4,451
4,485
4,531
4,565
AXISBANK
1,238
1,256
1,285
1,303
1,332
BAJAJ-AUTO
1,689
1,716
1,750
1,777
1,811
BANKBARODA
636
644
651
659
666
BHARTIARTL
271
274
278
281
285
BHEL
175
177
180
183
186
BPCL
350
356
362
368
374
CAIRN
284
287
289
292
295
CIPLA
378
381
383
386
388
COALINDIA
294
299
304
309
314
DLF
182
186
189
193
197
DRREDDY
2,150
2,164
2,179
2,194
2,209
GAIL
301
303
306
308
311
GRASIM
2,736
2,758
2,782
2,804
2,828
HCLTECH
745
754
762
771
779
HDFC
808
815
822
829
837
HDFCBANK
650
657
665
672
680
HEROMOTOCO
1,545
1,578
1,621
1,653
1,696
HINDALCO
90
91
93
94
96
HINDUNILVR
592
593
594
595
596
ICICIBANK
1,059
1,070
1,080
1,091
1,100
IDFC
136
139
142
145
148
INDUSINDBK
464
478
488
502
512
INFY
2,353
2,387
2,447
2,481
2,540
ITC
325
328
331
334
337
JINDALSTEL
210
223
232
245
254
JPASSOCIAT
60
61
62
64
65
KOTAKBANK
733
740
747
754
761
LT
1,372
1,384
1,397
1,409
1,422
LUPIN
746
758
767
780
789
M&M
908
928
946
965
983
MARUTI
1,453
1,472
1,481
1,500
1,509
NMDC
110
111
113
114
116
NTPC
147
149
151
153
154
ONGC
304
307
310
312
316
PNB
730
742
752
764
774
POWERGRID
106
107
108
109
110
RANBAXY
367
374
380
386
392
RELIANCE
775
783
790
798
805
RELINFRA
330
337
350
357
370
SBIN
1,944
1,975
2,002
2,033
2,060
SESAGOA
140
142
146
148
151
SUNPHARMA
961
971
981
991
1,001
TATAMOTORS
287
290
293
297
300
TATAPOWER
77
78
81
82
85
TATASTEEL
267
271
276
279
284
TCS
1,442
1,455
1,475
1,488
1,508
ULTRACEMCO
1,813
1,827
1,844
1,858
1,874
3
Daily Technical Report
June 13, 2013
Research Team Tel: 022 - 30940000
DISCLAIMER
This document is solely for the personal information of the recipient, and must not be singularly used as the basis of any investment
decision. Nothing in this document should be construed as investment or financial advice. Each recipient of this document should make
such investigations as they deem necessary to arrive at an independent evaluation of an investment in the securities of the companies
referred to in this document (including the merits and risks involved), and should consult their own advisors to determine the merits and
risks of such an investment.
Angel Broking Limited, its affiliates, directors, its proprietary trading and investment businesses may, from time to time, make
investment decisions that are inconsistent with or contradictory to the recommendations expressed herein. The views contained in this
document are those of the analyst, and the company may or may not subscribe to all the views expressed within.
Reports based on technical and derivative analysis center on studying charts of a stock's price movement, outstanding positions and
trading volume, as opposed to focusing on a company's fundamentals and, as such, may not match with a report on a company's
fundamentals.
The information in this document has been printed on the basis of publicly available information, internal data and other reliable
sources believed to be true, but we do not represent that it is accurate or complete and it should not be relied on as such, as this
document is for general guidance only. Angel Broking Limited or any of its affiliates/ group companies shall not be in any way
responsible for any loss or damage that may arise to any person from any inadvertent error in the information contained in this report.
Angel Broking Limited has not independently verified all the information contained within this document. Accordingly, we cannot testify,
nor make any representation or warranty, express or implied, to the accuracy, contents or data contained within this document. While
Angel Broking Limited endeavors to update on a reasonable basis the information discussed in this material, there may be regulatory,
compliance, or other reasons that prevent us from doing so.
This document is being supplied to you solely for your information, and its contents, information or data may not be reproduced,
redistributed or passed on, directly or indirectly.
Angel Broking Limited and its affiliates may seek to provide or have engaged in providing corporate finance, investment banking or
other advisory services in a merger or specific transaction to the companies referred to in this report, as on the date of this report or in
the past.
Neither Angel Broking Limited, nor its directors, employees or affiliates shall be liable for any loss or damage that may arise from or in
connection with the use of this information.
Note: Please refer to the important `Stock Holding Disclosure' report on the Angel website (Research Section). Also, please refer to the
latest update on respective stocks for the disclosure status in respect of those stocks. Angel Broking Limited and its affiliates may have
investment positions in the stocks recommended in this report.
Research Team
Shardul Kulkarni
-
Head - Technicals
Sameet Chavan
-
Technical Analyst
Sacchitanand Uttekar
-
Technical Analyst
Angel Broking Pvt. Ltd.
Registered Office: G-1, Ackruti Trade Centre, Rd. No. 7, MIDC, Andheri (E), Mumbai - 400 093.
Corporate Office: 6th Floor, Ackruti Star, MIDC, Andheri (E), Mumbai - 400 093. Tel: (022) 30940000
Sebi Registration No: INB 010996539
4