Daily Technical Report
May 13, 2013
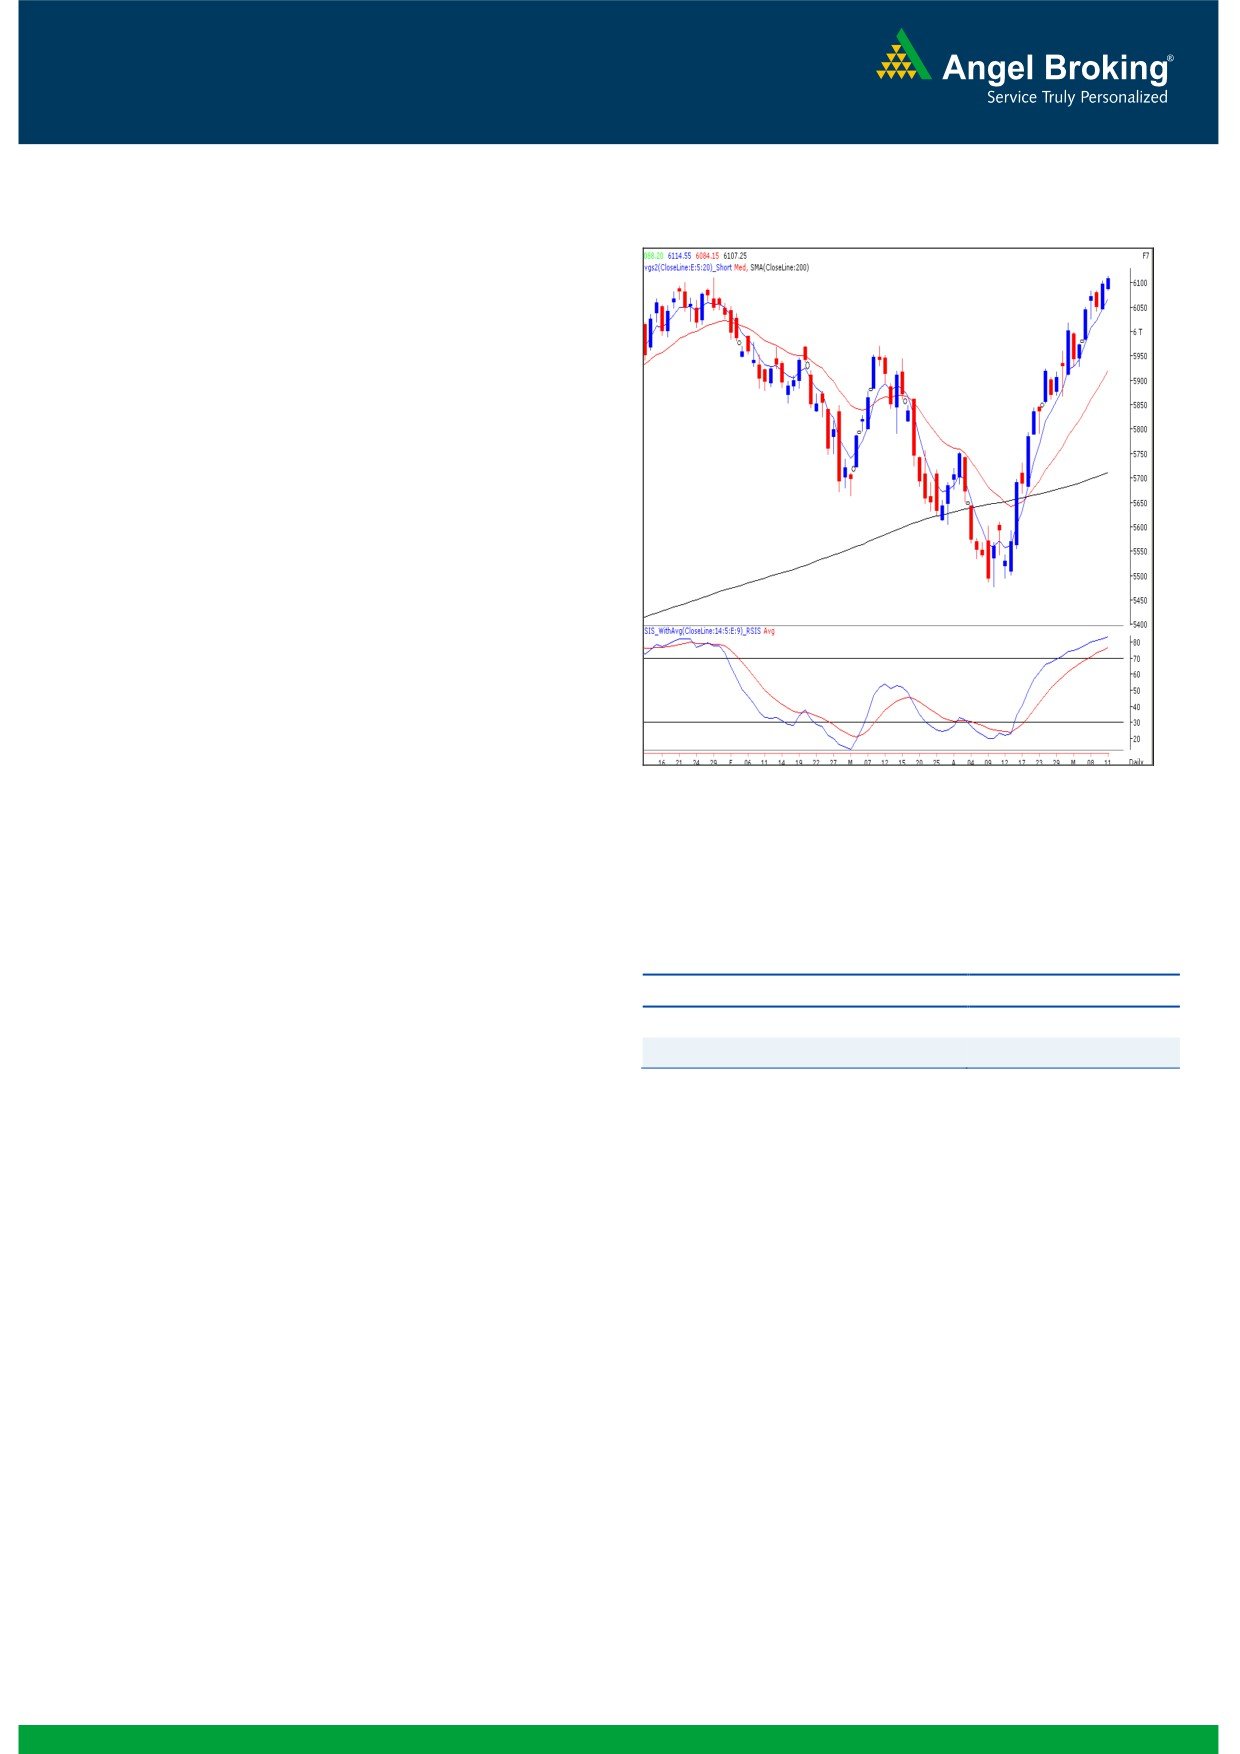
Exhibit 1: Nifty Daily Chart
Sensex (20122) / NIFTY (6107)
On Friday, indices opened on a flat note and traded in a
narrow range during first half of the session. However during
the second half buying interest among market participants
led the index to close above the 6100 mark. During the
session, Healthcare, Metal and Consumer Durables sectors
were among the major gainers; whereas the IT, Power and
Teck counters ended with marginal losses. The advance to
decline ratio was in favor of advancing counters. (A=1023
D=647)
Formation
The ’20-week EMA’ and the ’20-day EMA’ are placed at
19187/ 5815 and 19503/ 5919 levels, respectively.
The ’89-day EMA’ and the ‘200-day SMA’ are placed at
19212/ 5822 and 18834 / 5711, respectively.
Source: Falcon:
The weekly ADX (9) indicator and the ‘RSI-Smoothened’
oscillator are still positively poised.
Actionable points:
Trading strategy:
For the fourth consecutive week, our benchmark indices have
View
Neutral
closed in the positive territory. We had mentioned in our
Support Level
6040
previous report that the weekly ADX (9) indicator and the
Resistance Levels
6111
‘RSI-Smoothened’ oscillator are positively poised. The impact
of these evidences was seen during the week as indices
precisely tested the ’52-week’ high of 20204 / 6112 (Sensex
is trading bit lower than 20204; whereas Nifty has tested
6112). Considering the weekly price action and sheer
momentum in the market, it can be concluded that if indices
sustain above 20204 / 6112, then the possibility of testing
20665 / 6181 cannot be ruled out. However, the daily
momentum oscillator, viz. the ‘RSI-Smoothened’ has now
entered an extreme overbought territory and some sideways
or corrective movement is also likely. Nevertheless, loss of
current optimism would be seen only below 19903 / 6040
level. In this scenario, indices may test 19743 - 19542 /
5993 - 5928 levels. We advise traders to book their partial
profits and maintain strict stop loss for remaining long
positions.
1
Daily Technical Report
May 13, 2013
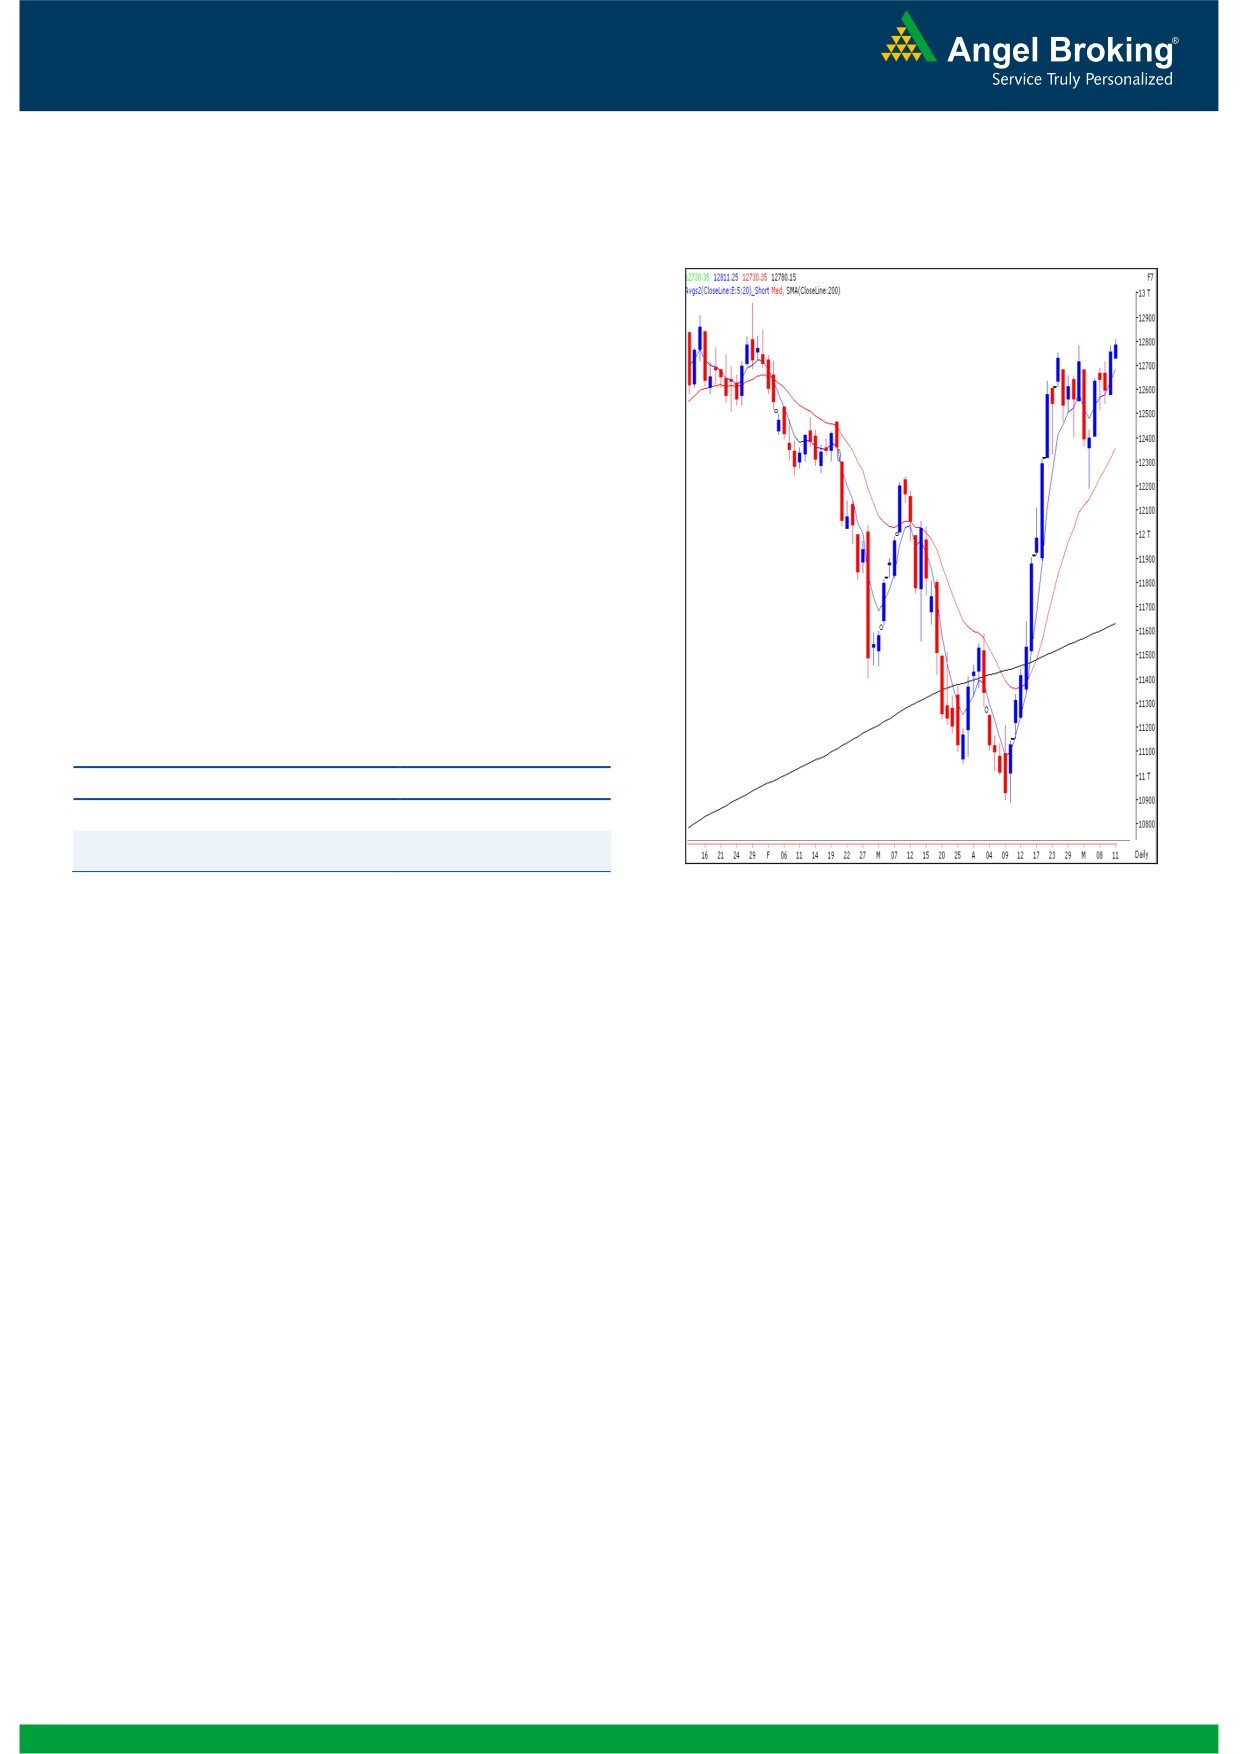
Exhibit 2: Bank Nifty Daily Chart
Bank Nifty Outlook - (12780)
On Friday, Bank Nifty too opened on a flat note in line
with our benchmark indices and traded in a narrow range
during the first half of the session. However, the index
found support near to the hourly ’20 - EMA’ and bounced
back to test the prior swing high of 12783. A sustainable
move above the 12783 level may attract further buying
interest among market participants. However as the risk to
reward ratio in not favorable of the trader, we advise
traders not to create fresh long positions in the index. On
the upside 12838 - 12908 levels are likely to act as
resistance, whereas on the downside 12730 - 12700
levels are likely to act as support for the day
Actionable points:
View
Neutral
Resistance Levels
12838 - 12908
Support Levels
12730 - 12700
Source: Falcon:
2
Daily Technical Report
May 13, 2013
Research Team Tel: 022 - 30940000
DISCLAIMER
This document is solely for the personal information of the recipient, and must not be singularly used as the basis of any investment
decision. Nothing in this document should be construed as investment or financial advice. Each recipient of this document should make
such investigations as they deem necessary to arrive at an independent evaluation of an investment in the securities of the companies
referred to in this document (including the merits and risks involved), and should consult their own advisors to determine the merits and
risks of such an investment.
Angel Broking Limited, its affiliates, directors, its proprietary trading and investment businesses may, from time to time, make
investment decisions that are inconsistent with or contradictory to the recommendations expressed herein. The views contained in this
document are those of the analyst, and the company may or may not subscribe to all the views expressed within.
Reports based on technical and derivative analysis center on studying charts of a stock's price movement, outstanding positions and
trading volume, as opposed to focusing on a company's fundamentals and, as such, may not match with a report on a company's
fundamentals.
The information in this document has been printed on the basis of publicly available information, internal data and other reliable
sources believed to be true, but we do not represent that it is accurate or complete and it should not be relied on as such, as this
document is for general guidance only. Angel Broking Limited or any of its affiliates/ group companies shall not be in any way
responsible for any loss or damage that may arise to any person from any inadvertent error in the information contained in this report.
Angel Broking Limited has not independently verified all the information contained within this document. Accordingly, we cannot testify,
nor make any representation or warranty, express or implied, to the accuracy, contents or data contained within this document. While
Angel Broking Limited endeavors to update on a reasonable basis the information discussed in this material, there may be regulatory,
compliance, or other reasons that prevent us from doing so.
This document is being supplied to you solely for your information, and its contents, information or data may not be reproduced,
redistributed or passed on, directly or indirectly.
Angel Broking Limited and its affiliates may seek to provide or have engaged in providing corporate finance, investment banking or
other advisory services in a merger or specific transaction to the companies referred to in this report, as on the date of this report or in
the past.
Neither Angel Broking Limited, nor its directors, employees or affiliates shall be liable for any loss or damage that may arise from or in
connection with the use of this information.
Note: Please refer to the important `Stock Holding Disclosure' report on the Angel website (Research Section). Also, please refer to the
latest update on respective stocks for the disclosure status in respect of those stocks. Angel Broking Limited and its affiliates may have
investment positions in the stocks recommended in this report.
Research Team
Shardul Kulkarni
-
Head - Technicals
Sameet Chavan
-
Technical Analyst
Sacchitanand Uttekar
-
Technical Analyst
Ankur Lakhotia
-
Technical Analyst
Angel Broking Pvt. Ltd.
Registered Office: G-1, Ackruti Trade Centre, Rd. No. 7, MIDC, Andheri (E), Mumbai - 400 093.
Corporate Office: 6th Floor, Ackruti Star, MIDC, Andheri (E), Mumbai - 400 093. Tel: (022) 30940000
Sebi Registration No: INB 010996539
4