Daily Technical Report
December 12, 2012
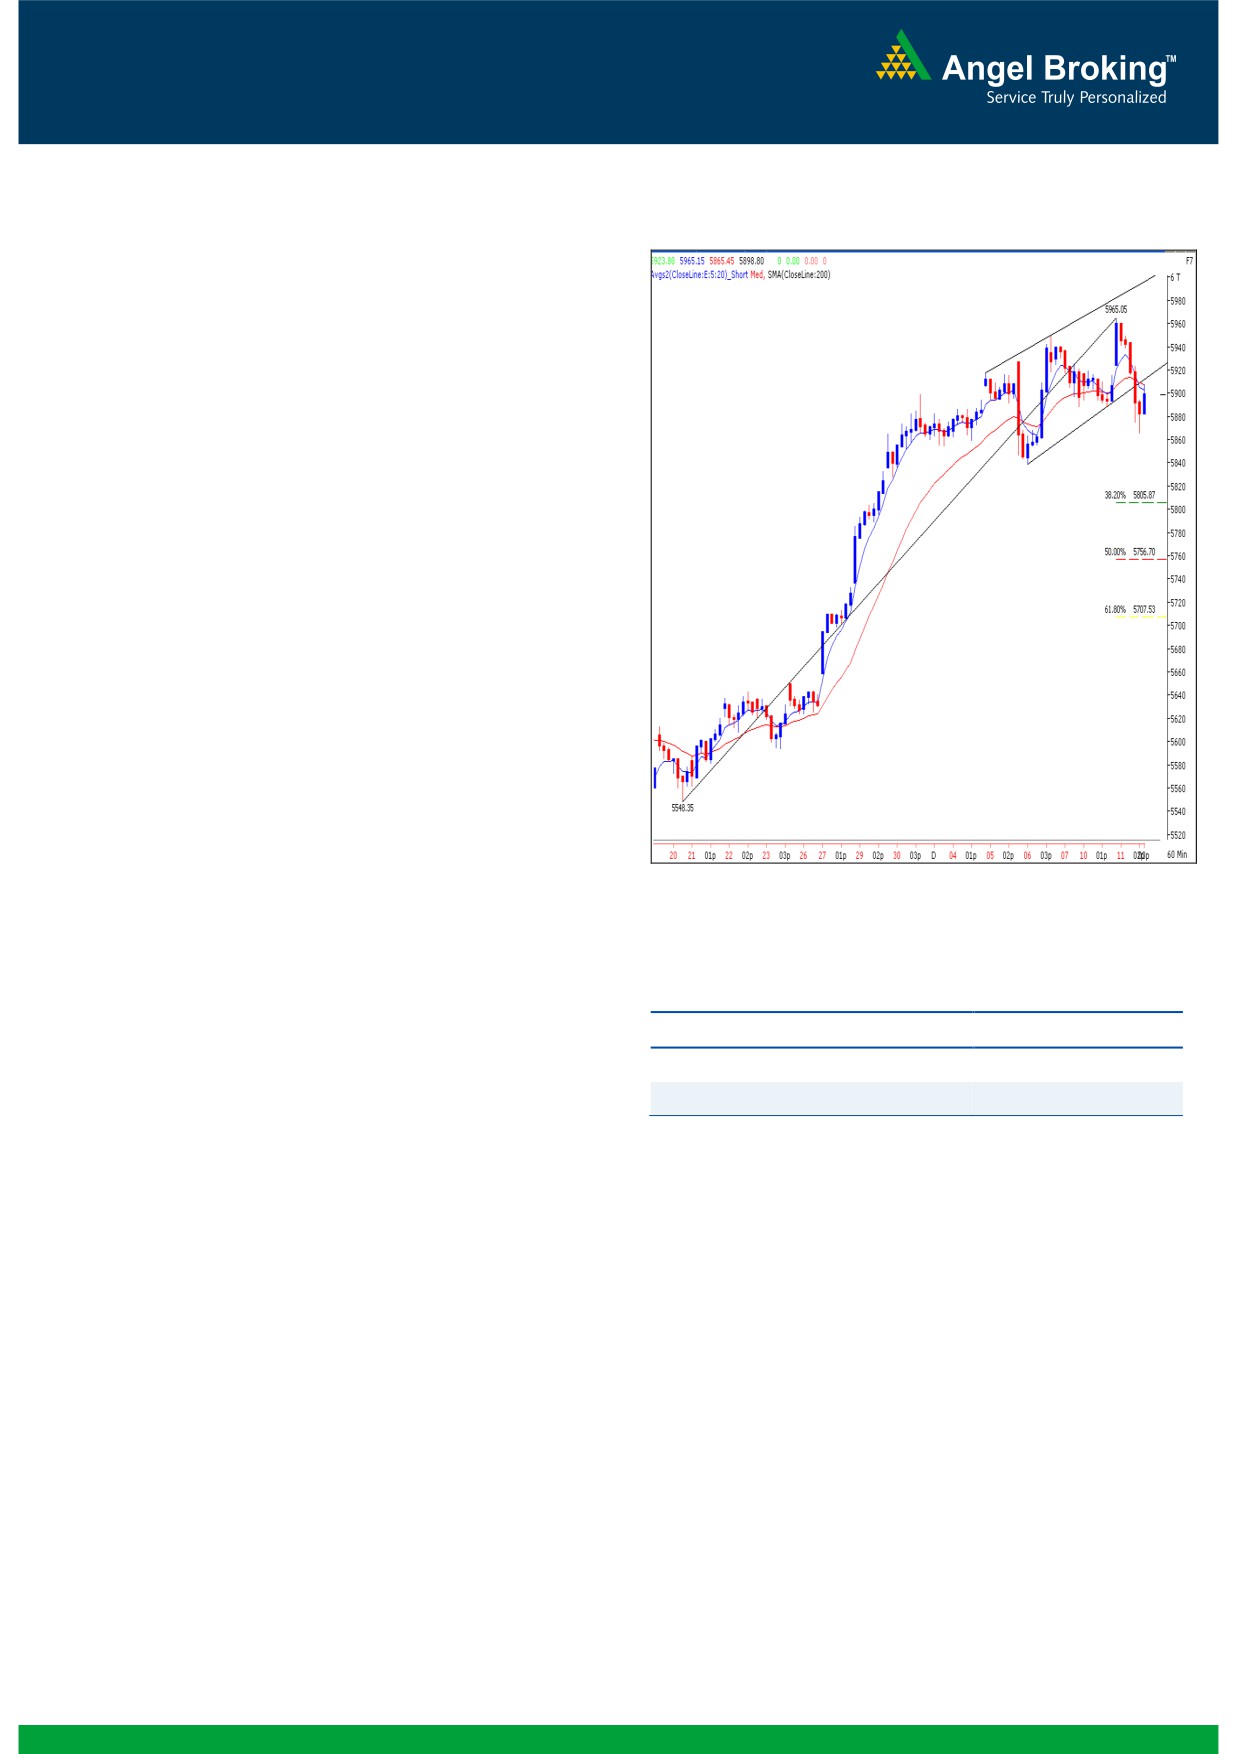
Exhibit 1: Nifty Hourly Chart
Sensex (19387) / NIFTY (5899)
Yesterday, our markets opened slightly higher as suggested
by the SGX Nifty and then we witnessed a sudden spurt in
the Index during the initial hour of the session. However, as
the day progressed, strong selling pressure by the bears
dragged indices significantly lower from the day’s high to
eventually close in the negative territory. The IT and Teck
sectors continued their down move and the high beta space
(Realty, Oil & Gas) contributed to the bearish sentiment;
The FMCG sector was the only sector in green. Undoubtedly,
the advance to decline ratio was in favor of declining
Formation
The ’20-day EMA’ and the ’20-week EMA’ are placed at
18980 / 5770 and 18390 / 5586 levels, respectively.
On the weekly chart, we are witnessing a breakout from
‘Downward Sloping Trend Line’ joining two significant
swing high of 19811 / 5944 (April 2011) and 19137 /
5815 (Oct 2012) at 19050 / 5800 level .
The 78.60% Fibonacci retracement level of the fall from
Source: Falcon:
November 5, 2010 (the high was 21109 / 6339) to
December 23, 2011 (the low was 15135 / 4531) is at
19812 / 5945.
Actionable points:
On the daily chart, we are observing a ‘Hanging Man’
candlestick pattern, occurred on December 6, 2012.
View for the day
Neutral
Resistance Level
5965 - 6000
Trading strategy:
Support Levels
5865 - 5820
Yesterday, our benchmark indices surged nearly 1% in the
initial hour of the trade but failed to carry the positive
momentum throughout the session, to eventually close in the
red. The Indices have now tested the upper trend line of the
‘Channel’ (please refer exhibit) formed in hourly chart. The
fall in the later half has resulted in the breakdown from this
“Channel” and a move below yesterday’s low of 19285 /
5865 would also confirm ‘Lower Top Lower Bottom’
formation in hourly chart. In this scenario, Indices may slide
down towards the next support zone of 19100 - 19050 /
5820 - 5800 which coincides with the ’20-day EMA’ as well
as 38.20% Fibonacci retracement level of the current up
move from 18256 / 5548 to 19612 / 5965. On the flipside,
yesterday’s high of 19612 / 5965 would act as a strong
resistance in coming trading session.
1
Daily Technical Report
December 12, 2012
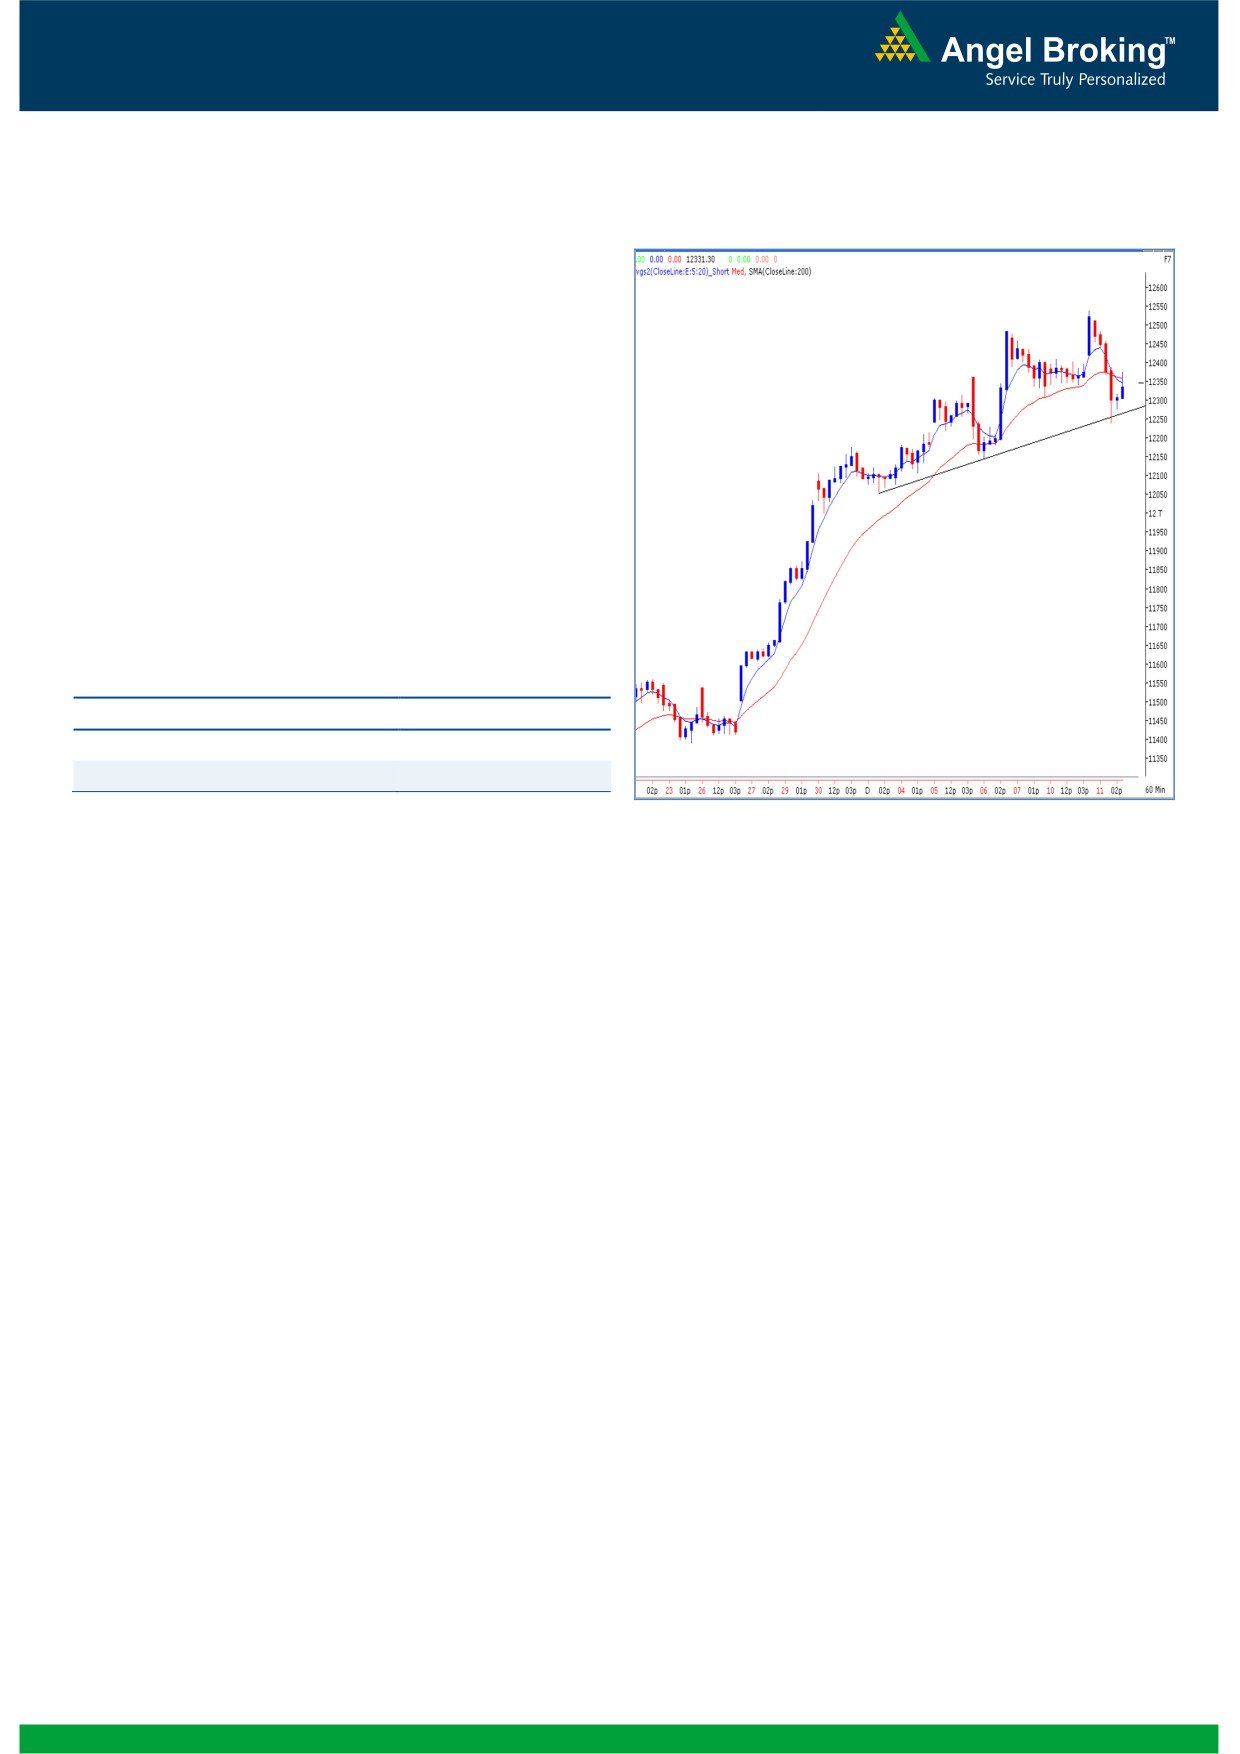
Exhibit 2: Bank Nifty Hourly Chart
Bank Nifty Outlook - (12345)
Yesterday, in line with our benchmark indices the Bank Nifty
too witnessed a volatile session with a trading range of more
than 2%. On the hourly chart, we are witnessing that the
index took support at an ‘Upward Sloping Trend line’ (12248)
formed by joining the recent intraday lows of 12053 and
12143 levels. Also, the hourly ‘5&20 EMA” are signaling
negative crossover. Hence, going forward if Bank Nifty
sustains below yesterday’s low of 12238 then we could see
minor correction towards the 12143 level. On the upside
12375 - 12484 are likely to act as resistance for the day.
Actionable points:
View for the day
Neutral
Resistance Levels
12375 - 12484
Support Levels
12238 - 12143
Source: Falcon:
2
Daily Technical Report
December 12, 2012
Daily Pivot Levels for Nifty 50 Stocks
SCRIPS
S2
S1
PIVOT
R1
R2
SENSEX
19,101
19,244
19,428
19,571
19,755
NIFTY
5,810
5,854
5,910
5,954
6,010
BANKNIFTY
12,073
12,209
12,374
12,510
12,675
ACC
1,395
1,411
1,433
1,449
1,471
AMBUJACEM
204
208
211
215
218
ASIANPAINT
4,238
4,269
4,306
4,338
4,375
AXISBANK
1,295
1,310
1,325
1,340
1,355
BAJAJ-AUTO
1,907
1,957
1,986
2,035
2,064
BANKBARODA
807
816
828
837
848
BHARTIARTL
307
310
316
319
325
BHEL
228
233
239
243
250
BPCL
351
355
359
364
367
CAIRN
312
315
322
325
332
CIPLA
405
411
417
422
429
COALINDIA
349
353
359
364
370
DLF
209
213
219
224
230
DRREDDY
1,836
1,859
1,887
1,910
1,938
GAIL
349
352
354
358
360
GRASIM
3,154
3,182
3,213
3,240
3,272
HCLTECH
598
606
616
625
635
HDFC
859
867
875
883
890
HDFCBANK
679
685
692
698
705
HEROMOTOCO
1,830
1,842
1,852
1,863
1,874
HINDALCO
115
117
121
123
126
HINDUNILVR
524
535
544
555
565
ICICIBANK
1,086
1,104
1,127
1,145
1,168
IDFC
169
171
173
176
177
INFY
2,251
2,273
2,304
2,326
2,358
ITC
299
301
303
306
308
JINDALSTEL
404
412
418
426
431
JPASSOCIAT
101
102
104
105
106
KOTAKBANK
649
658
668
676
686
LT
1,637
1,652
1,666
1,681
1,695
LUPIN
585
593
603
611
622
M&M
918
924
929
935
941
MARUTI
1,448
1,463
1,482
1,496
1,515
NTPC
145
150
154
158
163
ONGC
258
261
264
267
271
PNB
800
815
833
848
867
POWERGRID
116
117
118
119
120
RANBAXY
492
498
506
513
521
RELIANCE
800
810
824
834
848
RELINFRA
501
509
516
524
531
SBIN
2,254
2,281
2,310
2,337
2,366
SESAGOA
182
185
188
190
193
SIEMENS
666
672
678
683
689
SUNPHARMA
689
702
720
733
750
TATAMOTORS
268
273
278
283
288
TATAPOWER
104
106
108
110
112
TATASTEEL
387
392
397
402
407
TCS
1,192
1,206
1,224
1,238
1,257
ULTRACEMCO
1,927
1,953
1,977
2,002
2,026
WIPRO
367
373
381
387
394
3
Daily Technical Report
December 12, 2012
Research Team Tel: 022 - 39357800
DISCLAIMER
This document is solely for the personal information of the recipient, and must not be singularly used as the basis of any investment
decision. Nothing in this document should be construed as investment or financial advice. Each recipient of this document should make
such investigations as they deem necessary to arrive at an independent evaluation of an investment in the securities of the companies
referred to in this document (including the merits and risks involved), and should consult their own advisors to determine the merits and
risks of such an investment.
Angel Broking Limited, its affiliates, directors, its proprietary trading and investment businesses may, from time to time, make
investment decisions that are inconsistent with or contradictory to the recommendations expressed herein. The views contained in this
document are those of the analyst, and the company may or may not subscribe to all the views expressed within.
Reports based on technical and derivative analysis center on studying charts of a stock's price movement, outstanding positions and
trading volume, as opposed to focusing on a company's fundamentals and, as such, may not match with a report on a company's
fundamentals.
The information in this document has been printed on the basis of publicly available information, internal data and other reliable
sources believed to be true, but we do not represent that it is accurate or complete and it should not be relied on as such, as this
document is for general guidance only. Angel Broking Limited or any of its affiliates/ group companies shall not be in any way
responsible for any loss or damage that may arise to any person from any inadvertent error in the information contained in this report.
Angel Broking Limited has not independently verified all the information contained within this document. Accordingly, we cannot testify,
nor make any representation or warranty, express or implied, to the accuracy, contents or data contained within this document. While
Angel Broking Limited endeavours to update on a reasonable basis the information discussed in this material, there may be regulatory,
compliance, or other reasons that prevent us from doing so.
This document is being supplied to you solely for your information, and its contents, information or data may not be reproduced,
redistributed or passed on, directly or indirectly.
Angel Broking Limited and its affiliates may seek to provide or have engaged in providing corporate finance, investment banking or
other advisory services in a merger or specific transaction to the companies referred to in this report, as on the date of this report or in
the past.
Neither Angel Broking Limited, nor its directors, employees or affiliates shall be liable for any loss or damage that may arise from or in
connection with the use of this information.
Note: Please refer to the important `Stock Holding Disclosure' report on the Angel website (Research Section). Also, please refer to the
latest update on respective stocks for the disclosure status in respect of those stocks. Angel Broking Limited and its affiliates may have
investment positions in the stocks recommended in this report.
Research Team
Shardul Kulkarni
-
Head - Technicals
Sameet Chavan
-
Technical Analyst
Sacchitanand Uttekar
-
Technical Analyst
Mehul Kothari
-
Technical Analyst
Ankur Lakhotia
-
Technical Analyst
Angel Broking Pvt. Ltd.
Registered Office: G-1, Ackruti Trade Centre, Rd. No. 7, MIDC, Andheri (E), Mumbai - 400 093.
Corporate Office: 6th Floor, Ackruti Star, MIDC, Andheri (E), Mumbai - 400 093. Tel: (022) 3952 6600
Sebi Registration No: INB 010996539
4