Daily Technical Report
November 12, 2012
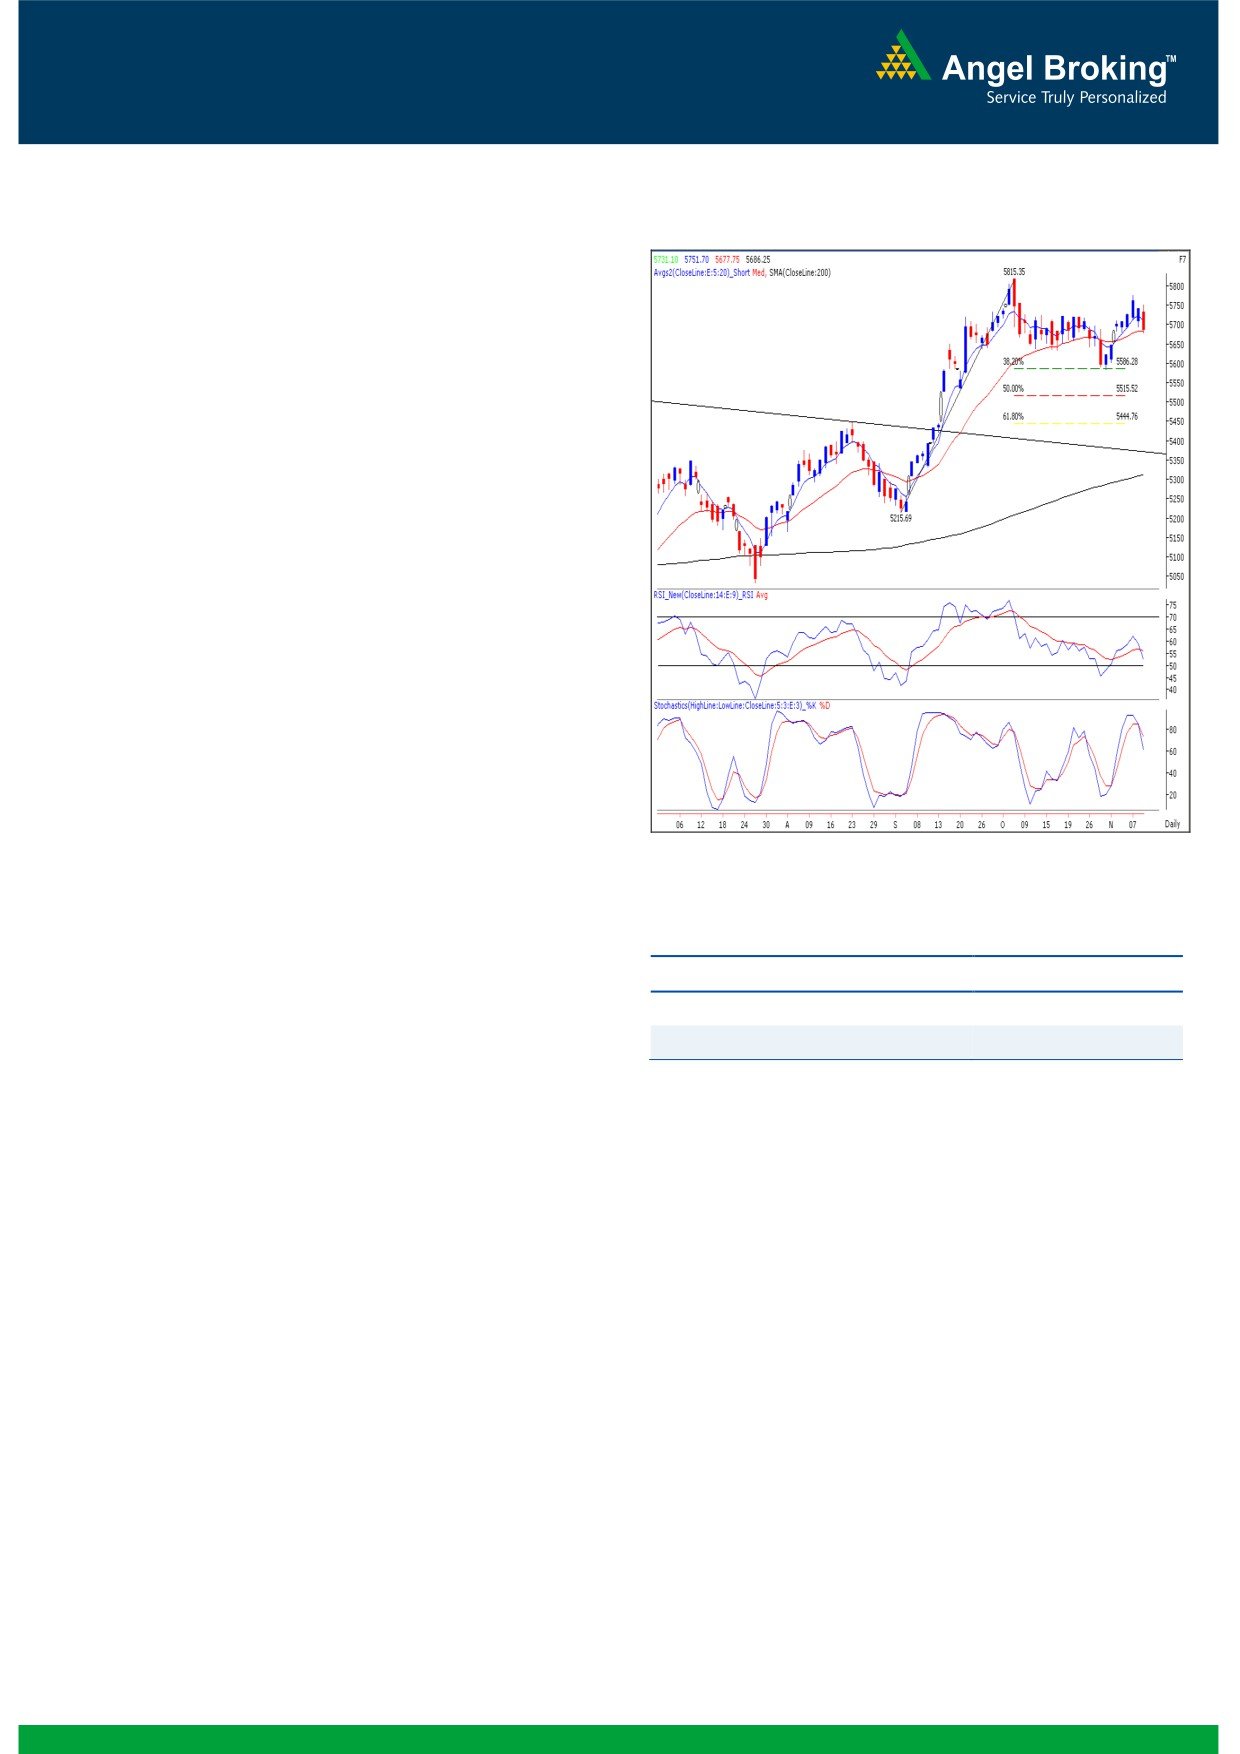
Exhibit 1: Nifty Daily Chart
Sensex (18684) / NIFTY (5686)
On Friday, our benchmark indices traded with negative bias
throughout the day to close with a loss of almost 1% below
the 5700 mark. This was mainly due to poor performance in
the second quarter by the front liners like State Bank of India,
ONGC and Tata Steel. All the sectoral indices ended with
loss on Friday among which PSU, Realty and Metal counters
were the biggest losers. The advance to decline ratio was
strongly in favor of declining counters (A=1121 D=1734)
Formation
The ’20-day EMA’ and the ’20-week EMA’ are placed at
18693 / 5683 and 18119/ 5498 levels, respectively.
The monthly ‘RSI’ oscillator is moving higher from the 50
mark and the positive in the ADX (9) indicator is intact.
The daily momentum oscillators viz, the ‘RSI’ and the
‘Stochastic’ are now signaling a negative crossover.
Trading strategy:
Source: Falcon:
Previously, indices slipped marginally below the support level
of 18530 / 5630 and bounced back sharply after making a
Actionable points:
low of 18393 / 5583. We are now observing a mirror image
of the breakdown, in the form of a breakout beyond the
View for the day
Bearish Below 5677
18886 / 5729 mark. Indices managed to traverse the 18886
Expected Target
5650 - 5583
/ 5729 level and started correcting immediately after a
minor up move. This shows that the market participants are
Resistance Levels
5700 - 5735
skeptical and hence, the market is struggling to find a clear
direction. At this juncture, the daily chart depicts a negative
On the flipside, 19138 / 5816 level would act a strong
crossover in the ‘RSI’ and the ‘Stochastic’ oscillators. This
resistance for our market. Only a sustainable move beyond this
increases the possibility of a near term corrective move if our
level would augment the buying interest and indices may
benchmark indices manage to sustain below 18656 / 5677
resume to their higher degree trend, i.e. bullish. In this
levels. In this scenario, our markets may slide towards 18589
scenario, the up move may get extended towards 19542 -
- 18393 / 5650 - 5583 levels. A breach of 18393 / 5583
19812 / 5850 - 5945 levels. In the broader sense, the near
may reinforce the negative momentum and as a result, we
term trading range has widened to 19138 - 18393 / 5816 -
may witness further correction towards 18194 / 5515, which
5583 levels.
is the 50% Fibonacci Retracement level of the rise from
17250 to 19138 / 5216 to 5815.
1
Daily Technical Report
November 12, 2012
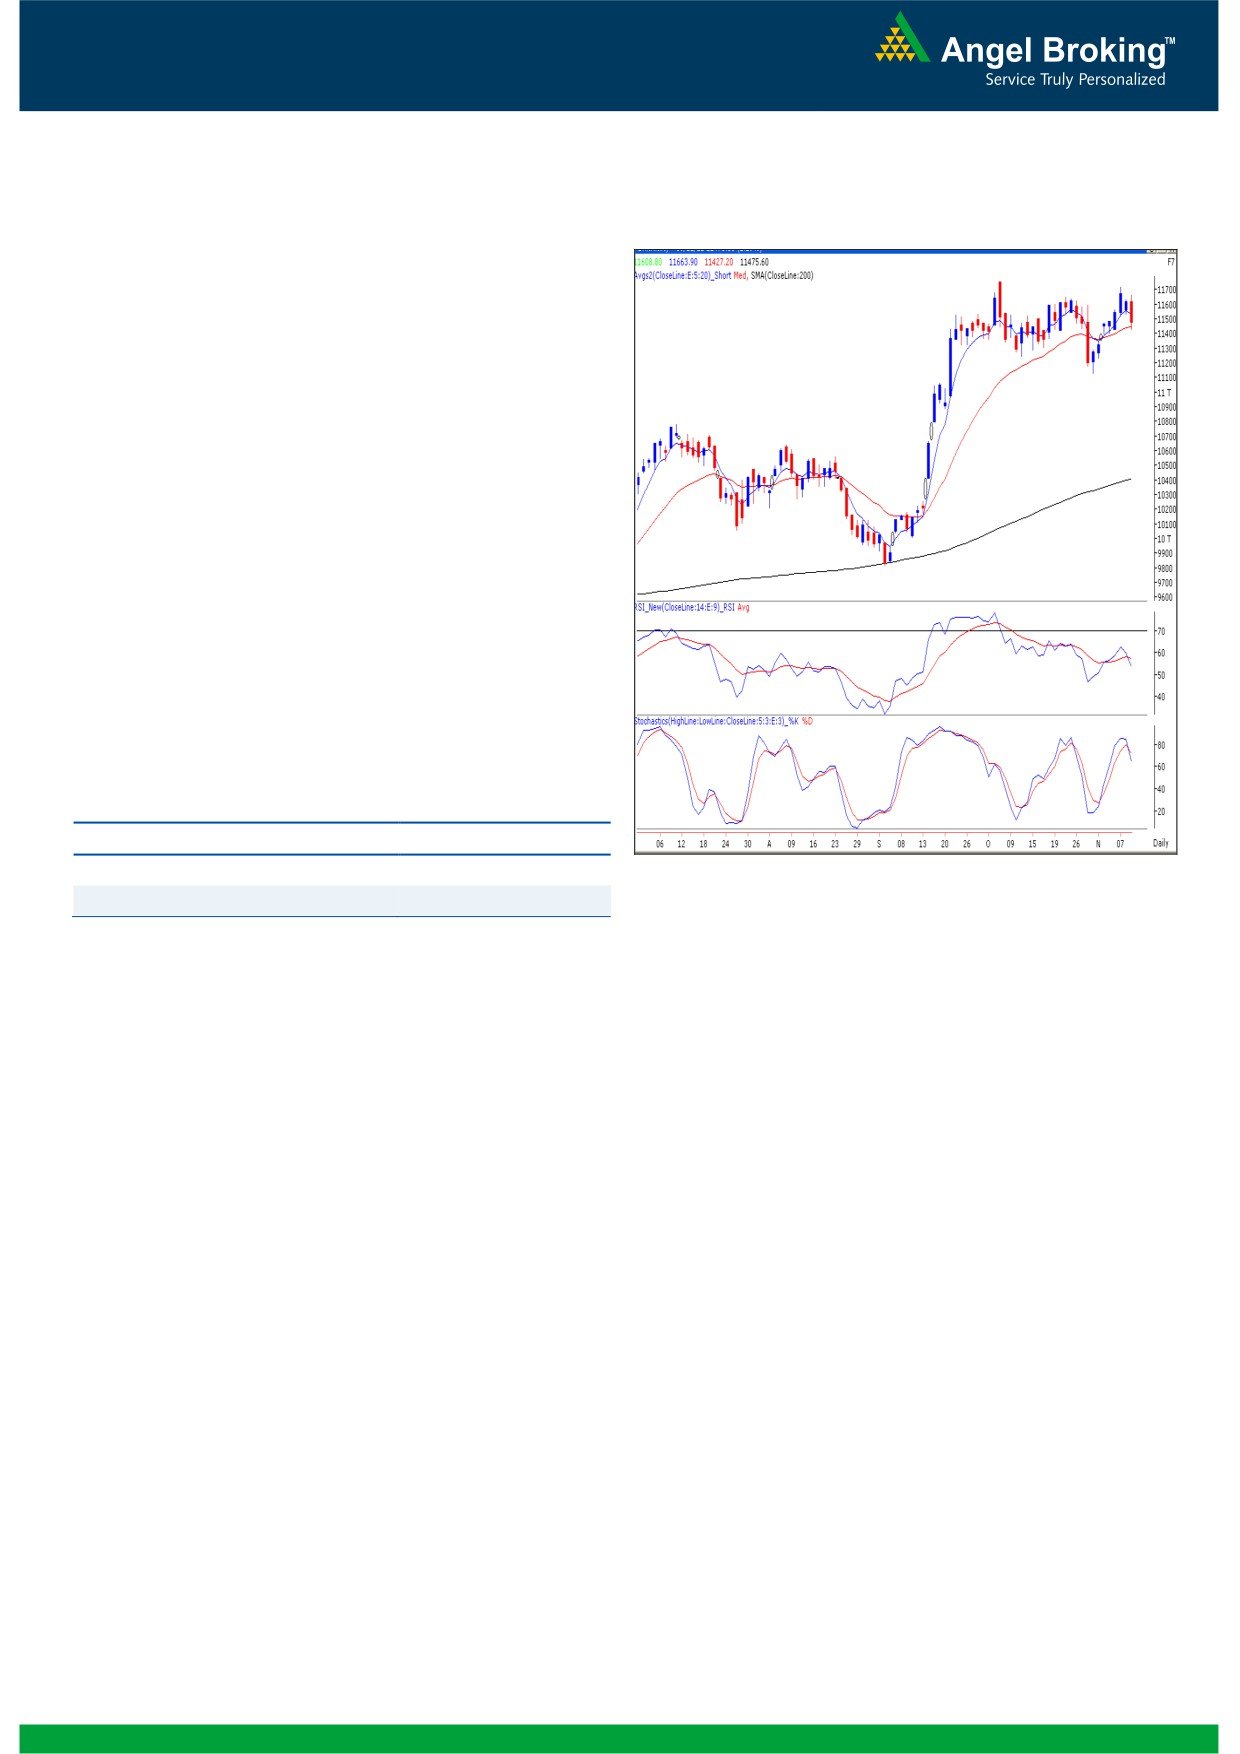
Exhibit 2: Bank Nifty Hourly Chart
Bank Nifty Outlook - (11476)
On Friday, Bank Nifty opened on a flat note and drifted
lower during the second half of the session to close with a
loss of 1.19%. The selling pressure was seen in all the
banking counters post results of the banking heavyweight
SBI. Moreover, on weekly chart the index depicts a narrow
range body formation with a long upper shadow. At this
juncture the index has taken support near to “20 day
EMA”. In addition, we are now witnessing a negative
crossover in “RSI” and “Stochastic” momentum oscillators
on the daily chart. The effect of the mentioned oscillators
would be seen if the index sustains below Friday’s low of
11427. In this scenario the index is likely to drift lower
towards11350 - 11252 levels. For the day 11533 -
11600 levels are likely to act as resistance.
Actionable points:
View for the day
Bearish Below 11427
Expected Targets
11350 - 11252
Source: Falcon:
Resistance Levels
11533 - 11600
2
Daily Technical Report
November 12, 2012
Daily Pivot Levels for Nifty 50 Stocks
SCRIPS
S2
S1
PIVOT
R1
R2
SENSEX
18,507
18,595
18,745
18,833
18,983
NIFTY
5,631
5,659
5,705
5,733
5,779
BANKNIFTY
11,286
11,381
11,522
11,617
11,759
ACC
1,420
1,437
1,460
1,477
1,501
AMBUJACEM
210
212
215
217
220
ASIANPAINT
4,042
4,078
4,136
4,173
4,231
AXISBANK
1,193
1,204
1,219
1,229
1,244
BAJAJ-AUTO
1,821
1,837
1,854
1,870
1,887
BANKBARODA
738
748
760
769
782
BHARTIARTL
272
274
277
279
281
BHEL
226
229
234
237
243
BPCL
332
335
339
342
346
CAIRN
326
328
330
332
334
CIPLA
389
391
394
396
400
COALINDIA
341
344
348
350
354
DLF
205
208
213
216
220
DRREDDY
1,747
1,758
1,774
1,785
1,801
GAIL
348
352
357
360
365
GRASIM
3,315
3,339
3,364
3,388
3,413
HCLTECH
608
611
615
618
621
HDFC
784
789
793
798
803
HDFCBANK
631
635
639
643
647
HEROMOTOCO
1,879
1,893
1,907
1,922
1,936
HINDALCO
111
112
114
115
117
HINDUNILVR
520
525
530
535
541
ICICIBANK
1,040
1,050
1,064
1,073
1,087
IDFC
154
156
160
163
167
INFY
2,333
2,341
2,353
2,361
2,373
ITC
285
286
288
290
292
JINDALSTEL
374
379
384
389
394
JPASSOCIAT
89
90
92
93
95
KOTAKBANK
610
616
624
629
638
LT
1,590
1,606
1,625
1,640
1,659
LUPIN
575
580
584
589
593
M&M
896
903
913
920
931
MARUTI
1,448
1,456
1,465
1,473
1,483
NTPC
163
165
168
169
172
ONGC
250
253
259
263
269
PNB
749
759
772
783
796
POWERGRID
117
118
120
121
122
RANBAXY
531
537
546
552
561
RELIANCE
774
781
792
799
811
RELINFRA
461
466
474
479
488
SBIN
2,069
2,112
2,191
2,234
2,312
SESAGOA
169
171
175
177
180
SIEMENS
670
679
691
699
712
SUNPHARMA
682
688
697
704
713
TATAMOTORS
276
278
281
284
287
TATAPOWER
99
100
102
103
105
TATASTEEL
372
381
395
404
418
TCS
1,314
1,319
1,326
1,332
1,339
ULTRACEMCO
1,986
2,004
2,030
2,048
2,074
WIPRO
364
367
373
376
382
3
Daily Technical Report
November 12, 2012
Research Team Tel: 022 - 39357800
DISCLAIMER
This document is solely for the personal information of the recipient, and must not be singularly used as the basis of any investment
decision. Nothing in this document should be construed as investment or financial advice. Each recipient of this document should make
such investigations as they deem necessary to arrive at an independent evaluation of an investment in the securities of the companies
referred to in this document (including the merits and risks involved), and should consult their own advisors to determine the merits and
risks of such an investment.
Angel Broking Limited, its affiliates, directors, its proprietary trading and investment businesses may, from time to time, make
investment decisions that are inconsistent with or contradictory to the recommendations expressed herein. The views contained in this
document are those of the analyst, and the company may or may not subscribe to all the views expressed within.
Reports based on technical and derivative analysis center on studying charts of a stock's price movement, outstanding positions and
trading volume, as opposed to focusing on a company's fundamentals and, as such, may not match with a report on a company's
fundamentals.
The information in this document has been printed on the basis of publicly available information, internal data and other reliable
sources believed to be true, but we do not represent that it is accurate or complete and it should not be relied on as such, as this
document is for general guidance only. Angel Broking Limited or any of its affiliates/ group companies shall not be in any way
responsible for any loss or damage that may arise to any person from any inadvertent error in the information contained in this report.
Angel Broking Limited has not independently verified all the information contained within this document. Accordingly, we cannot testify,
nor make any representation or warranty, express or implied, to the accuracy, contents or data contained within this document. While
Angel Broking Limited endeavours to update on a reasonable basis the information discussed in this material, there may be regulatory,
compliance, or other reasons that prevent us from doing so.
This document is being supplied to you solely for your information, and its contents, information or data may not be reproduced,
redistributed or passed on, directly or indirectly.
Angel Broking Limited and its affiliates may seek to provide or have engaged in providing corporate finance, investment banking or
other advisory services in a merger or specific transaction to the companies referred to in this report, as on the date of this report or in
the past.
Neither Angel Broking Limited, nor its directors, employees or affiliates shall be liable for any loss or damage that may arise from or in
connection with the use of this information.
Note: Please refer to the important `Stock Holding Disclosure' report on the Angel website (Research Section). Also, please refer to the
latest update on respective stocks for the disclosure status in respect of those stocks. Angel Broking Limited and its affiliates may have
investment positions in the stocks recommended in this report.
Research Team
Shardul Kulkarni
-
Head - Technicals
Sameet Chavan
-
Technical Analyst
Sacchitanand Uttekar
-
Technical Analyst
Mehul Kothari
-
Technical Analyst
Ankur Lakhotia
-
Technical Analyst
Angel Broking Pvt. Ltd.
Registered Office: G-1, Ackruti Trade Centre, Rd. No. 7, MIDC, Andheri (E), Mumbai - 400 093.
Corporate Office: 6th Floor, Ackruti Star, MIDC, Andheri (E), Mumbai - 400 093. Tel: (022) 3952 6600
Sebi Registration No: INB 010996539
4