Daily Technical Report
April 11, 2013
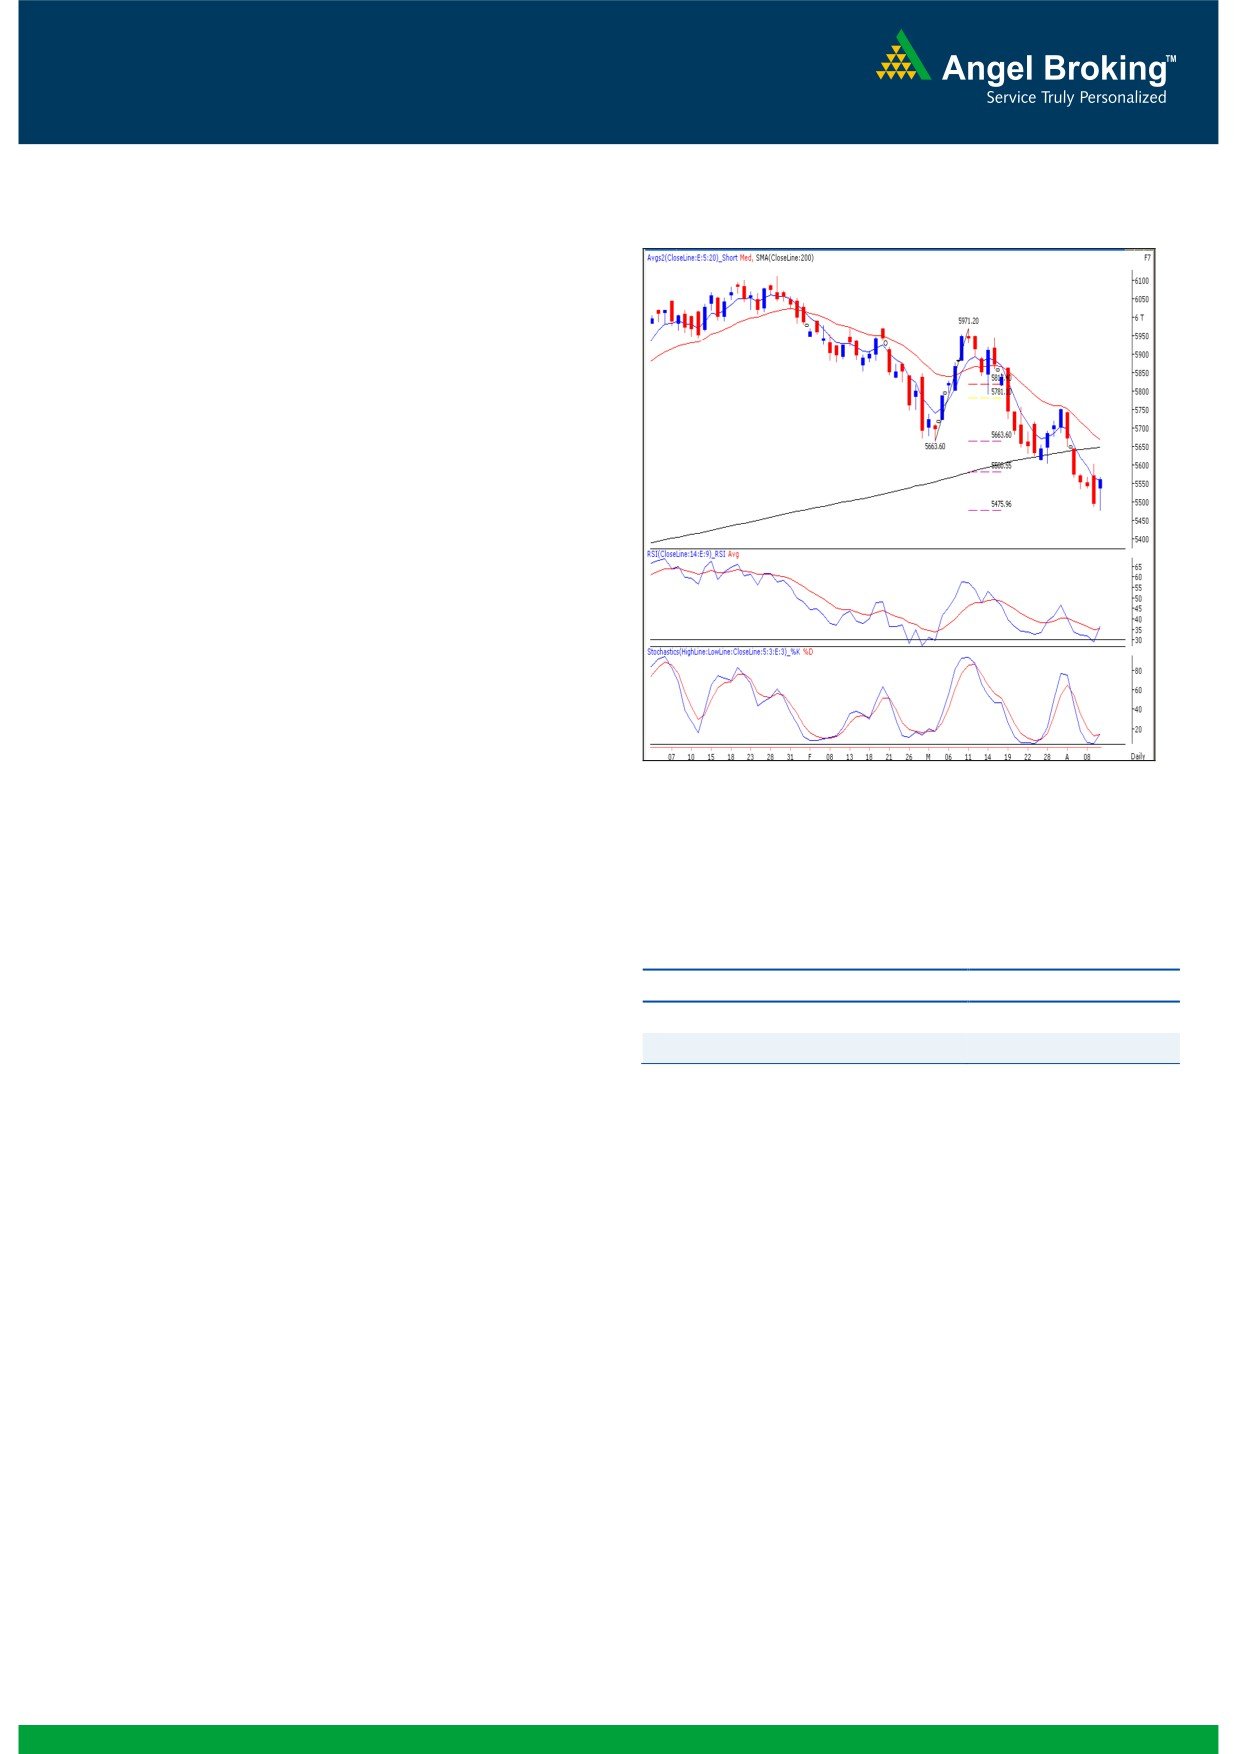
Exhibit 1: Nifty Daily Chart
Sensex (18414) / NIFTY (5559)
Yesterday, indices opened with a decent upside gap in-line
positive global cues but failed to sustain at higher level and
corrected lower in the first half. Post midsession, indices
registered a low of 18173 / 5477 and then bounced back
sharply to close well inside the positive territory. Almost all
the sectors ended on the gaining side except for FMCG
counters which ended with marginal losses. The advance to
decline ratio was in favor of declining counters (A=1154
D=1213)
Formation
The ’20-week EMA’ and the ’20-day EMA’ are placed at
19028 / 5756 and 18790 / 5669 levels, respectively.
The ’89-week EMA’ and ‘200 Day SMA’ are placed at
18200 / 5500 and 18626 / 5647, respectively.
Source: Falcon:
The ‘Lower Top Lower Bottom’ formation on weekly
chart is still intact.
Actionable points:
Trading strategy:
Despite positive opening, the first half of yesterday’s session
View
Bullish Above 5569
was dominated by the bears. In the process, indices slipped
Expected Targets
5605 - 5650
nearly 1% lower to register a low of 18173 / 5477. This level
Support levels
5477
precisely coincides with the 161.8% Fibonacci retracement
level of the rise from 18760 / 5663 (low on March 04,
2013) to 19755 / 5971(high on March 11, 2013). This
161.8% ratio is considered as a ‘Golden Ratio’ and hence,
accordingly provided strong support for the market during
yesterday’s session. The daily chart now depicts a ‘Bullish
Hammer’ Japanese candlestick pattern. This is a bullish
pattern and requires confirmation in the form of a close
above yesterday’s high of 18462 / 5569. This is also
supported by the positive crossover in daily momentum
oscillators. Hence, a move beyond 18462 / 5569 may
attract significant buying interest among participants. In this
scenario, indices may bounce towards 18562 - 18630 /
5605 - 5650 levels. On the flipside, yesterday’s low of
18173 / 5477 would act as a key support in coming trading
session.
1
Daily Technical Report
April 11, 2013
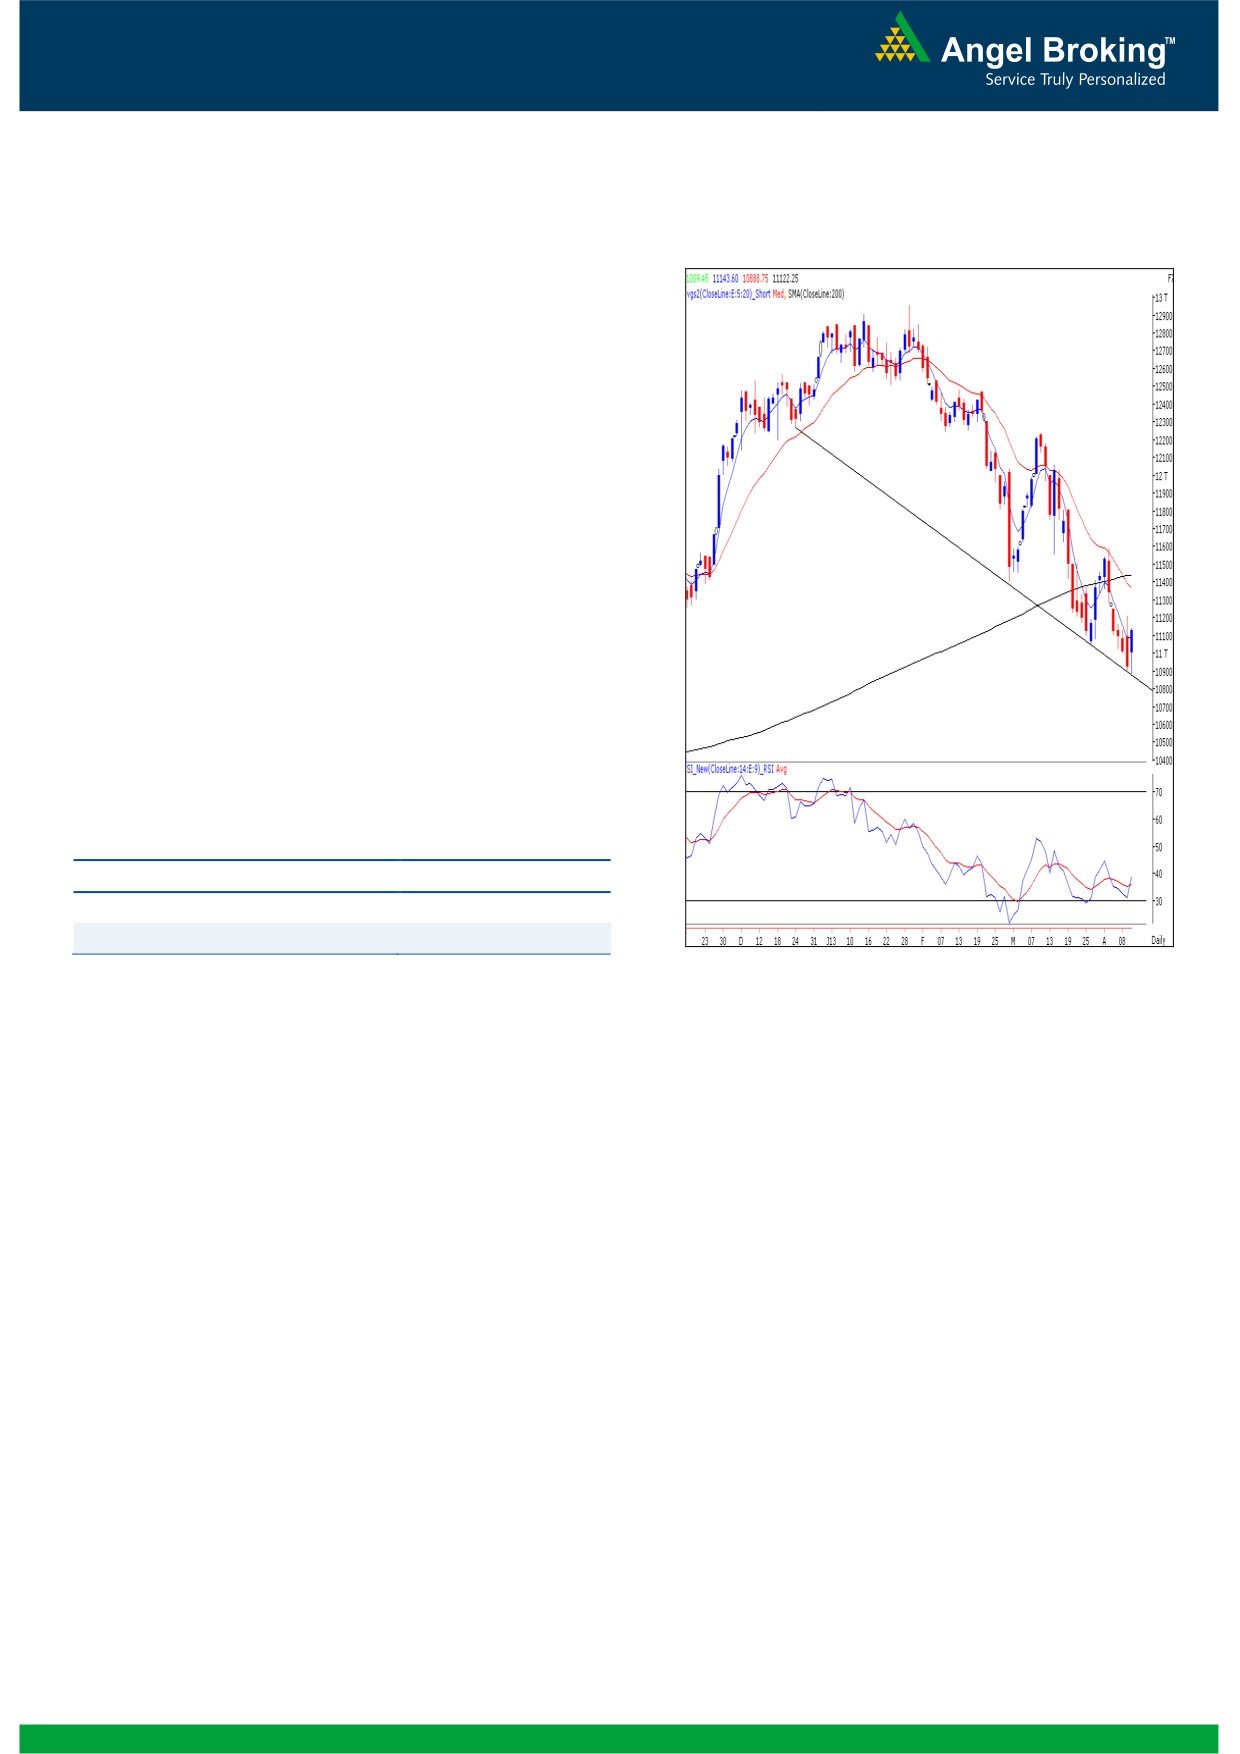
Exhibit 2: Bank Nifty Daily Chart
Bank Nifty Outlook - (11122)
Yesterday, Bank Nifty opened on a positive note in line
with our benchmark indices and found support at the
trend line formed by joining the lows of December 24,
2012 and February 28, 2012 during the initial hour of
trade. However, buying interest near this support trend
line led the index to close in the positive territory. We had
mentioned in our previous that the 'RSI' momentum
oscillator on the daily and hourly chart is showing positive
divergence. Now we are witnessing positive crossover in
'RSI' momentum oscillator on the daily chart. The effect of
this technical this technical tool would be seen if the index
sustains above yesterday's high of 11144. In this scenario
the index is likely to rally towards 11250 - 11365. On the
downside yesterday’s low of 10888 is likely to act as
support for the day.
Actionable points:
View
Bullish Above 11444
Expected Target
11250 - 11365
Support Levels
10888
Source: Falcon:
2
Daily Technical Report
April 11, 2013
Research Team Tel: 022 - 30940000
DISCLAIMER
This document is solely for the personal information of the recipient, and must not be singularly used as the basis of any investment
decision. Nothing in this document should be construed as investment or financial advice. Each recipient of this document should make
such investigations as they deem necessary to arrive at an independent evaluation of an investment in the securities of the companies
referred to in this document (including the merits and risks involved), and should consult their own advisors to determine the merits and
risks of such an investment.
Angel Broking Limited, its affiliates, directors, its proprietary trading and investment businesses may, from time to time, make
investment decisions that are inconsistent with or contradictory to the recommendations expressed herein. The views contained in this
document are those of the analyst, and the company may or may not subscribe to all the views expressed within.
Reports based on technical and derivative analysis center on studying charts of a stock's price movement, outstanding positions and
trading volume, as opposed to focusing on a company's fundamentals and, as such, may not match with a report on a company's
fundamentals.
The information in this document has been printed on the basis of publicly available information, internal data and other reliable
sources believed to be true, but we do not represent that it is accurate or complete and it should not be relied on as such, as this
document is for general guidance only. Angel Broking Limited or any of its affiliates/ group companies shall not be in any way
responsible for any loss or damage that may arise to any person from any inadvertent error in the information contained in this report.
Angel Broking Limited has not independently verified all the information contained within this document. Accordingly, we cannot testify,
nor make any representation or warranty, express or implied, to the accuracy, contents or data contained within this document. While
Angel Broking Limited endeavors to update on a reasonable basis the information discussed in this material, there may be regulatory,
compliance, or other reasons that prevent us from doing so.
This document is being supplied to you solely for your information, and its contents, information or data may not be reproduced,
redistributed or passed on, directly or indirectly.
Angel Broking Limited and its affiliates may seek to provide or have engaged in providing corporate finance, investment banking or
other advisory services in a merger or specific transaction to the companies referred to in this report, as on the date of this report or in
the past.
Neither Angel Broking Limited, nor its directors, employees or affiliates shall be liable for any loss or damage that may arise from or in
connection with the use of this information.
Note: Please refer to the important `Stock Holding Disclosure' report on the Angel website (Research Section). Also, please refer to the
latest update on respective stocks for the disclosure status in respect of those stocks. Angel Broking Limited and its affiliates may have
investment positions in the stocks recommended in this report.
Research Team
Shardul Kulkarni
-
Head - Technicals
Sameet Chavan
-
Technical Analyst
Sacchitanand Uttekar
-
Technical Analyst
Ankur Lakhotia
-
Technical Analyst
Angel Broking Pvt. Ltd.
Registered Office: G-1, Ackruti Trade Centre, Rd. No. 7, MIDC, Andheri (E), Mumbai - 400 093.
Corporate Office: 6th Floor, Ackruti Star, MIDC, Andheri (E), Mumbai - 400 093. Tel: (022) 30940000
Sebi Registration No: INB 010996539
4