Daily Technical Report
March 11, 2013
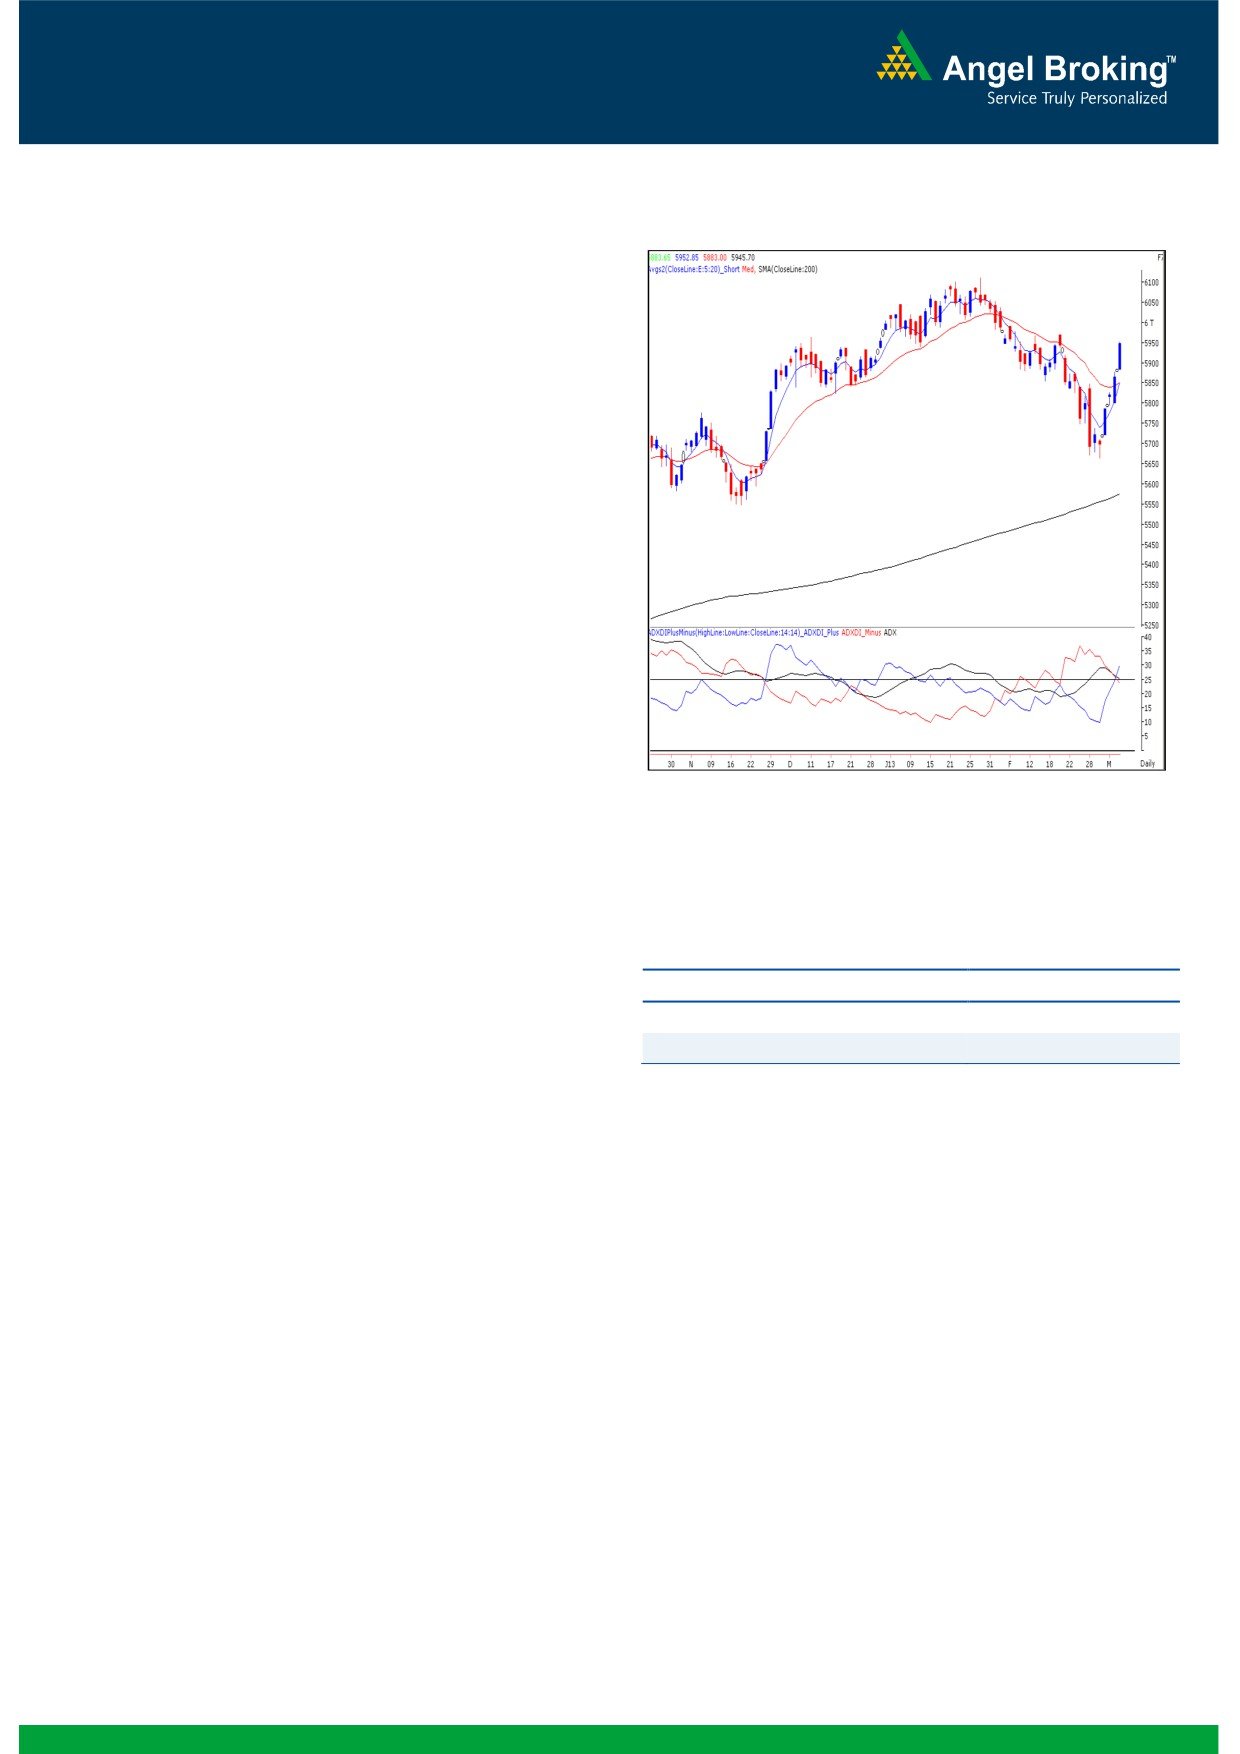
Exhibit 1: Nifty Daily Chart
Sensex (19683) / NIFTY (5946)
On Friday, indices opened on with an upside gap in line with
other global indices and traded in a narrow range during
first half of the session. However, buying interest during the
second half led the index to close near day’s high. During
the day, most of the sectors ended on the gaining side except
for IT and Teck which ended on a losing side. The advance
to decline ratio was in favor of advancing counters (A=1734
Formation
The ’20-day EMA’ and the ’20-week EMA’ are placed at
19348 / 5850 and 19224 / 5826 levels, respectively.
The weekly chart exhibits a ‘Bullish Engulfing’ pattern but
the monthly chart exhibits a ‘Bearish Engulfing’ pattern.
The daily ‘ADX
(14)’ indicator and the weekly
Source: Falcon:
‘Stochastic’ momentum oscillator is now signaling a
positive crossover.
The level of the weekly ‘RSI’ momentum oscillator has
now bounced back sharply to 58.20 after dropping
Actionable points:
below the 50 mark.
Indices have closed above the ‘Downward Sloping Trend
View
Neutral
Line’, drawn by joining two significant highs of 21109 /
Resistance Levels
5971 - 5991
6339 (high of November 05, 2010 weekly candle) and
Support levels
5883
19137 / 5816 (high of October 05, 2012 weekly
candle).
This bullish pattern is now supported
by the positive
crossover in the daily ‘ADX (14)’ indicator and the weekly
‘Stochastic’ oscillator. Also, last week we had mentioned that
Trading strategy:
the weekly ‘RSI’ momentum oscillator has moved below the
Indices have now finally broken the losing streak after six
50 mark. Nevertheless, this week it has managed to jump
consecutive red candles. The market movement over the last
back convincingly to close above the 58 level. This indicates
two weeks can be described as a tug of war between the
possibility of a further upside move if indices sustain above
bulls and the bears. Indices could not sustain below the
19706 / 5953. In this scenario, the markets may rally
weekly low and bounced back sharply to nullify the impact of
towards 19768 - 19865 / 5991 - 6025 or even re-test the
previously mentioned negative technical evidences. This
recent swing high of 20204 / 6112. On the flipside, the ’89-
intra-week rally has resulted in formation of a ‘Bullish
day EMA’ and the ’20-day EMA’ would now provide decent
Engulfing’ pattern on the weekly chart. As mentioned in our
support to the markets. These are placed at 19250 / 5830
previous report, it can be now concluded that indices have
and 19348 / 5850, respectively. A sustainable move below
precisely taken a support at the ‘Downward Sloping Trend
19195 / 5795 would once again trigger pessimism in the
Line’ (please refer exhibit 1).
market.
1
Daily Technical Report
March 11, 2013
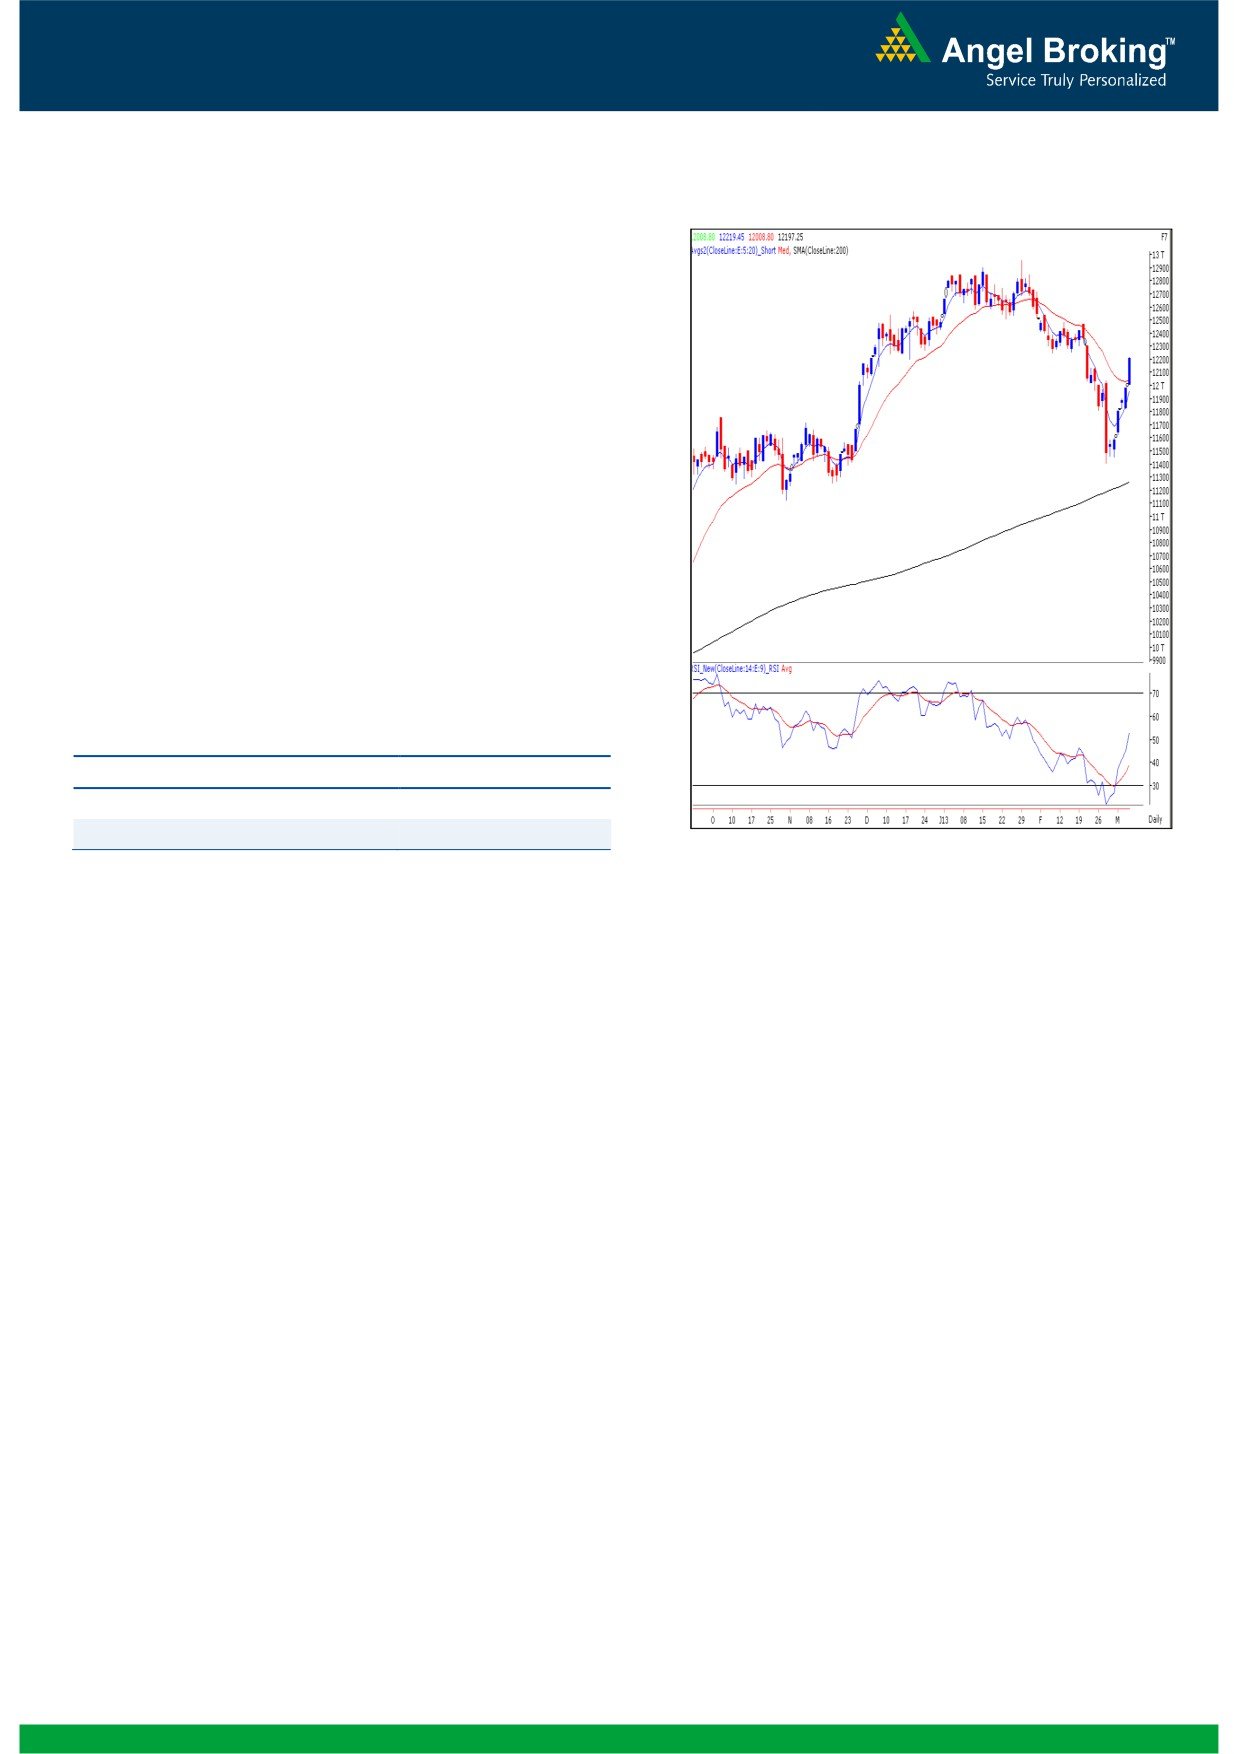
Exhibit 2: Bank Nifty Daily Chart
Bank Nifty Outlook - (12197)
On Friday, Bank Nifty opened with an upside gap and
gained strength as the day progressed to close near the
highest point of the day. At this juncture we are witnessing
a ‘Bullish Engulfing’ candle stick pattern on the weekly
chart which is a bullish reversal pattern. In addition the
momentum oscillators on the daily and weekly chart are
positively poised indicating the possibility of further upside
in coming weeks. However, looking at the extreme
overbought conditions on momentum oscillators on the
hourly chart some consolidation or a minor pullback in the
index cannot be ruled out. On the upside 12301 - 12350
levels are likely to act as resistance and 12040 - 12000
levels are likely to act as support for the day.
Actionable points:
View
Neutral
Resistance levels
12301 - 12350
Support Levels
12040 - 12000
Source: Falcon:
2
Daily Technical Report
March 11, 2013
Daily Pivot Levels for Nifty 50 Stocks
SCRIPS
S2
S1
PIVOT
R1
R2
SENSEX
19,394
19,539
19,622
19,767
19,851
NIFTY
5,857
5,902
5,927
5,971
5,997
BANKNIFTY
11,931
12,064
12,142
12,275
12,352
ACC
1,244
1,254
1,265
1,275
1,287
AMBUJACEM
184
185
189
191
194
ASIANPAINT
4,553
4,610
4,649
4,706
4,745
AXISBANK
1,394
1,400
1,409
1,416
1,425
BAJAJ-AUTO
1,954
1,984
2,003
2,033
2,052
BANKBARODA
719
726
731
737
743
BHARTIARTL
318
320
323
326
329
BHEL
204
206
207
209
210
BPCL
384
395
402
412
419
CAIRN
297
301
304
308
311
CIPLA
384
388
390
394
397
COALINDIA
310
315
319
325
328
DLF
269
274
278
283
287
DRREDDY
1,763
1,791
1,810
1,838
1,858
GAIL
329
335
339
345
349
GRASIM
2,991
3,010
3,030
3,049
3,069
HCLTECH
759
766
775
782
790
HDFC
776
794
805
824
835
HDFCBANK
637
647
654
664
670
HEROMOTOCO
1,690
1,717
1,742
1,768
1,793
HINDALCO
98
100
101
103
104
HINDUNILVR
430
434
437
441
443
ICICIBANK
1,110
1,125
1,134
1,148
1,157
IDFC
152
156
159
163
165
INFY
2,940
2,955
2,972
2,987
3,004
ITC
290
294
296
300
303
JINDALSTEL
342
355
362
375
382
JPASSOCIAT
74
76
77
79
80
KOTAKBANK
640
658
668
686
696
LT
1,440
1,469
1,489
1,518
1,538
LUPIN
588
596
601
609
614
M&M
884
894
900
911
917
MARUTI
1,382
1,405
1,440
1,463
1,498
NTPC
143
146
148
151
154
ONGC
318
322
325
329
332
PNB
800
807
813
820
826
POWERGRID
107
109
109
111
112
RANBAXY
393
398
402
407
412
RELIANCE
834
843
849
857
863
RELINFRA
421
427
432
438
443
SBIN
2,159
2,184
2,202
2,227
2,244
SESAGOA
162
164
167
169
172
SIEMENS
504
518
527
542
551
SUNPHARMA
807
812
818
823
829
TATAMOTORS
297
300
304
308
311
TATAPOWER
97
98
99
99
100
TATASTEEL
348
354
358
363
367
TCS
1,564
1,573
1,585
1,594
1,605
ULTRACEMCO
1,852
1,876
1,898
1,922
1,943
WIPRO
437
441
449
453
460
3
Daily Technical Report
March 11, 2013
Research Team Tel: 022 - 30940000
DISCLAIMER
This document is solely for the personal information of the recipient, and must not be singularly used as the basis of any investment
decision. Nothing in this document should be construed as investment or financial advice. Each recipient of this document should make
such investigations as they deem necessary to arrive at an independent evaluation of an investment in the securities of the companies
referred to in this document (including the merits and risks involved), and should consult their own advisors to determine the merits and
risks of such an investment.
Angel Broking Limited, its affiliates, directors, its proprietary trading and investment businesses may, from time to time, make
investment decisions that are inconsistent with or contradictory to the recommendations expressed herein. The views contained in this
document are those of the analyst, and the company may or may not subscribe to all the views expressed within.
Reports based on technical and derivative analysis center on studying charts of a stock's price movement, outstanding positions and
trading volume, as opposed to focusing on a company's fundamentals and, as such, may not match with a report on a company's
fundamentals.
The information in this document has been printed on the basis of publicly available information, internal data and other reliable
sources believed to be true, but we do not represent that it is accurate or complete and it should not be relied on as such, as this
document is for general guidance only. Angel Broking Limited or any of its affiliates/ group companies shall not be in any way
responsible for any loss or damage that may arise to any person from any inadvertent error in the information contained in this report.
Angel Broking Limited has not independently verified all the information contained within this document. Accordingly, we cannot testify,
nor make any representation or warranty, express or implied, to the accuracy, contents or data contained within this document. While
Angel Broking Limited endeavours to update on a reasonable basis the information discussed in this material, there may be regulatory,
compliance, or other reasons that prevent us from doing so.
This document is being supplied to you solely for your information, and its contents, information or data may not be reproduced,
redistributed or passed on, directly or indirectly.
Angel Broking Limited and its affiliates may seek to provide or have engaged in providing corporate finance, investment banking or
other advisory services in a merger or specific transaction to the companies referred to in this report, as on the date of this report or in
the past.
Neither Angel Broking Limited, nor its directors, employees or affiliates shall be liable for any loss or damage that may arise from or in
connection with the use of this information.
Note: Please refer to the important `Stock Holding Disclosure' report on the Angel website (Research Section). Also, please refer to the
latest update on respective stocks for the disclosure status in respect of those stocks. Angel Broking Limited and its affiliates may have
investment positions in the stocks recommended in this report.
Research Team
Shardul Kulkarni
-
Head - Technicals
Sameet Chavan
-
Technical Analyst
Sacchitanand Uttekar
-
Technical Analyst
Ankur Lakhotia
-
Technical Analyst
Angel Broking Pvt. Ltd.
Registered Office: G-1, Ackruti Trade Centre, Rd. No. 7, MIDC, Andheri (E), Mumbai - 400 093.
Corporate Office: 6th Floor, Ackruti Star, MIDC, Andheri (E), Mumbai - 400 093. Tel: (022) 30940000
Sebi Registration No: INB 010996539
4