Daily Technical Report
February 11, 2013
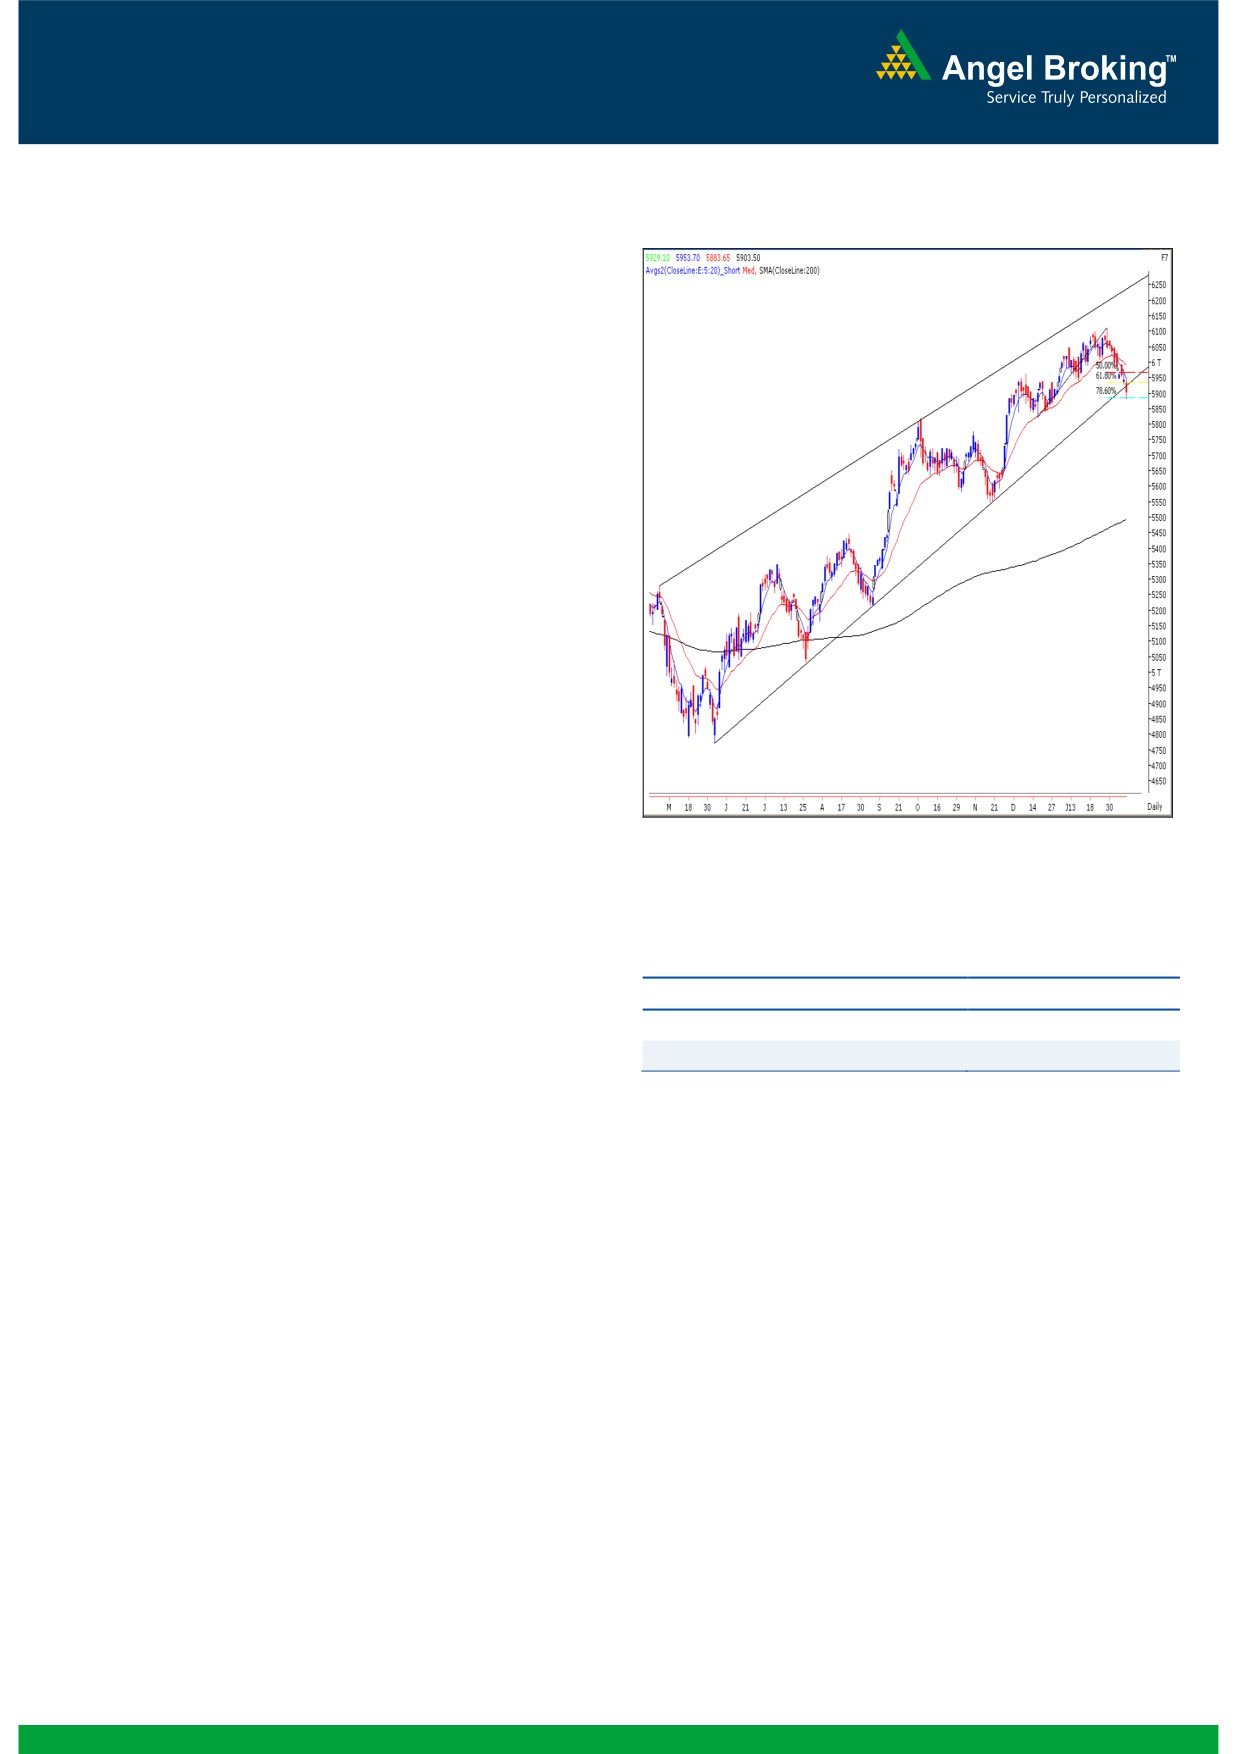
Exhibit 1: Nifty Daily Chart
Sensex (19485) / NIFTY (5904)
On Friday, in line with our expectations, markets traded with
a negative bias and benchmark indices breached the
psychological levels of 19500 / 5900 to close near the day’s
low. Metal, PSU and Realty counters contributed heavily in
the fall. However, IT, Teck and Capital Goods counters
counters provided descent support to the markets. The
advance to decline ratio was strongly in favor of declining
Formation
The ’20-day EMA’ and the ’20-week EMA’ are placed at
19768 / 5990 and 19160 / 5813 levels, respectively.
The Nifty has broken down from the ‘Upward Sloping
Channel’ (as shown in the chart).
The weekly ‘RSI Smoothened’ is now signaling a
negative crossover.
Source: Falcon:
The ‘Hanging Man’ Japanese Candlestick pattern on the
weekly chart is intact.
Actionable points:
Trading strategy:
View
Bearish Below 5883
In-line with our expectations, markets experienced strong
Expected Targets
5842 - 5800
negative momentum throughout the week. During the week,
Resistance Levels
5953 - 5979
indices precisely met with the mentioned targets of 19596 -
19406 / 5940 - 5897. The news flow continued to be
Considering the Channel pattern breakdown and negative
negative during the week as the Government lowered the
placement of weekly momentum oscillators, we can infer that
GDP growth projections to the lowest level in a decade. The
indices may experience a severe correction in the coming
sharp fall during the last half an hour on Friday has now
week if they manage to sustain below this week’s low of
confirmed a breakdown of the ‘Upward Sloping Channel’ on
19414 / 5883. In this scenario, we may witness a corrective
the daily chart. (Please refer exhibit 2). Please note that the
move towards 19000 - 18870 / 5800 - 5735 levels. On the
Sensex has not yet confirmed a breakdown of the ‘Upward
flipside, 19648 - 19768 / 5953 - 5991 levels would act as
Sloping Channel’ pattern. Also Indices have now precisely
strong resistance for our benchmark indices.
tested 78.6% Fibonacci retracement level of the rise from
19149 / 5823 (low on December 18, 2012) to 20204 /
6112 (high on January 29, 2013).
1
Daily Technical Report
February 11, 2013
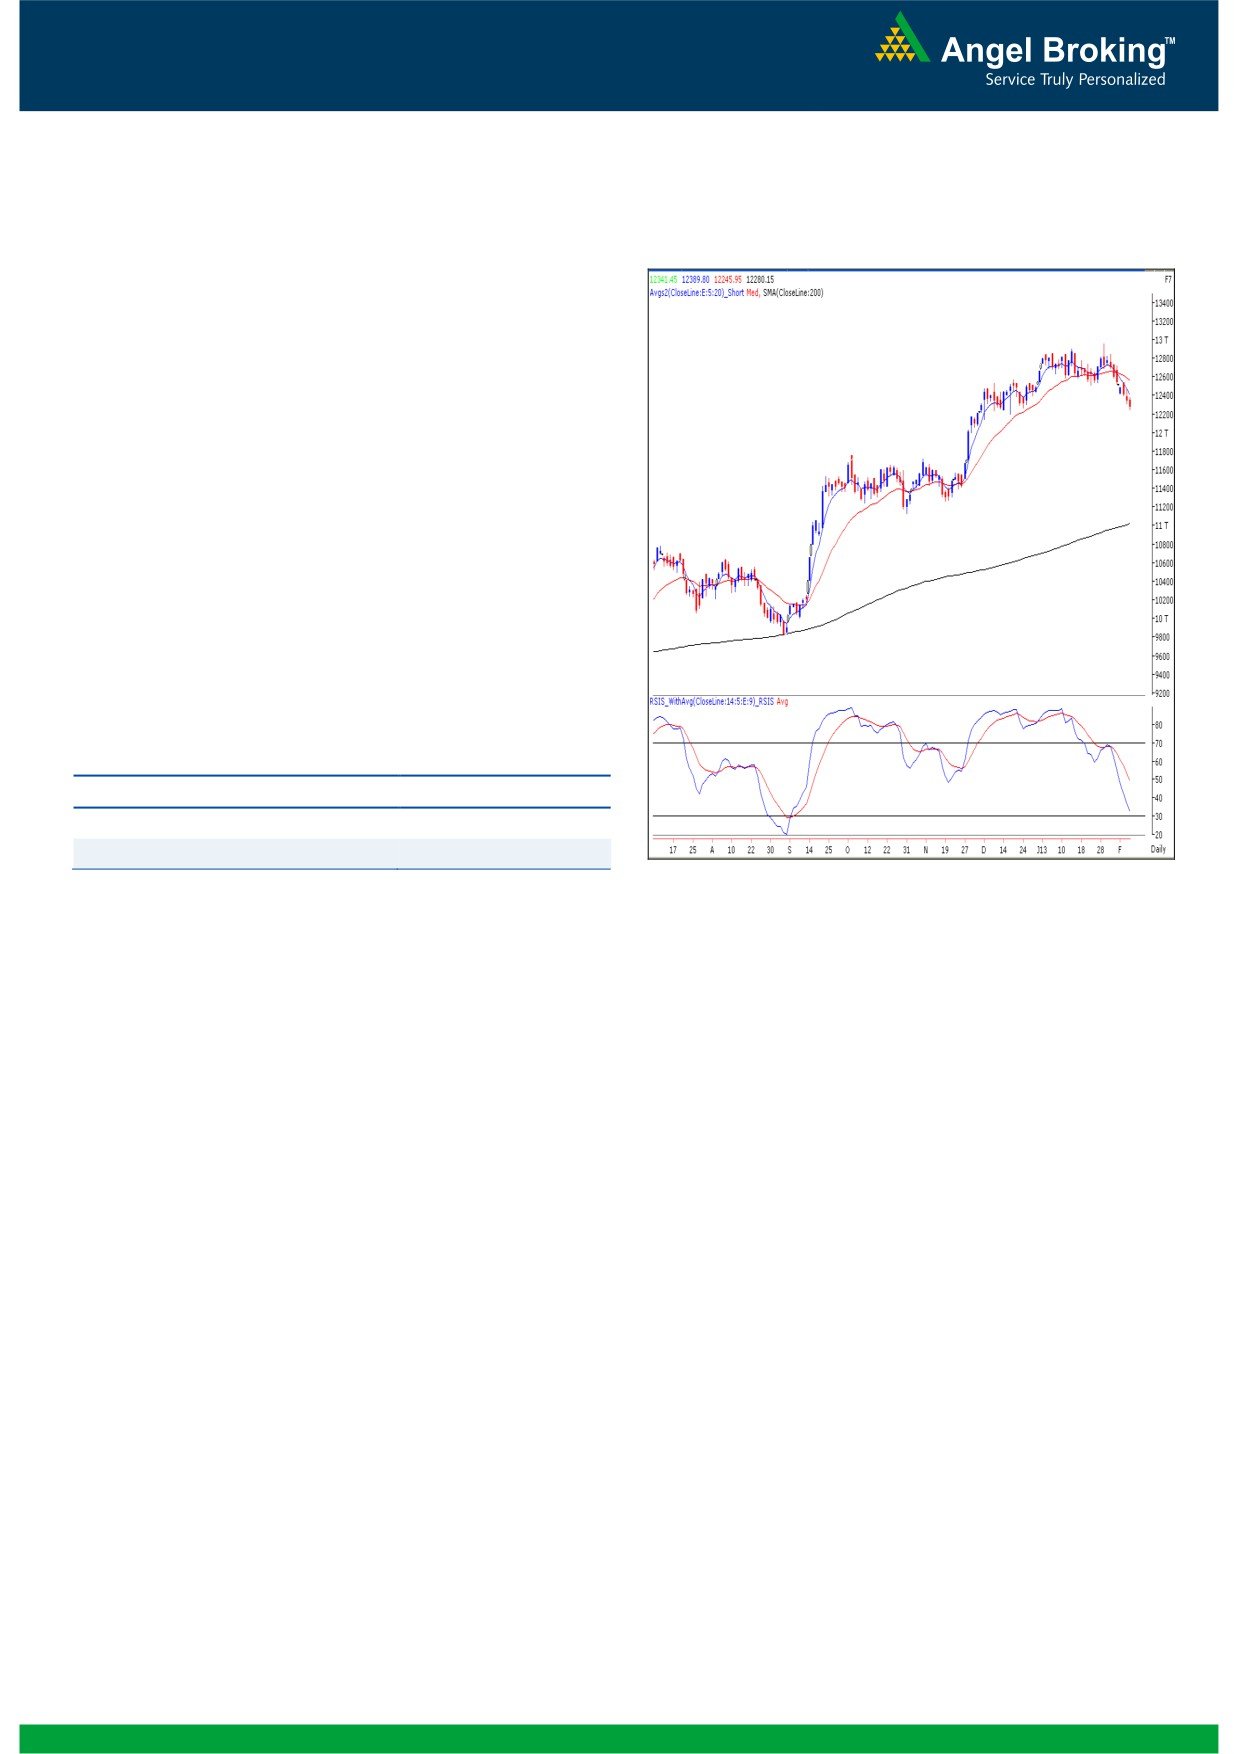
Exhibit 2: Bank Nifty Daily Chart
Bank Nifty Outlook - (12280)
On Friday, Bank Nifty opened on a flat note and traded in a
narrow range during major part of the session. However,
during the last hour of trade selling pressure in banking
heavyweights like ICICI bank and SBI lead the index to close
with a loss of 0.56%. The momentum oscillators on the daily
and weekly chart are negatively poised. However, positive
divergence in “RSI” momentum oscillator on the hourly chart
mentioned in our previous report is still intact. Hence,
although the primary bias remains negative, the possibility of
bounce back or sideways consolidation in the index cannot
be ruled out. On the upside 12390 - 12475 levels are likely
to act as resistance and 12230 - 12197 levels may act as
support in the coming trading session.
Actionable points:
View
Neutral
Resistance Levels
12390 - 12475
Support Levels
12230 - 12197
Source: Falcon:
2
Daily Technical Report
February 11, 2013
Daily Pivot Levels for Nifty 50 Stocks
SCRIPS
S2
S1
PIVOT
R1
R2
SENSEX
19,283
19,384
19,516
19,617
19,749
NIFTY
5,844
5,874
5,914
5,944
5,984
BANKNIFTY
12,161
12,221
12,305
12,365
12,449
ACC
1,271
1,287
1,311
1,327
1,351
AMBUJACEM
183
186
191
195
199
ASIANPAINT
4,432
4,478
4,557
4,603
4,683
AXISBANK
1,430
1,441
1,456
1,466
1,481
BAJAJ-AUTO
2,004
2,025
2,060
2,081
2,115
BANKBARODA
754
761
770
777
786
BHARTIARTL
313
318
321
326
329
BHEL
202
205
208
212
215
BPCL
393
397
404
409
416
CAIRN
308
311
317
320
326
CIPLA
370
375
384
390
399
COALINDIA
327
333
339
345
351
DLF
265
267
270
272
275
DRREDDY
1,815
1,835
1,868
1,888
1,920
GAIL
331
333
335
338
340
GRASIM
2,946
2,979
3,024
3,057
3,102
HCLTECH
661
666
671
676
681
HDFC
796
802
812
818
827
HDFCBANK
635
643
648
655
661
HEROMOTOCO
1,675
1,697
1,730
1,753
1,786
HINDALCO
105
108
111
113
116
HINDUNILVR
445
449
453
457
461
ICICIBANK
1,110
1,120
1,135
1,145
1,160
IDFC
158
160
162
164
166
INFY
2,748
2,769
2,793
2,813
2,837
ITC
295
299
302
306
310
JINDALSTEL
403
409
416
421
429
JPASSOCIAT
72
72
73
74
75
KOTAKBANK
666
672
681
687
695
LT
1,472
1,492
1,509
1,529
1,546
LUPIN
588
593
597
601
605
M&M
859
872
889
902
919
MARUTI
1,544
1,566
1,599
1,621
1,654
NTPC
144
146
148
150
153
ONGC
304
309
315
320
326
PNB
845
854
868
877
891
POWERGRID
109
110
112
113
114
RANBAXY
419
424
432
436
444
RELIANCE
848
856
865
873
882
RELINFRA
474
481
491
498
508
SBIN
2,235
2,261
2,302
2,327
2,369
SESAGOA
164
167
171
174
178
SIEMENS
608
612
618
622
629
SUNPHARMA
732
739
749
756
765
TATAMOTORS
278
282
288
292
299
TATAPOWER
95
96
97
98
99
TATASTEEL
380
384
389
393
398
TCS
1,363
1,393
1,415
1,445
1,467
ULTRACEMCO
1,821
1,853
1,898
1,930
1,975
WIPRO
398
405
410
418
423
3
Daily Technical Report
February 11, 2013
Research Team Tel: 022 - 30940000
DISCLAIMER
This document is solely for the personal information of the recipient, and must not be singularly used as the basis of any investment
decision. Nothing in this document should be construed as investment or financial advice. Each recipient of this document should make
such investigations as they deem necessary to arrive at an independent evaluation of an investment in the securities of the companies
referred to in this document (including the merits and risks involved), and should consult their own advisors to determine the merits and
risks of such an investment.
Angel Broking Limited, its affiliates, directors, its proprietary trading and investment businesses may, from time to time, make
investment decisions that are inconsistent with or contradictory to the recommendations expressed herein. The views contained in this
document are those of the analyst, and the company may or may not subscribe to all the views expressed within.
Reports based on technical and derivative analysis center on studying charts of a stock's price movement, outstanding positions and
trading volume, as opposed to focusing on a company's fundamentals and, as such, may not match with a report on a company's
fundamentals.
The information in this document has been printed on the basis of publicly available information, internal data and other reliable
sources believed to be true, but we do not represent that it is accurate or complete and it should not be relied on as such, as this
document is for general guidance only. Angel Broking Limited or any of its affiliates/ group companies shall not be in any way
responsible for any loss or damage that may arise to any person from any inadvertent error in the information contained in this report.
Angel Broking Limited has not independently verified all the information contained within this document. Accordingly, we cannot testify,
nor make any representation or warranty, express or implied, to the accuracy, contents or data contained within this document. While
Angel Broking Limited endeavours to update on a reasonable basis the information discussed in this material, there may be regulatory,
compliance, or other reasons that prevent us from doing so.
This document is being supplied to you solely for your information, and its contents, information or data may not be reproduced,
redistributed or passed on, directly or indirectly.
Angel Broking Limited and its affiliates may seek to provide or have engaged in providing corporate finance, investment banking or
other advisory services in a merger or specific transaction to the companies referred to in this report, as on the date of this report or in
the past.
Neither Angel Broking Limited, nor its directors, employees or affiliates shall be liable for any loss or damage that may arise from or in
connection with the use of this information.
Note: Please refer to the important `Stock Holding Disclosure' report on the Angel website (Research Section). Also, please refer to the
latest update on respective stocks for the disclosure status in respect of those stocks. Angel Broking Limited and its affiliates may have
investment positions in the stocks recommended in this report.
Research Team
Shardul Kulkarni
-
Head - Technicals
Sameet Chavan
-
Technical Analyst
Sacchitanand Uttekar
-
Technical Analyst
Mehul Kothari
-
Technical Analyst
Ankur Lakhotia
-
Technical Analyst
Angel Broking Pvt. Ltd.
Registered Office: G-1, Ackruti Trade Centre, Rd. No. 7, MIDC, Andheri (E), Mumbai - 400 093.
Corporate Office: 6th Floor, Ackruti Star, MIDC, Andheri (E), Mumbai - 400 093. Tel: (022) 30940000
Sebi Registration No: INB 010996539
4