Daily Technical Report
September 10, 2012
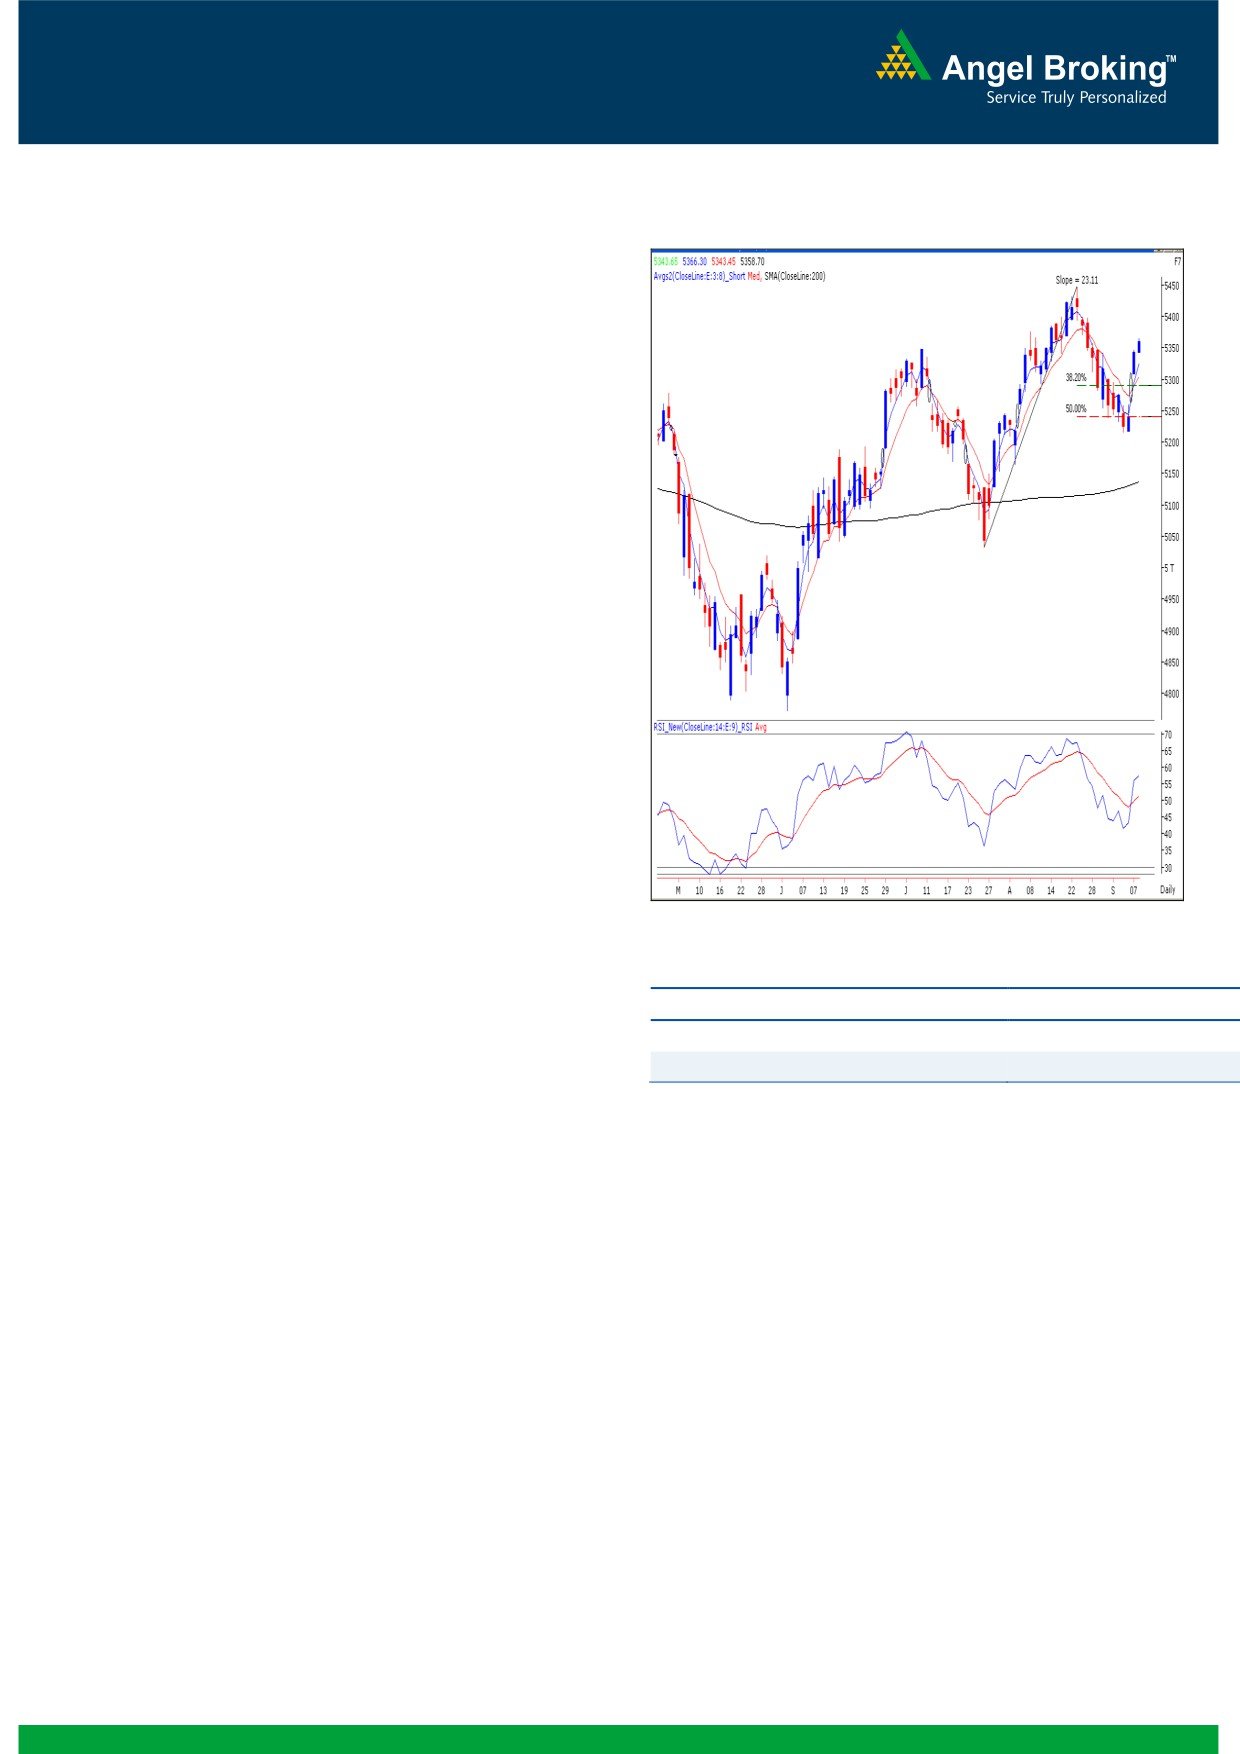
Exhibit 1: Nifty Daily Chart
Sensex (17750) / NIFTY (5359)
On Friday, we witnessed a gap up opening in our markets
due to European Central Bank chairman Mario Draghi's
unlimited bond buying programme. The positive momentum
intensified as the day progressed which led our indices to
close near day’s high. On sectoral front, all the sctors
contributed to Friday’s gain, however Consumer Goods,
Realty and Metal counters were among the major gainers.
The advance to decline ratio was in strongly favor of
advancing counters (A=1782 D=1080) (Source
-
Formation
The ’20-day EMA’ and the ’20-week EMA’ are placed at
17508 / 5298 and 17254 / 5226 levels, respectively.
Looking at the “Line Chart” it is clear that indices have
now confirmed the ‘Higher Top
- Higher Bottom’
formation on the weekly chart after August 28, 2009.
The daily ‘RSI’ momentum oscillator and ‘3 & 8 EMA’
have given a positive crossover.
Source: Falcon:
The 50% Fibonacci Retracement level of the rise from
16598 to 17973 / 5032 to 5449 is at 17285 / 5240.
Actionable points:
View
Bullish above 5366
Expected Target Levels
5400 - 5449
Trading strategy:
Support Levels
5343 - 5309
The strong overnight rally from European as well as US
markets influenced the shift in trader’s sentiments across the
globe. As a result, we witnessed a massive intraday rally on
Friday’s session. The last week’s low of 17250 / 5217 almost
coincides with the 50% Fibonacci Retracement level of the
rise from 16598 to 17973 / 5032 to 5449. Hence, this level
would act as a key support for our markets. The ‘RSI’
momentum oscillator and ‘3 & 8 EMA’ on daily chart are
signaling a positive crossover. This indicates a high
probability of continuation of Friday’s strong positive
momentum in coming week. Considering the broad based
rally in the frontline stocks, we are of the opinion that traders
can create fresh long positions on every decline up to 5275
(Nifty Spot) for a target of 5449 - 5550 (Nifty Spot). The stop
loss for this trade set up can be placed below 5190 (Nifty
Spot) mark. A breach of 5190 level would trigger complete
loss of current optimism in the market.
1
Daily Technical Report
September 10, 2012
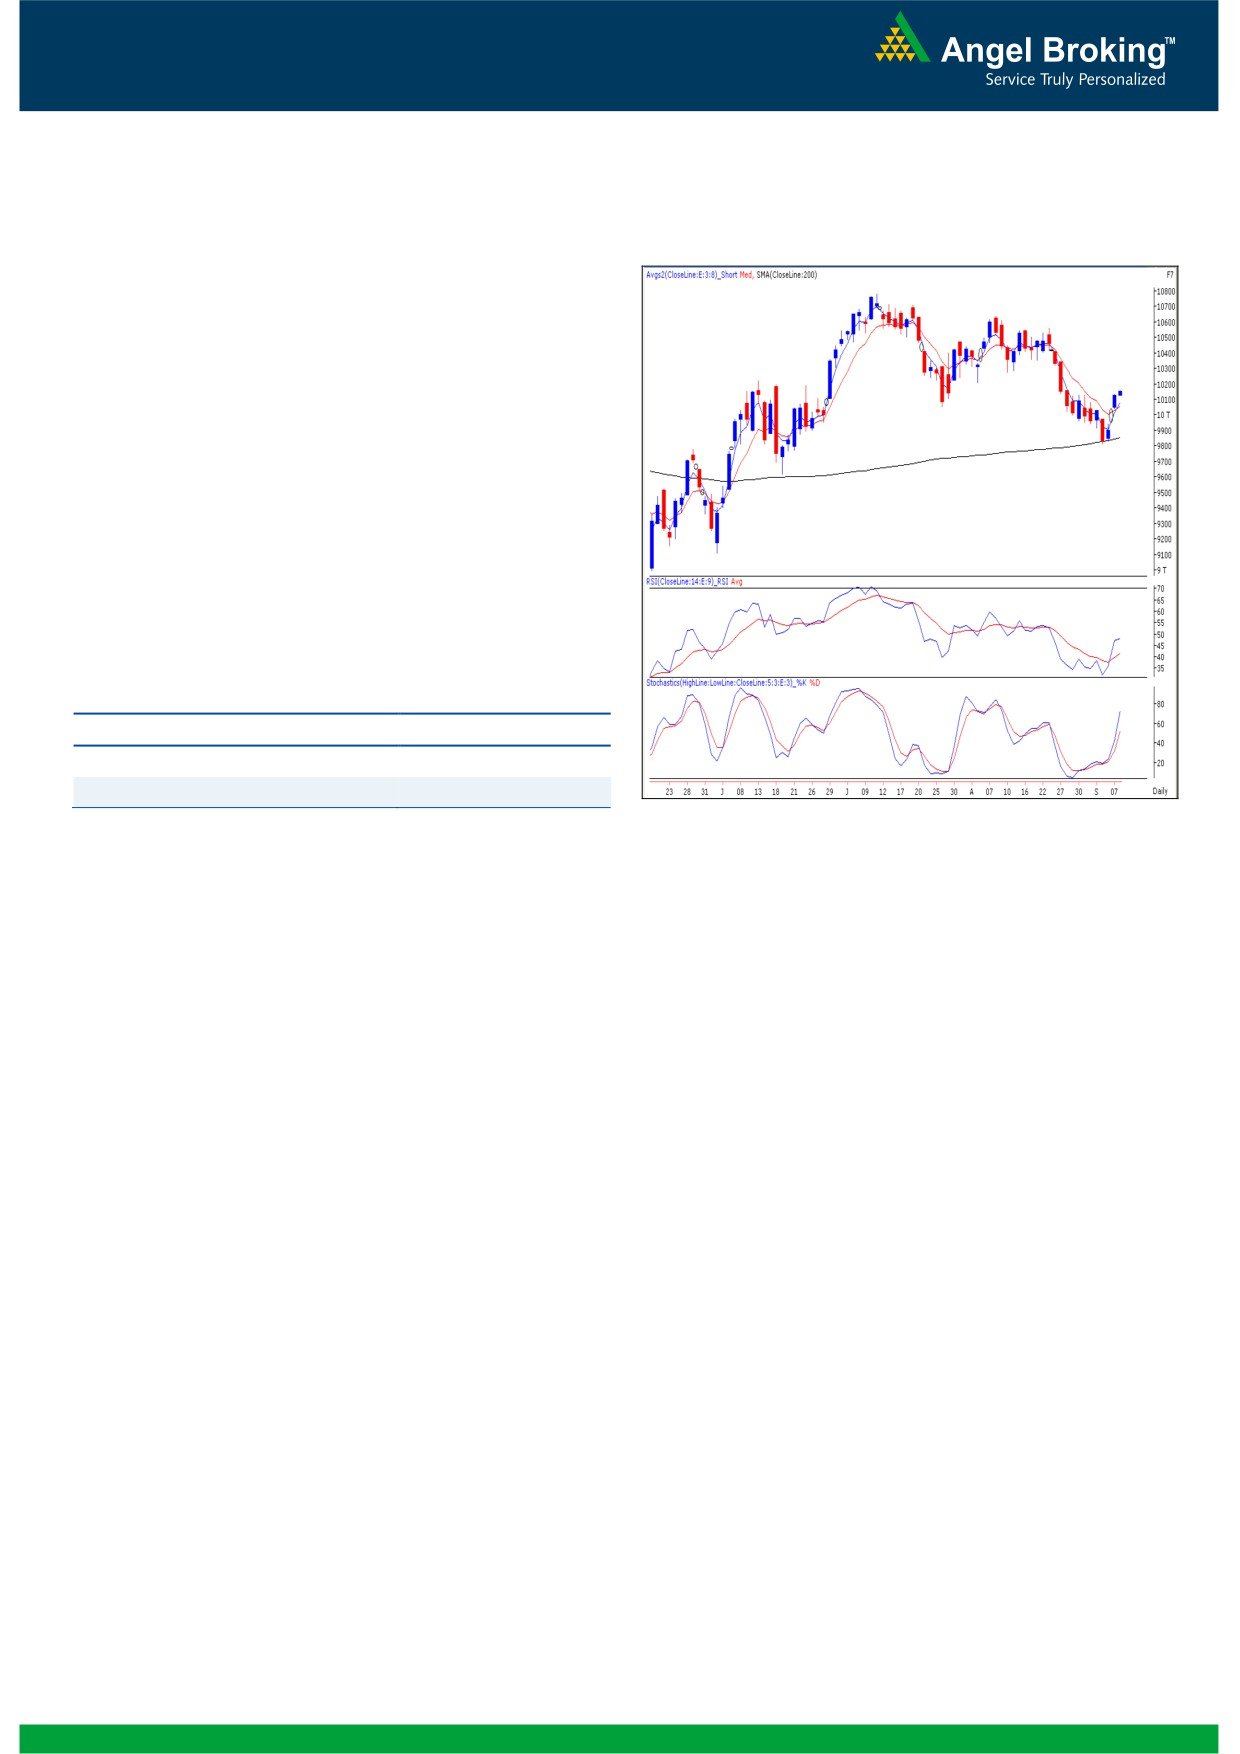
Bank Nifty Outlook - (10147)
Exhibit 2: Bank Nifty Daily Chart
On Friday, similar to our benchmark indices the Bank Nifty
too opened on a positive note and closed at the highest
point of the day. The “Bullish Harami” pattern mentioned in
our previous report has been confirmed as the index has
managed to close above 9947 level. We are now witnessing
a positive crossover in “3 & 8” EMA coupled with positive
placement of momentum oscillators on the daily chart. The
impact of the above technical indicators mentioned can be
seen in near future. In this scenario, the index is likely to rally
towards 10275 - 10355 levels. On the downside, 10036 -
9947 are likely to act as support in coming trading session.
Actionable points:
View
Bullish
Expected Target Levels
10275 - 10355
Support Levels
10036 - 9947
Source: Falcon:
2
Daily Technical Report
September 10, 2012
Research Team Tel: 022 - 39357800
DISCLAIMER
This document is solely for the personal information of the recipient, and must not be singularly used as the basis of any investment
decision. Nothing in this document should be construed as investment or financial advice. Each recipient of this document should make
such investigations as they deem necessary to arrive at an independent evaluation of an investment in the securities of the companies
referred to in this document (including the merits and risks involved), and should consult their own advisors to determine the merits and
risks of such an investment.
Angel Broking Limited, its affiliates, directors, its proprietary trading and investment businesses may, from time to time, make
investment decisions that are inconsistent with or contradictory to the recommendations expressed herein. The views contained in this
document are those of the analyst, and the company may or may not subscribe to all the views expressed within.
Reports based on technical and derivative analysis center on studying charts of a stock's price movement, outstanding positions and
trading volume, as opposed to focusing on a company's fundamentals and, as such, may not match with a report on a company's
fundamentals.
The information in this document has been printed on the basis of publicly available information, internal data and other reliable
sources believed to be true, but we do not represent that it is accurate or complete and it should not be relied on as such, as this
document is for general guidance only. Angel Broking Limited or any of its affiliates/ group companies shall not be in any way
responsible for any loss or damage that may arise to any person from any inadvertent error in the information contained in this report.
Angel Broking Limited has not independently verified all the information contained within this document. Accordingly, we cannot testify,
nor make any representation or warranty, express or implied, to the accuracy, contents or data contained within this document. While
Angel Broking Limited endeavours to update on a reasonable basis the information discussed in this material, there may be regulatory,
compliance, or other reasons that prevent us from doing so.
This document is being supplied to you solely for your information, and its contents, information or data may not be reproduced,
redistributed or passed on, directly or indirectly.
Angel Broking Limited and its affiliates may seek to provide or have engaged in providing corporate finance, investment banking or
other advisory services in a merger or specific transaction to the companies referred to in this report, as on the date of this report or in
the past.
Neither Angel Broking Limited, nor its directors, employees or affiliates shall be liable for any loss or damage that may arise from or in
connection with the use of this information.
Note: Please refer to the important `Stock Holding Disclosure' report on the Angel website (Research Section). Also, please refer to the
latest update on respective stocks for the disclosure status in respect of those stocks. Angel Broking Limited and its affiliates may have
investment positions in the stocks recommended in this report.
Research Team
Shardul Kulkarni
-
Head - Technicals
Sameet Chavan
-
Technical Analyst
Sacchitanand Uttekar
-
Technical Analyst
Mehul Kothari
-
Technical Analyst
Ankur Lakhotia
-
Technical Analyst
Angel Broking Pvt. Ltd.
Registered Office: G-1, Ackruti Trade Centre, Rd. No. 7, MIDC, Andheri (E), Mumbai - 400 093.
Corporate Office: 6th Floor, Ackruti Star, MIDC, Andheri (E), Mumbai - 400 093. Tel: (022) 3952 6600
Sebi Registration No: INB 010996539
4