Daily Technical Report
October 09, 2012
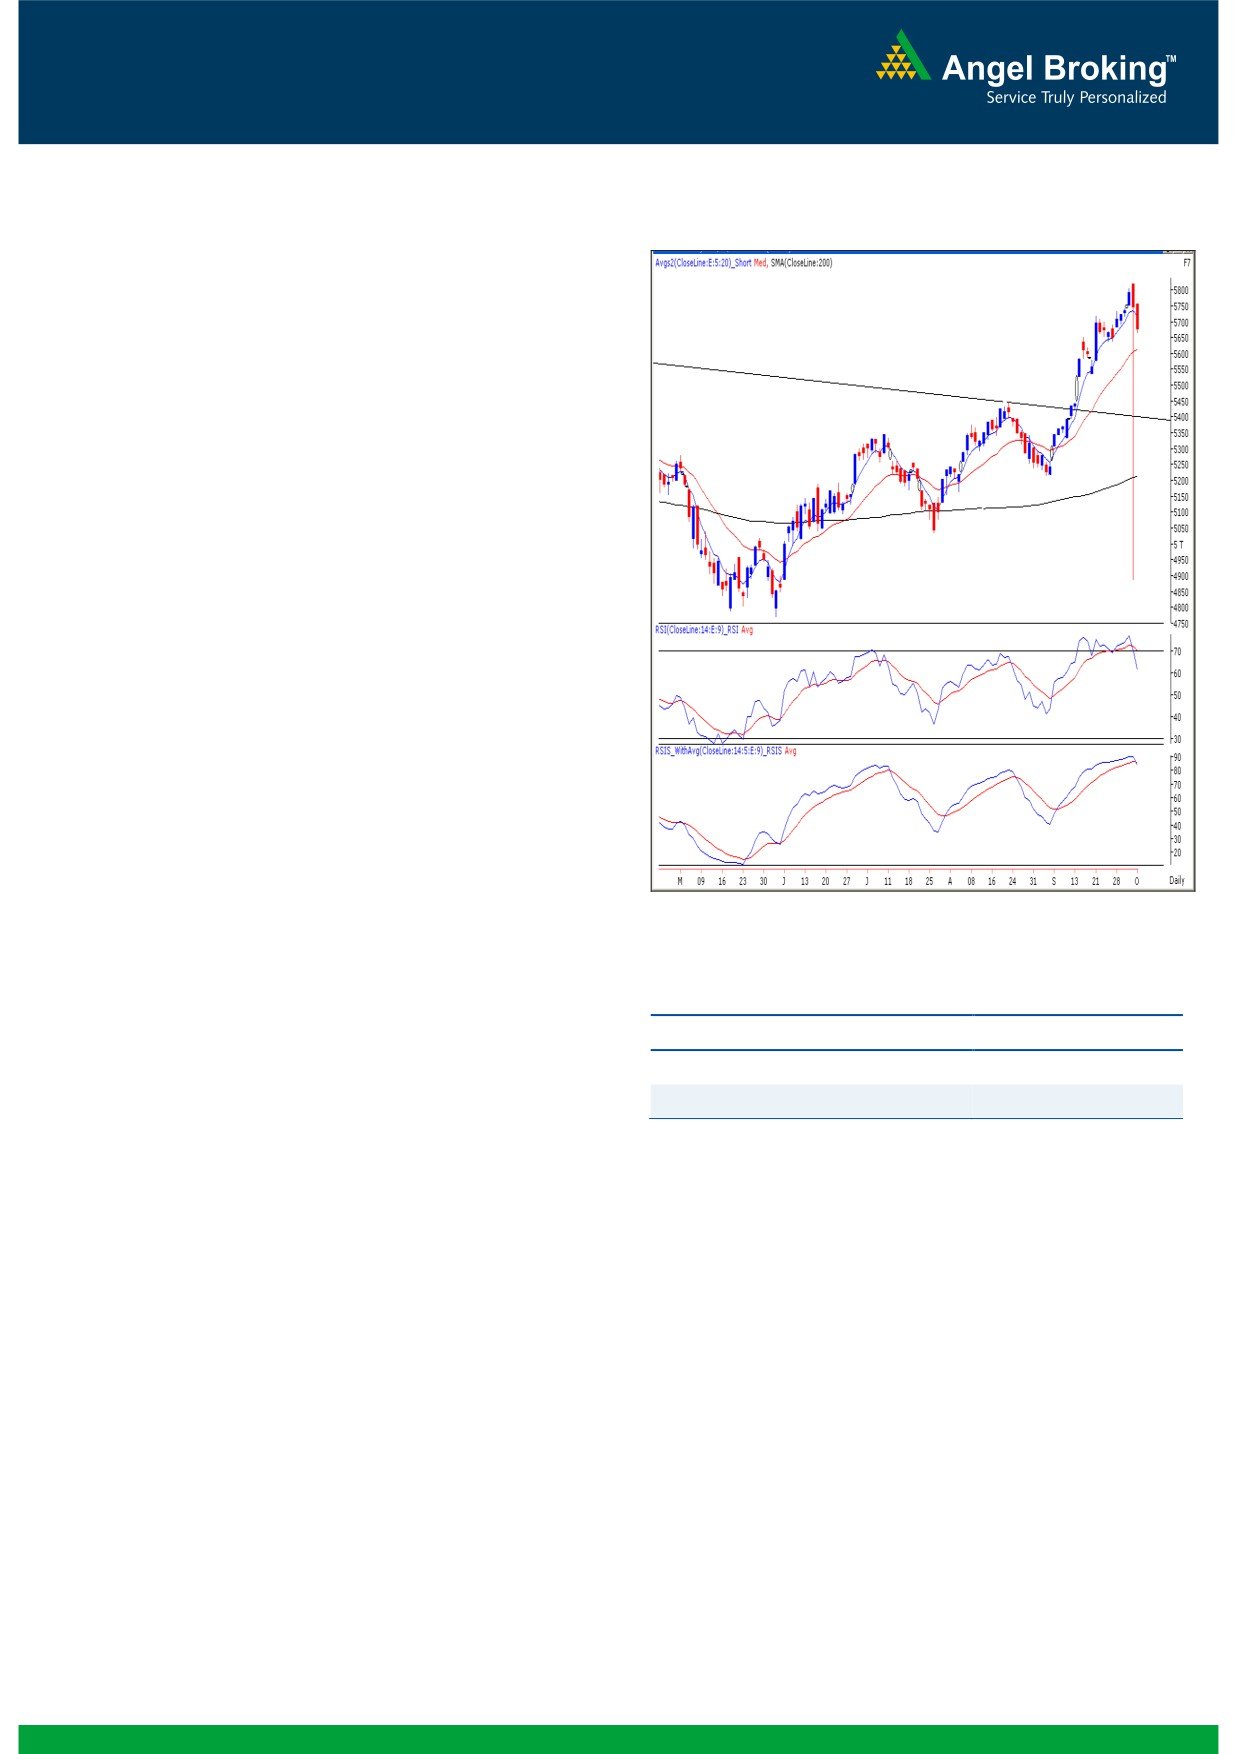
Exhibit 1: Nifty Daily Chart
Sensex (18709) / NIFTY (5676)
The week started on a flat note in-line with quiet global cues.
However, selling pressure during the second half of the
session eventually resulted in a closing well below
5700
mark. The fall was mainly led by profit booking in Oil & Gas
giant Reliance Industries coupled with some heavyweights in
Banking, Capital Goods and Realty sectors; whereas only
Health Care sector ended in the positive territory. The
advance to decline ratio was in favor of declining counters
Formation
The ’20-day EMA’ and the ’20-week EMA’ are placed at
18485 / 5600 and 17750 / 5380 levels, respectively.
The monthly ‘RSI’ oscillator is moving higher from the 50
mark and the ADX (9) indicator is now signaling a
positive crossover.
The daily ‘RSI’ and ‘Stochastic’ oscillators are signaling a
negative crossover.
Source: Falcon:
Trading strategy:
Actionable points:
Yesterday's session was completely dominated by the bears
as the benchmark indices struggled to give even a minor
View
Neutral
intraday bounce. The price movement was in-line with
Resistance Levels
5752
expectations as the negatively poised daily momentum
Support Levels
5666 - 5638
oscillators came into the action. As a result, our benchmark
indices breached the mentioned support level of 18740 /
5694 during the second half to register a low of 18684 /
5666. At present, the negative crossover in daily 'RSI-
Smoothened' oscillator indicates that if our markets sustain
below yesterday's low of 18684 / 5666 then a further
correction towards their next support levels of 18552 -
18291 / 5638 - 5534 can be expected. However, keeping in
mind the positive placement of monthly 'RSI' indicator and
the ADX (9) indicator, the intermediate trend remains intact
i.e. bullish. Going forward, yesterday's high of 18970 / 5752
level would act as a resistance in coming trading session. A
move beyond this resistance would signal that the selling
pressure will abate and a move towards 19138 / 5816 is on
the cards.
1
Daily Technical Report
October 09, 2012
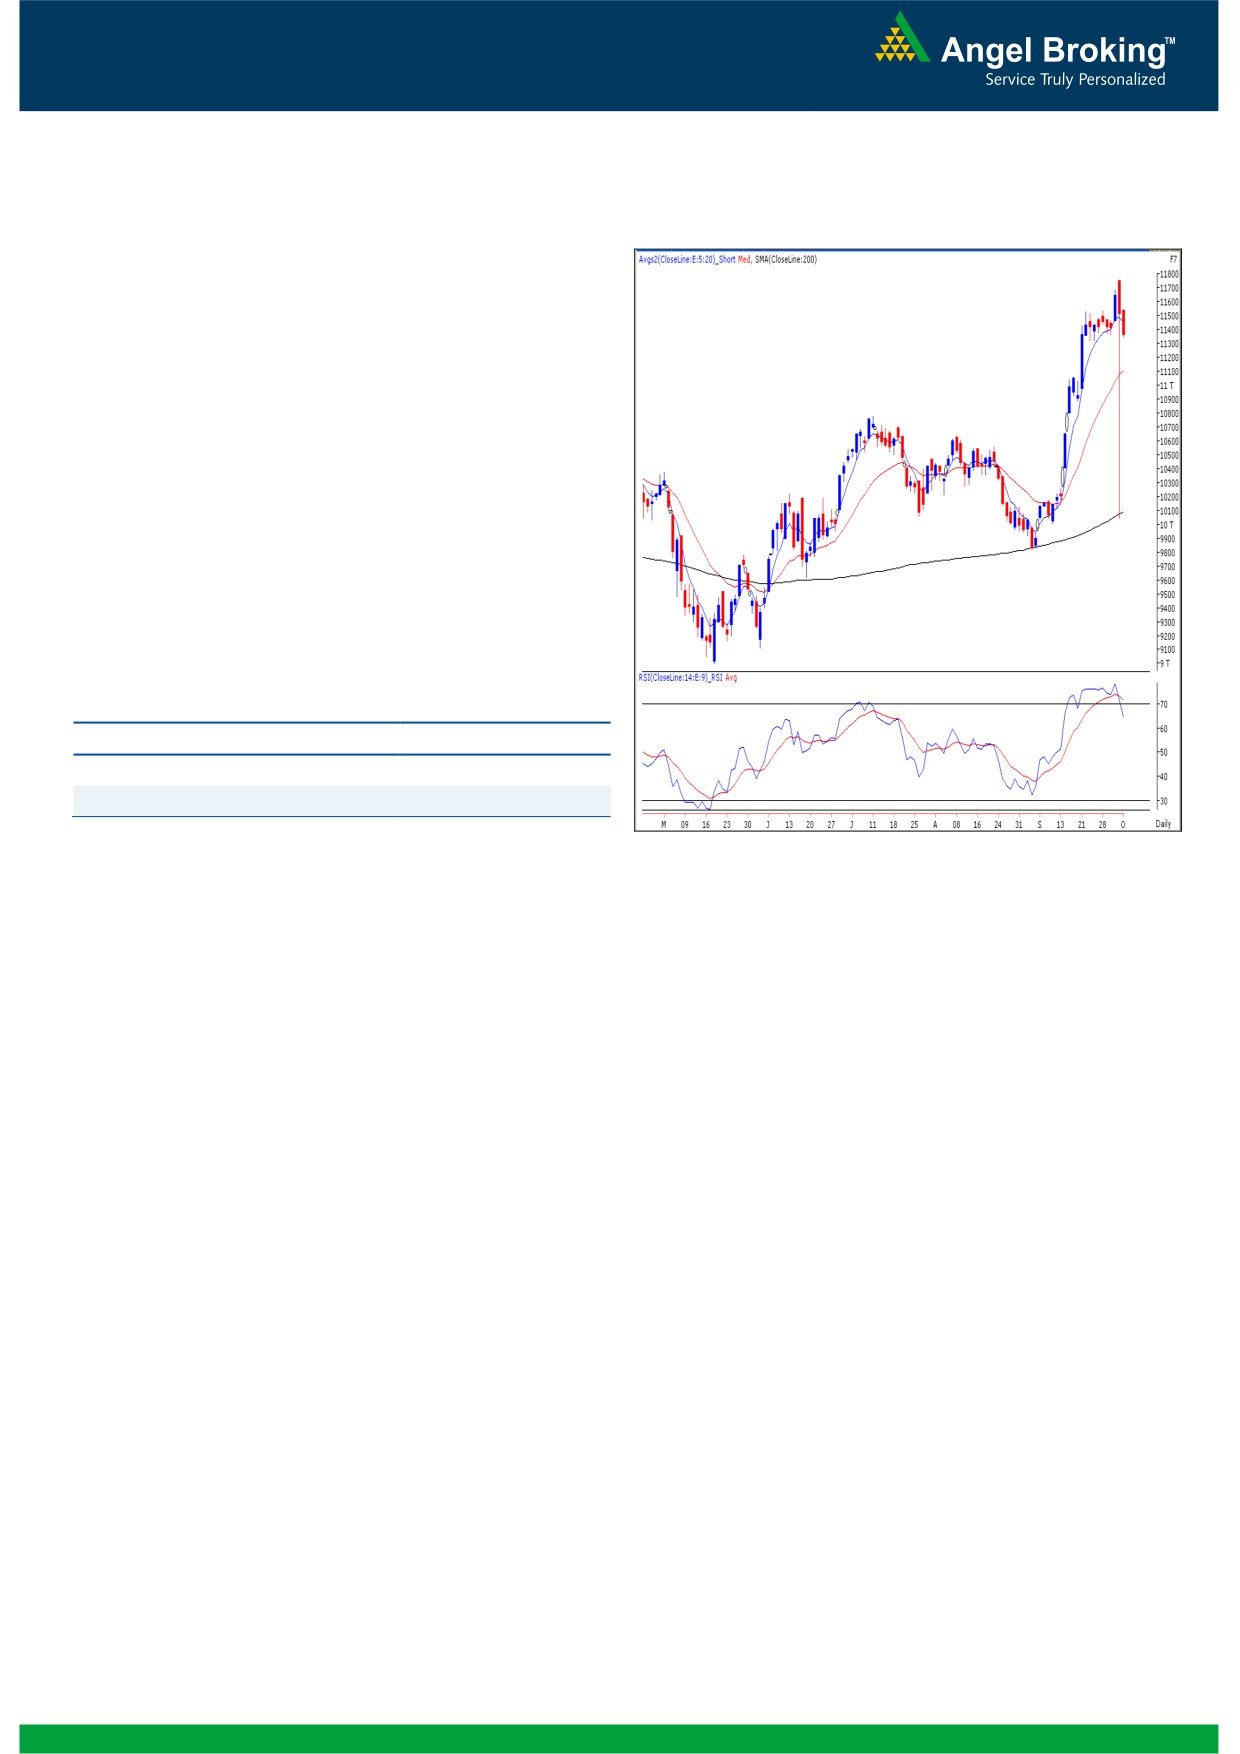
Exhibit 2: Bank Nifty Daily Chart
Bank Nifty Outlook - (11362)
Yesterday, Bank Nifty opened on a pessimistic note and
corrected lower as the day progressed to close near day’s
low. The “Dark Cloud Cover” candlestick mentioned in our
previous report has been confirmed. The momentum
oscillator “RSI” on the daily chart continues with its sell
signal. However, the support level of 11320 has not been
breached and traders holding long positions should
maintain a strict stop loss of 11320 on the index. A move
below 11320 will further drag the index lower to 11226 -
11124 levels. On the upside 11540 - 11745 levels is likely
to act as resistance in coming trading session.
Actionable points:
View
Neutral
Resistance Levels
11540 - 11745
Support Levels
11320 - 11226
Source: Falcon:
2
Daily Technical Report
October 09, 2012
Research Team Tel: 022 - 39357800
DISCLAIMER
This document is solely for the personal information of the recipient, and must not be singularly used as the basis of any investment
decision. Nothing in this document should be construed as investment or financial advice. Each recipient of this document should make
such investigations as they deem necessary to arrive at an independent evaluation of an investment in the securities of the companies
referred to in this document (including the merits and risks involved), and should consult their own advisors to determine the merits and
risks of such an investment.
Angel Broking Limited, its affiliates, directors, its proprietary trading and investment businesses may, from time to time, make
investment decisions that are inconsistent with or contradictory to the recommendations expressed herein. The views contained in this
document are those of the analyst, and the company may or may not subscribe to all the views expressed within.
Reports based on technical and derivative analysis center on studying charts of a stock's price movement, outstanding positions and
trading volume, as opposed to focusing on a company's fundamentals and, as such, may not match with a report on a company's
fundamentals.
The information in this document has been printed on the basis of publicly available information, internal data and other reliable
sources believed to be true, but we do not represent that it is accurate or complete and it should not be relied on as such, as this
document is for general guidance only. Angel Broking Limited or any of its affiliates/ group companies shall not be in any way
responsible for any loss or damage that may arise to any person from any inadvertent error in the information contained in this report.
Angel Broking Limited has not independently verified all the information contained within this document. Accordingly, we cannot testify,
nor make any representation or warranty, express or implied, to the accuracy, contents or data contained within this document. While
Angel Broking Limited endeavours to update on a reasonable basis the information discussed in this material, there may be regulatory,
compliance, or other reasons that prevent us from doing so.
This document is being supplied to you solely for your information, and its contents, information or data may not be reproduced,
redistributed or passed on, directly or indirectly.
Angel Broking Limited and its affiliates may seek to provide or have engaged in providing corporate finance, investment banking or
other advisory services in a merger or specific transaction to the companies referred to in this report, as on the date of this report or in
the past.
Neither Angel Broking Limited, nor its directors, employees or affiliates shall be liable for any loss or damage that may arise from or in
connection with the use of this information.
Note: Please refer to the important `Stock Holding Disclosure' report on the Angel website (Research Section). Also, please refer to the
latest update on respective stocks for the disclosure status in respect of those stocks. Angel Broking Limited and its affiliates may have
investment positions in the stocks recommended in this report.
Research Team
Shardul Kulkarni
-
Head - Technicals
Sameet Chavan
-
Technical Analyst
Sacchitanand Uttekar
-
Technical Analyst
Mehul Kothari
-
Technical Analyst
Ankur Lakhotia
-
Technical Analyst
Angel Broking Pvt. Ltd.
Registered Office: G-1, Ackruti Trade Centre, Rd. No. 7, MIDC, Andheri (E), Mumbai - 400 093.
Corporate Office: 6th Floor, Ackruti Star, MIDC, Andheri (E), Mumbai - 400 093. Tel: (022) 3952 6600
Sebi Registration No: INB 010996539
4