Daily Technical Report
May 09, 2013
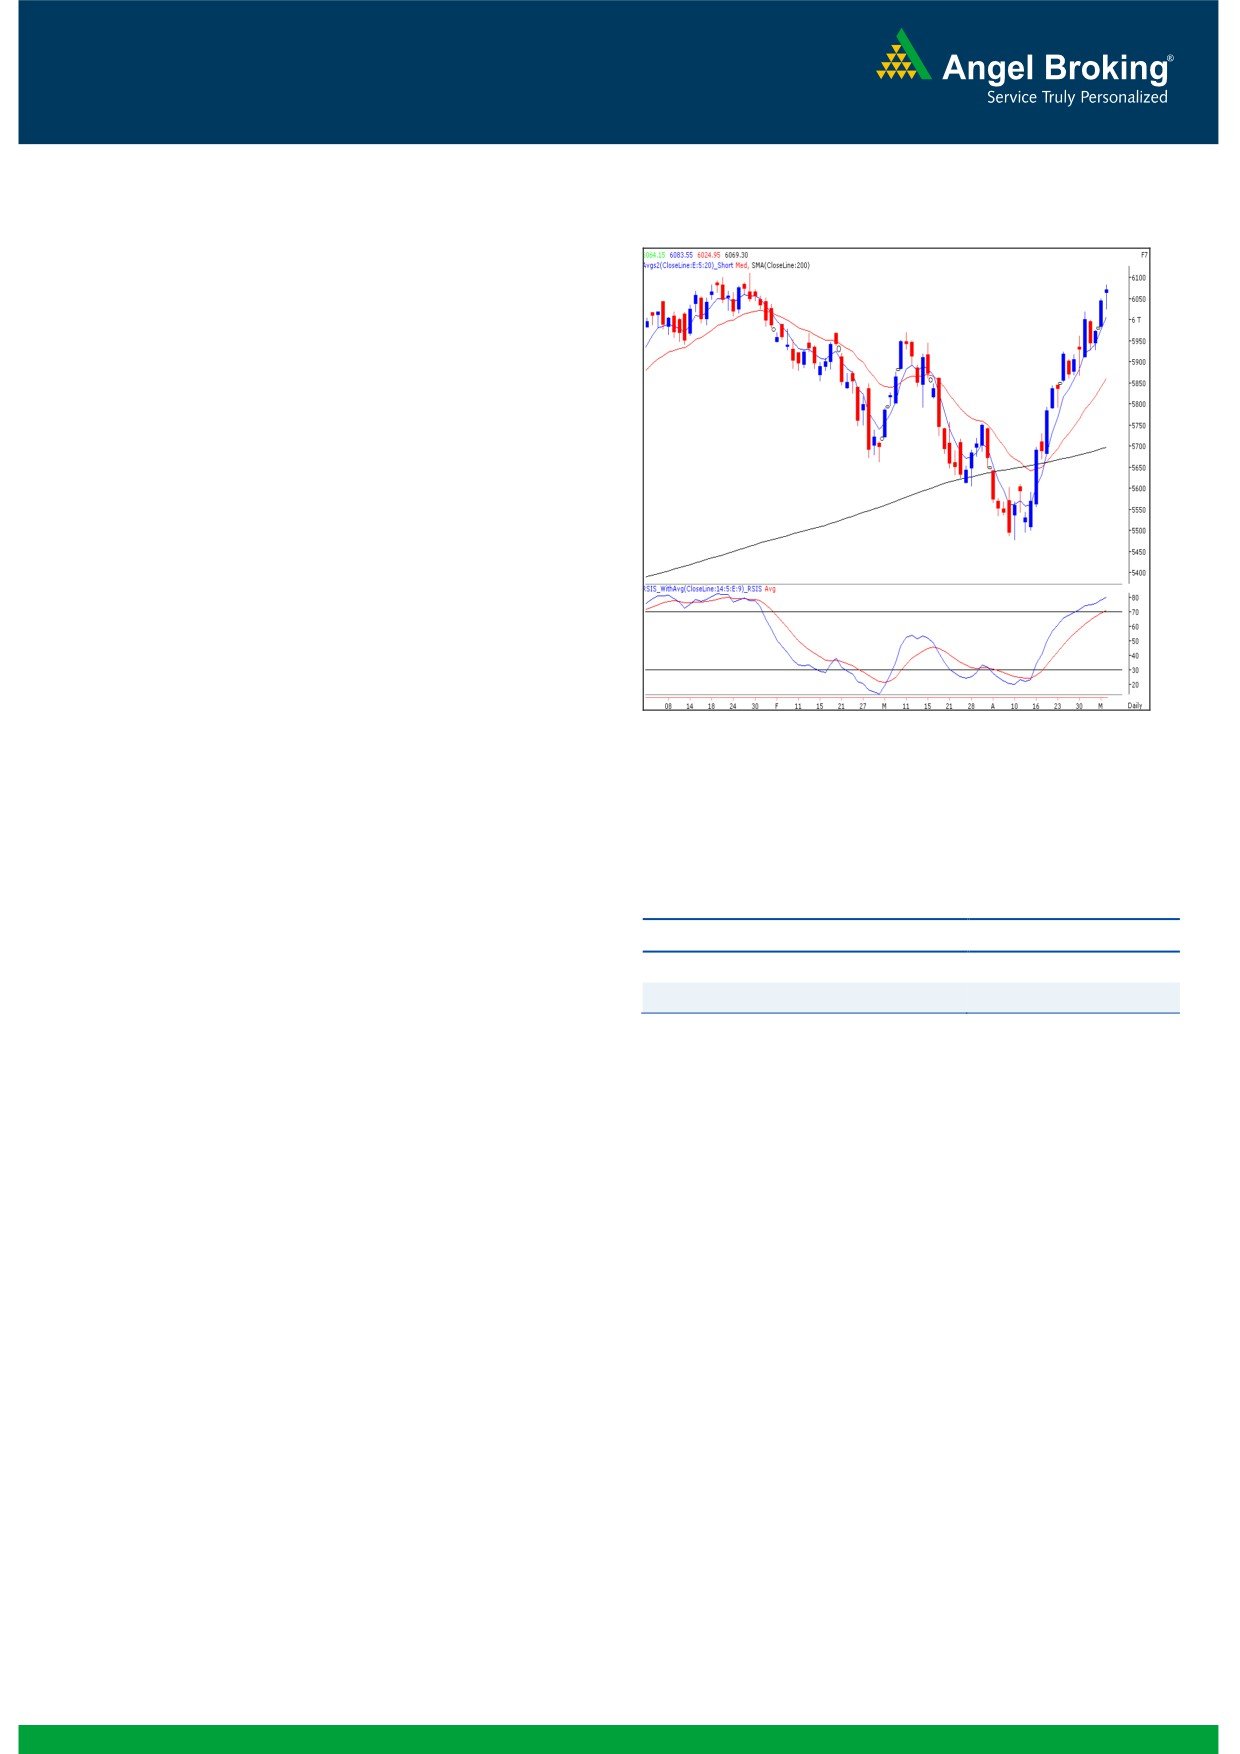
Exhibit 1: Nifty Daily Chart
Sensex (19990) / NIFTY (6069)
Yesterday, once again we witnessed a gap opening on the
back of positive cues from other Asian bourses. Indices then
corrected from their early morning high to slip marginally in
the negative territory. However, post midsession, indices
recovered gradually from the day’s low to eventually end the
session on a positive note. For the day Capital Goods and
Auto stocks ended with losses whereas FMCG counter was
among the major gainers. The advance to decline ratio was
Formation
The ’20-week EMA’ and the ’20-day EMA’ are placed at
19175/ 5811 and 19312/ 5861 levels, respectively.
Source: Falcon:
The weekly ADX (9) indicator and the ‘RSI-Smoothened’
oscillator have signaled a positive crossover.
Trading strategy:
Actionable points:
After a gap opening, indices remained under pressure
during the first half; but strong optimism towards the latter
View
Bearish Below 6024
part of the session pushed indices higher to end the session
Expected Targets
5980 - 5930
with half a percent gain. Yesterday’s daily candle resembles
Resistance Levels
6072 - 6111
a ‘Hanging Man’ Japanese candlestick pattern. An
occurrence of such pattern near important resistance level
indicates sign of caution for the bulls. However, at present, it
has occurred slightly lower from the previous top of 20204 /
6112 (high on January 29, 2013). The said pattern needs
confirmation in the form of closing below the low of the
candle. Also, the daily ‘RSI-Smoothened’ oscillator has now
entered an overbought territory. Hence, we are of the
opinion that we may witness a loss of current optimism if
indices manage to sustain below yesterday’s low of 19851 /
6024. In this scenario, indices may correct towards 19743 -
19542 / 5993 - 5930 levels. Conversely, any sustainable
move beyond yesterday’s high of 20038 / 6083 would
negate the pattern and indices may then rally towards 20204
/ 6112. We advise positional traders to book at least partial
profits and maintain strict stop losses for remaining long
positions.
1
Daily Technical Report
May 09, 2013
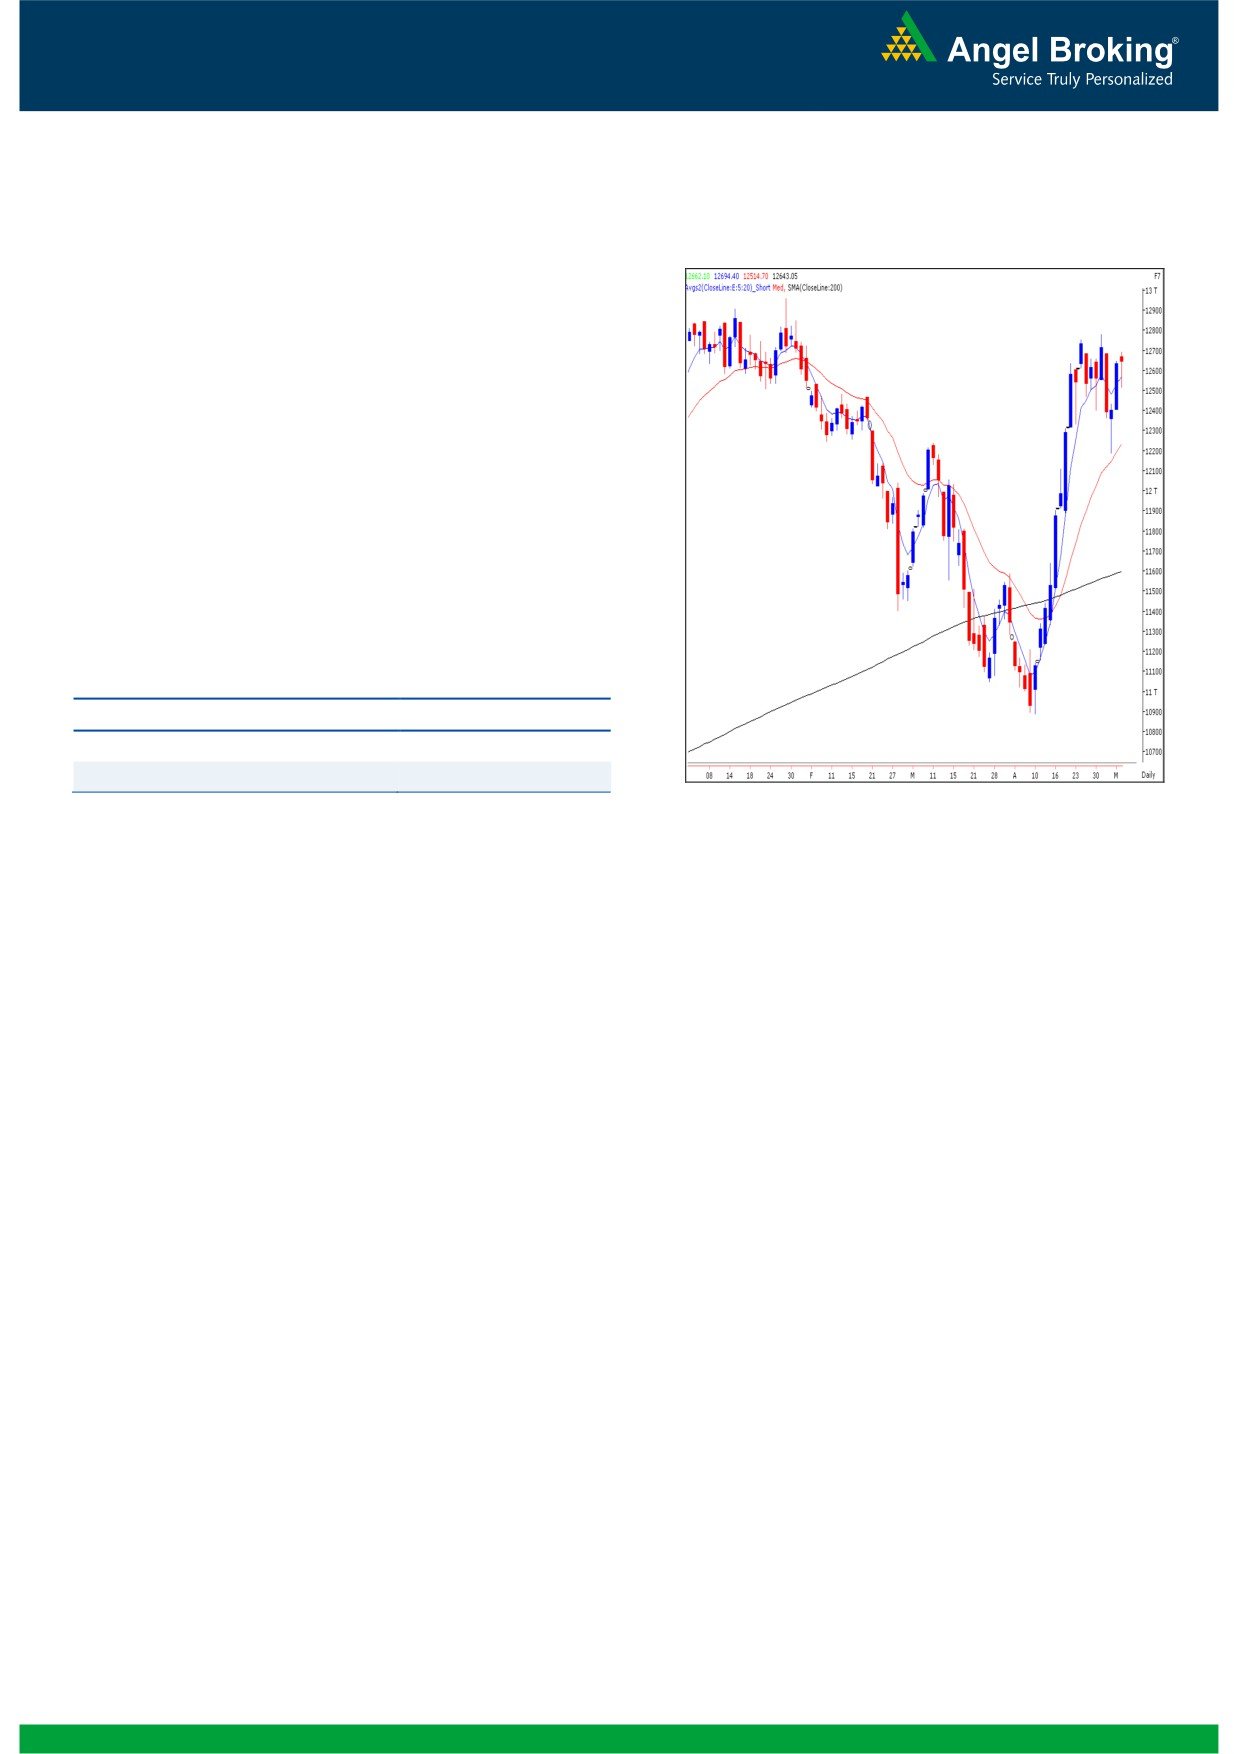
Exhibit 2: Bank Nifty Daily Chart
Bank Nifty Outlook - (12643)
Yesterday, Bank Nifty opened on an optimistic note and
drifted lower during first half of the session. However, during
the second half buying interest led the index to close near the
initial opening level. In the process the index formed a
narrow range body formation indicating indecisiveness
prevailing at current levels. Thus only a move above 12700
would push the index higher towards 12780 - 12850 levels.
On the downside a breach of yesterday’s low of 12514
would result in a loss of positive momentum in Bank Nifty
and the Index may drift lower towards 12400 - 12330
levels.
Actionable points:
View
Neutral
Resistance Levels
12700 - 12780
Support Levels
12514 - 12400
Source: Falcon:
2
Daily Technical Report
May 09, 2013
Research Team Tel: 022 - 30940000
DISCLAIMER
This document is solely for the personal information of the recipient, and must not be singularly used as the basis of any investment
decision. Nothing in this document should be construed as investment or financial advice. Each recipient of this document should make
such investigations as they deem necessary to arrive at an independent evaluation of an investment in the securities of the companies
referred to in this document (including the merits and risks involved), and should consult their own advisors to determine the merits and
risks of such an investment.
Angel Broking Limited, its affiliates, directors, its proprietary trading and investment businesses may, from time to time, make
investment decisions that are inconsistent with or contradictory to the recommendations expressed herein. The views contained in this
document are those of the analyst, and the company may or may not subscribe to all the views expressed within.
Reports based on technical and derivative analysis center on studying charts of a stock's price movement, outstanding positions and
trading volume, as opposed to focusing on a company's fundamentals and, as such, may not match with a report on a company's
fundamentals.
The information in this document has been printed on the basis of publicly available information, internal data and other reliable
sources believed to be true, but we do not represent that it is accurate or complete and it should not be relied on as such, as this
document is for general guidance only. Angel Broking Limited or any of its affiliates/ group companies shall not be in any way
responsible for any loss or damage that may arise to any person from any inadvertent error in the information contained in this report.
Angel Broking Limited has not independently verified all the information contained within this document. Accordingly, we cannot testify,
nor make any representation or warranty, express or implied, to the accuracy, contents or data contained within this document. While
Angel Broking Limited endeavors to update on a reasonable basis the information discussed in this material, there may be regulatory,
compliance, or other reasons that prevent us from doing so.
This document is being supplied to you solely for your information, and its contents, information or data may not be reproduced,
redistributed or passed on, directly or indirectly.
Angel Broking Limited and its affiliates may seek to provide or have engaged in providing corporate finance, investment banking or
other advisory services in a merger or specific transaction to the companies referred to in this report, as on the date of this report or in
the past.
Neither Angel Broking Limited, nor its directors, employees or affiliates shall be liable for any loss or damage that may arise from or in
connection with the use of this information.
Note: Please refer to the important `Stock Holding Disclosure' report on the Angel website (Research Section). Also, please refer to the
latest update on respective stocks for the disclosure status in respect of those stocks. Angel Broking Limited and its affiliates may have
investment positions in the stocks recommended in this report.
Research Team
Shardul Kulkarni
-
Head - Technicals
Sameet Chavan
-
Technical Analyst
Sacchitanand Uttekar
-
Technical Analyst
Ankur Lakhotia
-
Technical Analyst
Angel Broking Pvt. Ltd.
Registered Office: G-1, Ackruti Trade Centre, Rd. No. 7, MIDC, Andheri (E), Mumbai - 400 093.
Corporate Office: 6th Floor, Ackruti Star, MIDC, Andheri (E), Mumbai - 400 093. Tel: (022) 30940000
Sebi Registration No: INB 010996539
4