Daily Technical Report
January 09, 2013
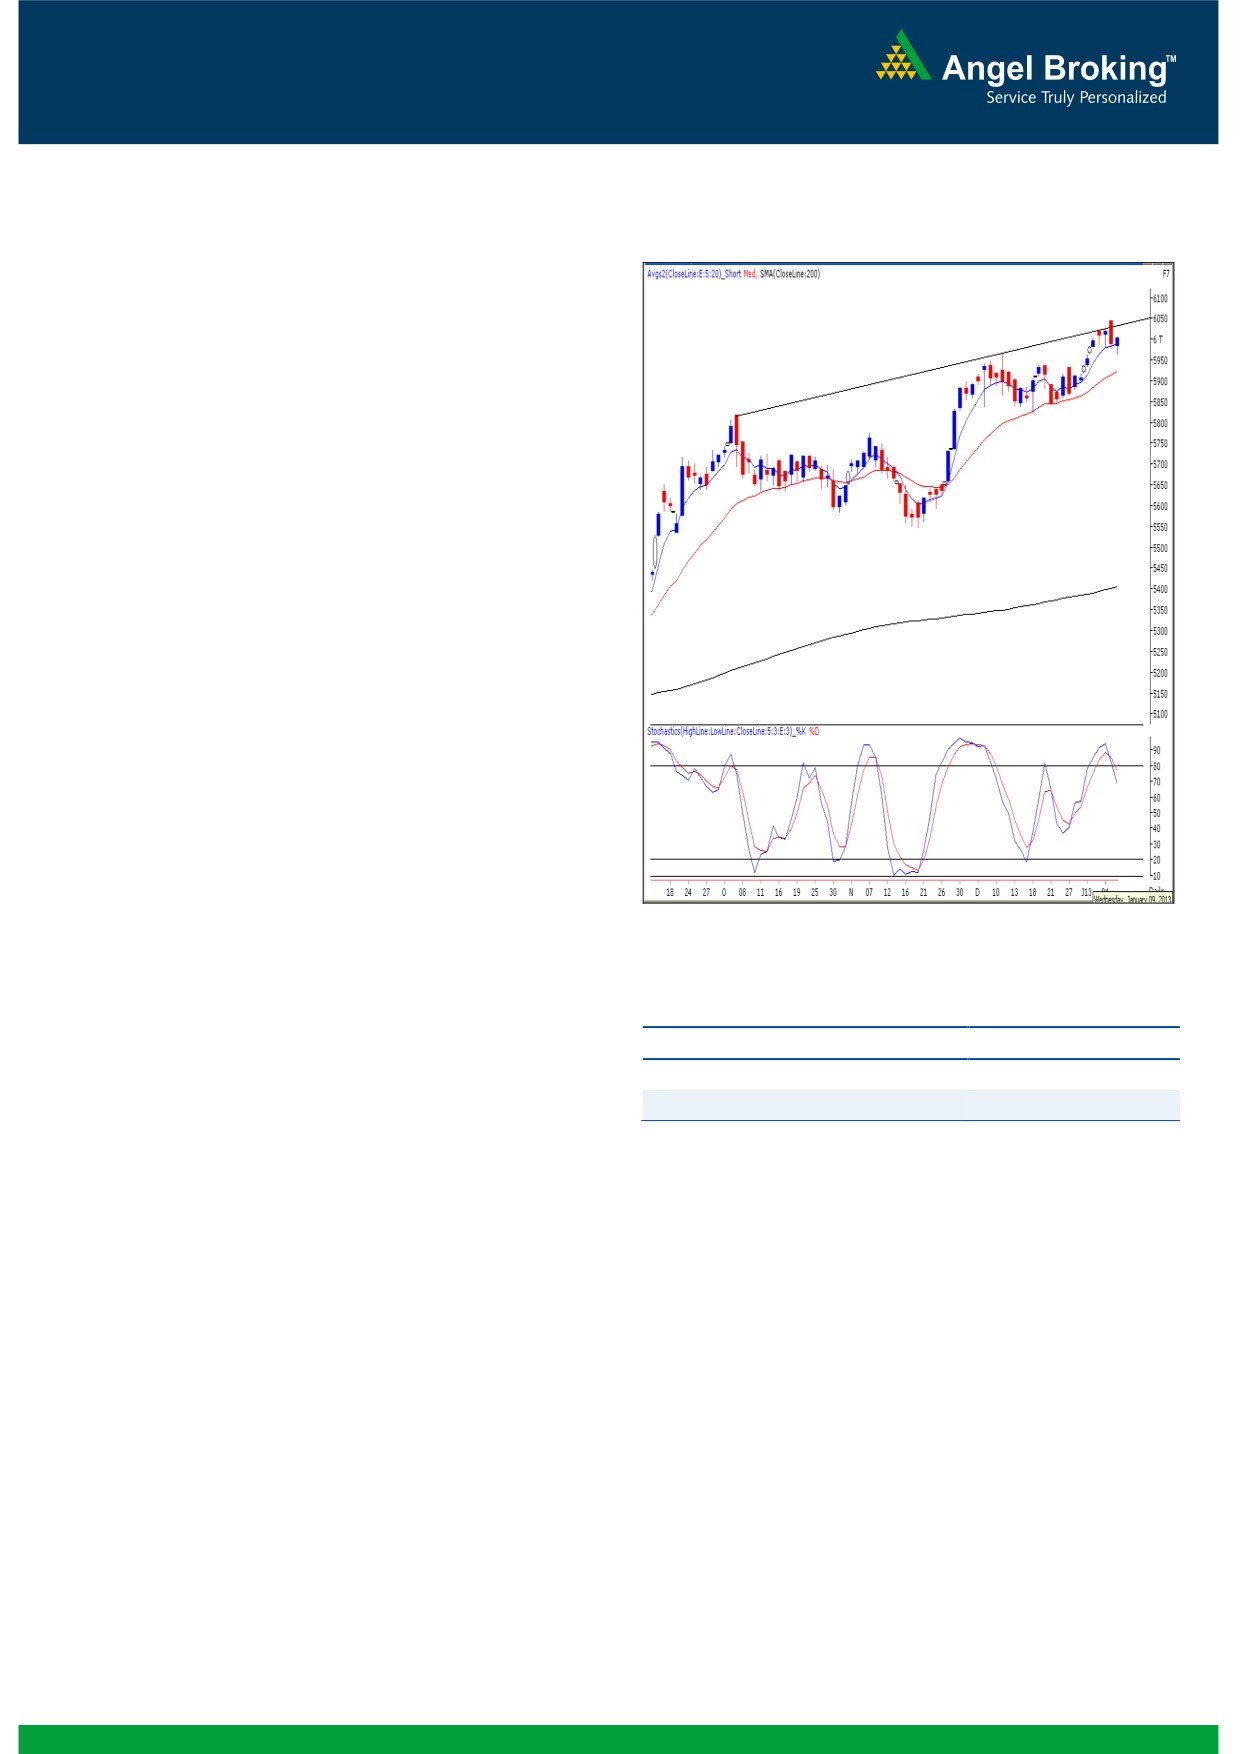
Sensex (19743) / NIFTY (6002)
Exhibit 1: Nifty Daily Chart
Yesterday, our benchmark indices opened on a flat note in-
line with quiet global cues and selling pressure during the
first half led indices to fall below Monday’s low. However,
post midsession, a sharp recovery from the day’s low helped
the Nifty to close above the 6000 mark. During the session,
Realty, FMCG and Health Care counters contributed heavily
in the second half’s sharp up move; whereas the Consumer
Durables and Metal sectors corrected heavily. The advance
to decline ratio was marginally in favor of declining counters
Formation
The ’20-day EMA’ and the ’20-week EMA’ are placed at
19477 / 5923 and 18842 / 5725 levels, respectively.
On the daily chart, the benchmark indices are facing
resistance near the ‘Upward Sloping Trend Line’ drawn
by joining the highs of October 5, 2012 and December
11, 2012.
Source: Falcon:
Trading strategy:
Yesterday, momentum shifted in the favor of bulls during the
Actionable points:
second half as we witnessed a sudden spurt in the market.
Going forward, considering the placement of the momentum
View
Neutral
oscillators and the candlestick patterns on the daily chart, we
Resistance Levels
6042 - 6070
expect range bound activity between 19857 / 6042 and
Support Levels
5964 - 5935
19632 / 5964 over the next few sessions and only a decisive
breakout or breakdown will dictate the direction of the near
term trend. A move beyond 19857 / 6042 may push indices
higher to test
19950
/
6070 level. On the flipside,
yesterday’s low of 19632 / 5964 would now act as a key
support in coming trading session.
1
Daily Technical Report
January 09, 2013
Bank Nifty Outlook - (12726)
Exhibit 2: Bank Nifty Daily Chart
Yesterday, Index opened on a pessimistic note and drifted
lower near the mentioned support level 12615 during first
half of the session. The negative crossover in momentum
oscillator “RSI” and “Stochastic” on the daily chart mentioned
in our previous report is still intact. However the daily chart
still is in higher top higher bottom cycle with signs of
consolidation in the near term. Thus going forward we
expect the index to trade in the range of 12838 - 12615 in
coming trading sessions. Within the mentioned range 12793
- 12838 are likely to act as resistance and 12662 - 12615
are likely to act as support for the day.
Actionable points:
View
Neutral
Resistance Levels
12793 - 12838
Support Levels
12662 - 12615
Source: Falcon:
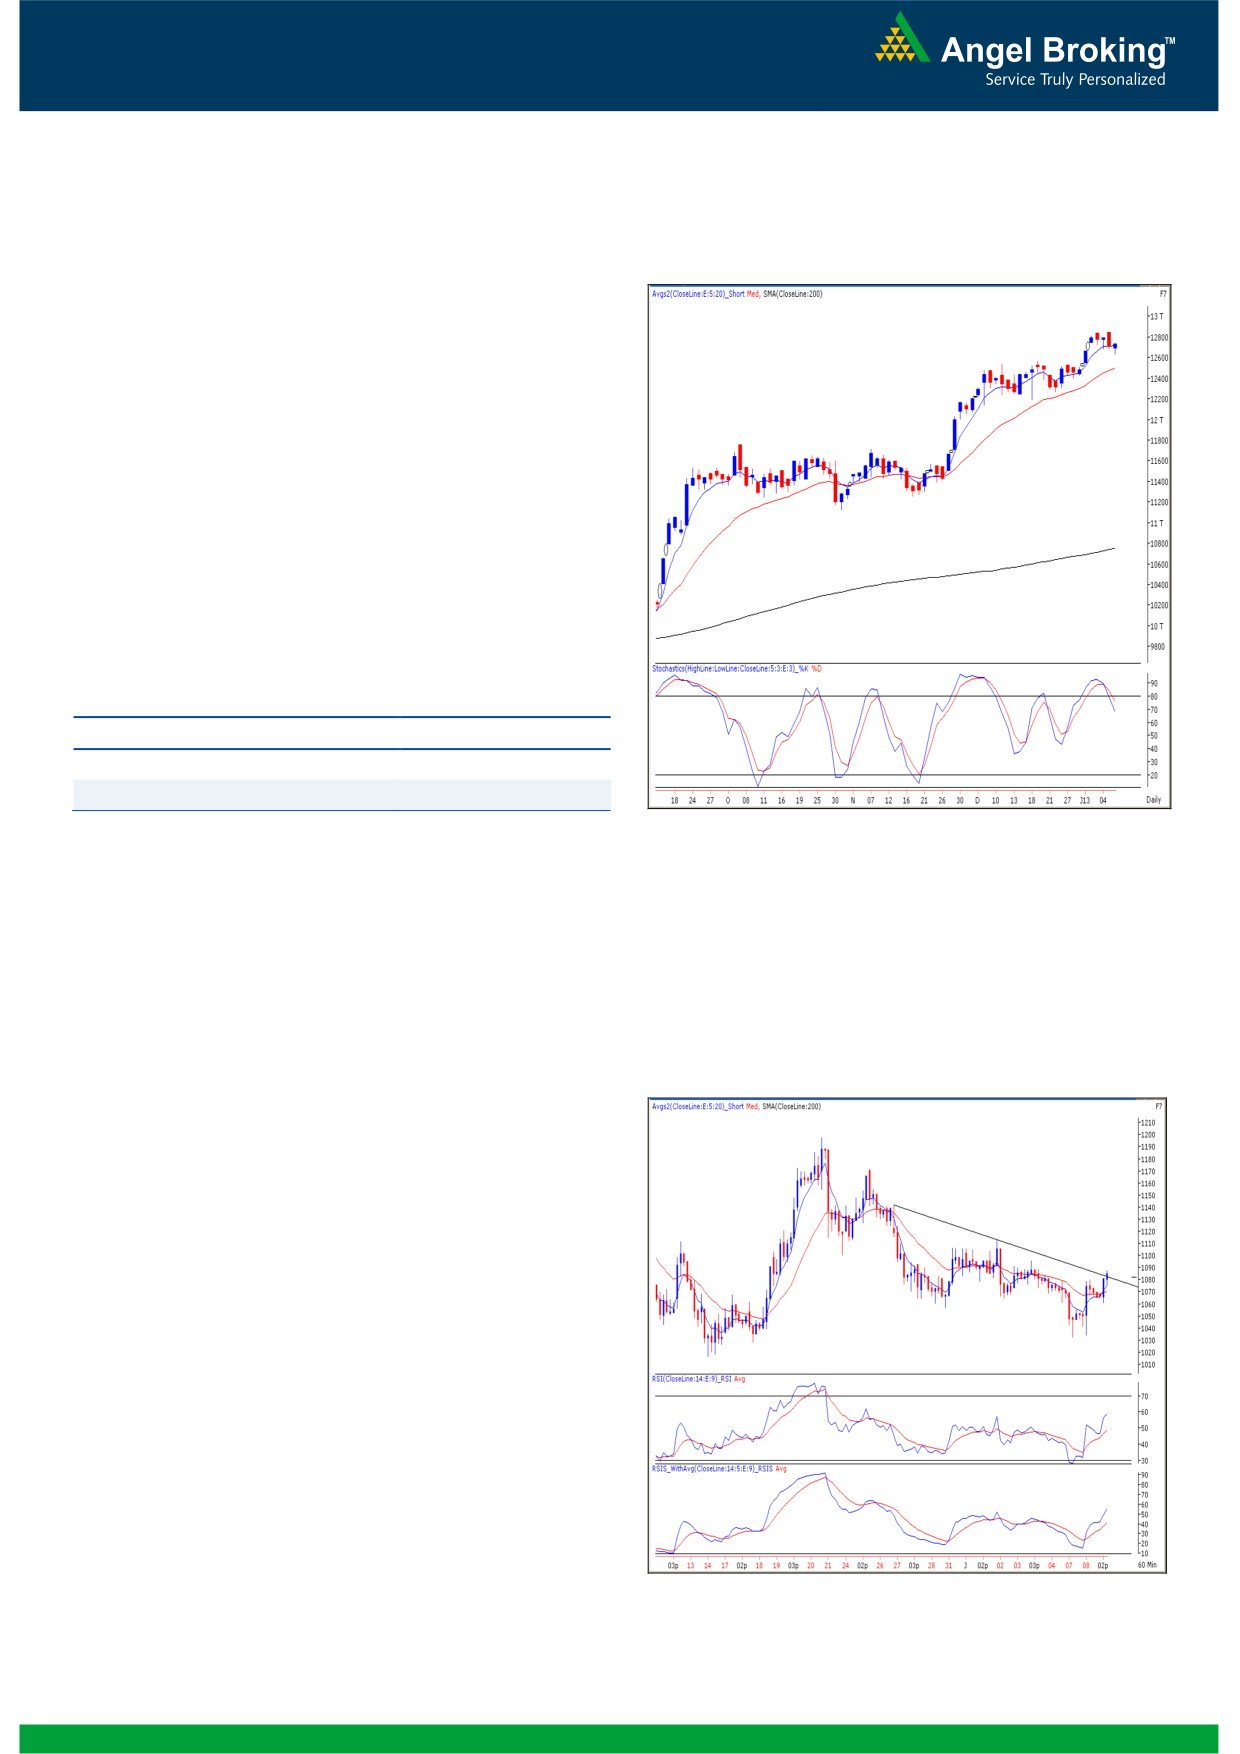
Exhibit 3: Strides Acrolab Ltd. Hourly Chart
Stock Recommendation
STRIDES ARCOLAB LTD
Action
: Buy
Last Close
: ` 1082.10
Stop-Loss
: ` 1060
Target
: ` 1130
JUSTIFICATION - After sustaining near the multiple
support level of ` 1020, yesterday the stock has formed a
‘Bullish Engulfing’ candlestick pattern on the daily chart.
Further, on the hourly chart, we are witnessing a ‘Downward
sloping trend line’ breakout near ` 1080 level supported by
positive placement of momentum oscillators. Hence we
advise buying the stock at current levels for a target of `
1130 in coming 5 - 7 trading sessions.
Source: Falcon
2
Daily Technical Report
January 09, 2013
Research Team Tel: 022 - 39357800
DISCLAIMER
This document is solely for the personal information of the recipient, and must not be singularly used as the basis of any investment
decision. Nothing in this document should be construed as investment or financial advice. Each recipient of this document should make
such investigations as they deem necessary to arrive at an independent evaluation of an investment in the securities of the companies
referred to in this document (including the merits and risks involved), and should consult their own advisors to determine the merits and
risks of such an investment.
Angel Broking Limited, its affiliates, directors, its proprietary trading and investment businesses may, from time to time, make
investment decisions that are inconsistent with or contradictory to the recommendations expressed herein. The views contained in this
document are those of the analyst, and the company may or may not subscribe to all the views expressed within.
Reports based on technical and derivative analysis center on studying charts of a stock's price movement, outstanding positions and
trading volume, as opposed to focusing on a company's fundamentals and, as such, may not match with a report on a company's
fundamentals.
The information in this document has been printed on the basis of publicly available information, internal data and other reliable
sources believed to be true, but we do not represent that it is accurate or complete and it should not be relied on as such, as this
document is for general guidance only. Angel Broking Limited or any of its affiliates/ group companies shall not be in any way
responsible for any loss or damage that may arise to any person from any inadvertent error in the information contained in this report.
Angel Broking Limited has not independently verified all the information contained within this document. Accordingly, we cannot testify,
nor make any representation or warranty, express or implied, to the accuracy, contents or data contained within this document. While
Angel Broking Limited endeavours to update on a reasonable basis the information discussed in this material, there may be regulatory,
compliance, or other reasons that prevent us from doing so.
This document is being supplied to you solely for your information, and its contents, information or data may not be reproduced,
redistributed or passed on, directly or indirectly.
Angel Broking Limited and its affiliates may seek to provide or have engaged in providing corporate finance, investment banking or
other advisory services in a merger or specific transaction to the companies referred to in this report, as on the date of this report or in
the past.
Neither Angel Broking Limited, nor its directors, employees or affiliates shall be liable for any loss or damage that may arise from or in
connection with the use of this information.
Note: Please refer to the important `Stock Holding Disclosure' report on the Angel website (Research Section). Also, please refer to the
latest update on respective stocks for the disclosure status in respect of those stocks. Angel Broking Limited and its affiliates may have
investment positions in the stocks recommended in this report.
Research Team
Shardul Kulkarni
-
Head - Technicals
Sameet Chavan
-
Technical Analyst
Sacchitanand Uttekar
-
Technical Analyst
Mehul Kothari
-
Technical Analyst
Ankur Lakhotia
-
Technical Analyst
Angel Broking Pvt. Ltd.
Registered Office: G-1, Ackruti Trade Centre, Rd. No. 7, MIDC, Andheri (E), Mumbai - 400 093.
Corporate Office: 6th Floor, Ackruti Star, MIDC, Andheri (E), Mumbai - 400 093. Tel: (022) 3952 6600
Sebi Registration No: INB 010996539
4