Daily Technical Report
November 08, 2012
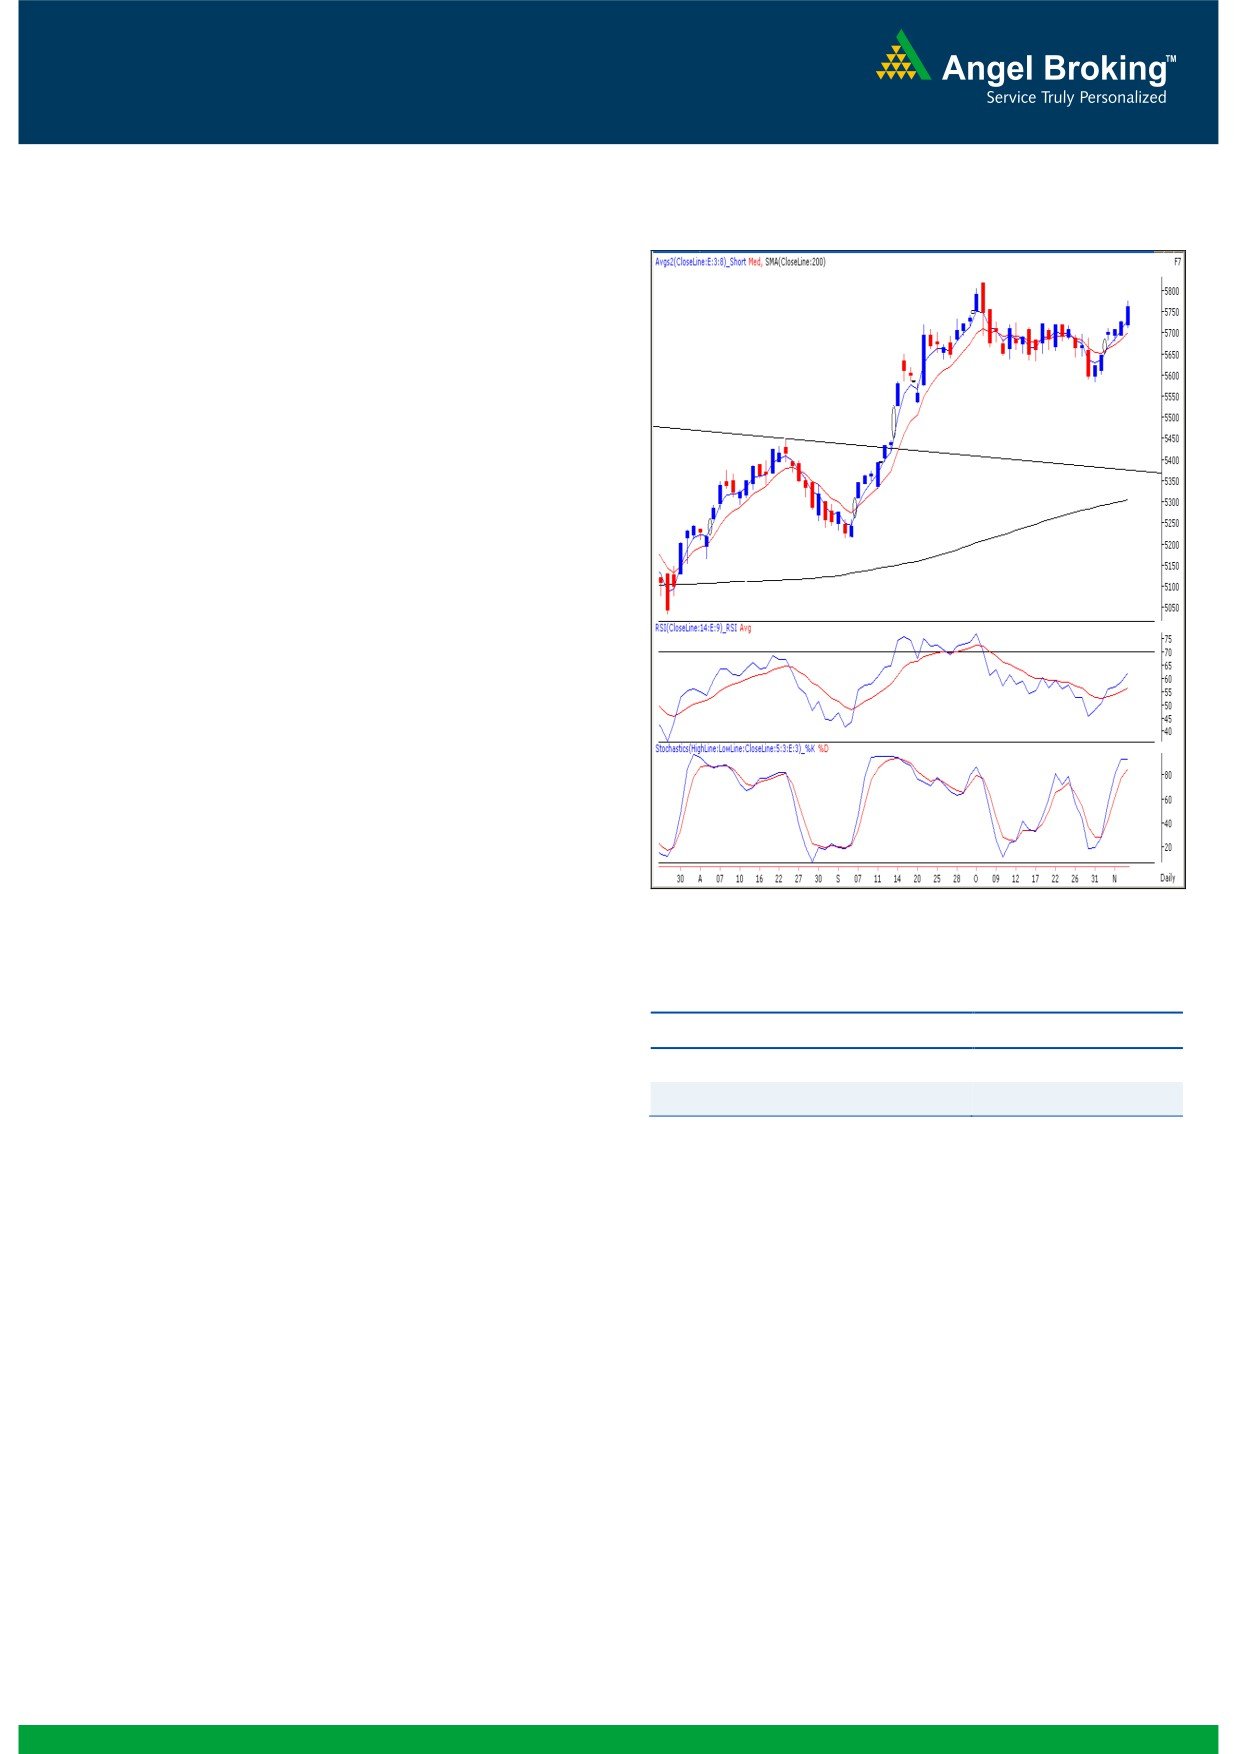
Exhibit 1: Nifty Daily Chart
Sensex (18902) / NIFTY (5760)
Yesterday, yet again our benchmark indices opened on a flat
note in-line with other Asian bourses. Post the US Presidential
Election results our markets surged higher amidst all the
major global indices. In the process, market finally managed
to conquer the stiff resistance level of 18885 / 5729 and
eventually closed well inside the positive territory. Almost all
the sectors contributed in yesterday’s rally. Among them
Realty, Banking and IT counters were the major gainers;
whereas Oil & Gas was the only sector which ended with
marginal loss. The advance to decline ratio was strongly in
favor of advancing counters (A=1672 D=1205) (Source -
Formation
The ’20-day EMA’ and the ’20-week EMA’ are placed at
18650 / 5669 and 18134 / 5502 levels, respectively.
The monthly ‘RSI’ oscillator is moving higher from the 50
mark and the positive in the ADX (9) indicator is intact.
The negative crossover in the weekly ‘Stochastic’
oscillator is still intact.
Source: Falcon:
The daily momentum oscillators and ‘3 & 8 EMA’ are
now signaling a positive crossover.
Actionable points:
The 38.2% and 50% Fibonacci Retracement levels of the
rise from 17250 to 19138 / 5216 to 5815 are placed at
View for the day
Neutral
18416 / 5586 and 18194 / 5515, respectively.
Resistance Levels
5778 - 5816
Trading strategy:
Support levels
5711- 5679
The much awaited breakout from the resistance level of
18885 / 5729 was finally seen during yesterday’s session. As
expected, all the positive technical evidences came into effect
and as a result, we witnessed a decent intraday rally
throughout the session. However the European as well as
American markets have slumped in yesterday’s trading
session as the focus now shifts to the fiscal cliff’s debate in
US. Considering these developments, we may witness
negative opening in our market in today’s session. On the
downside, the support levels are seen at 18786 - 18683 /
5711 - 5679. In the next few sessions we expect the market
to slump back into the range of 5630 to 5730, before any
decisive move on either side can be seen.
1
Daily Technical Report
November 08, 2012
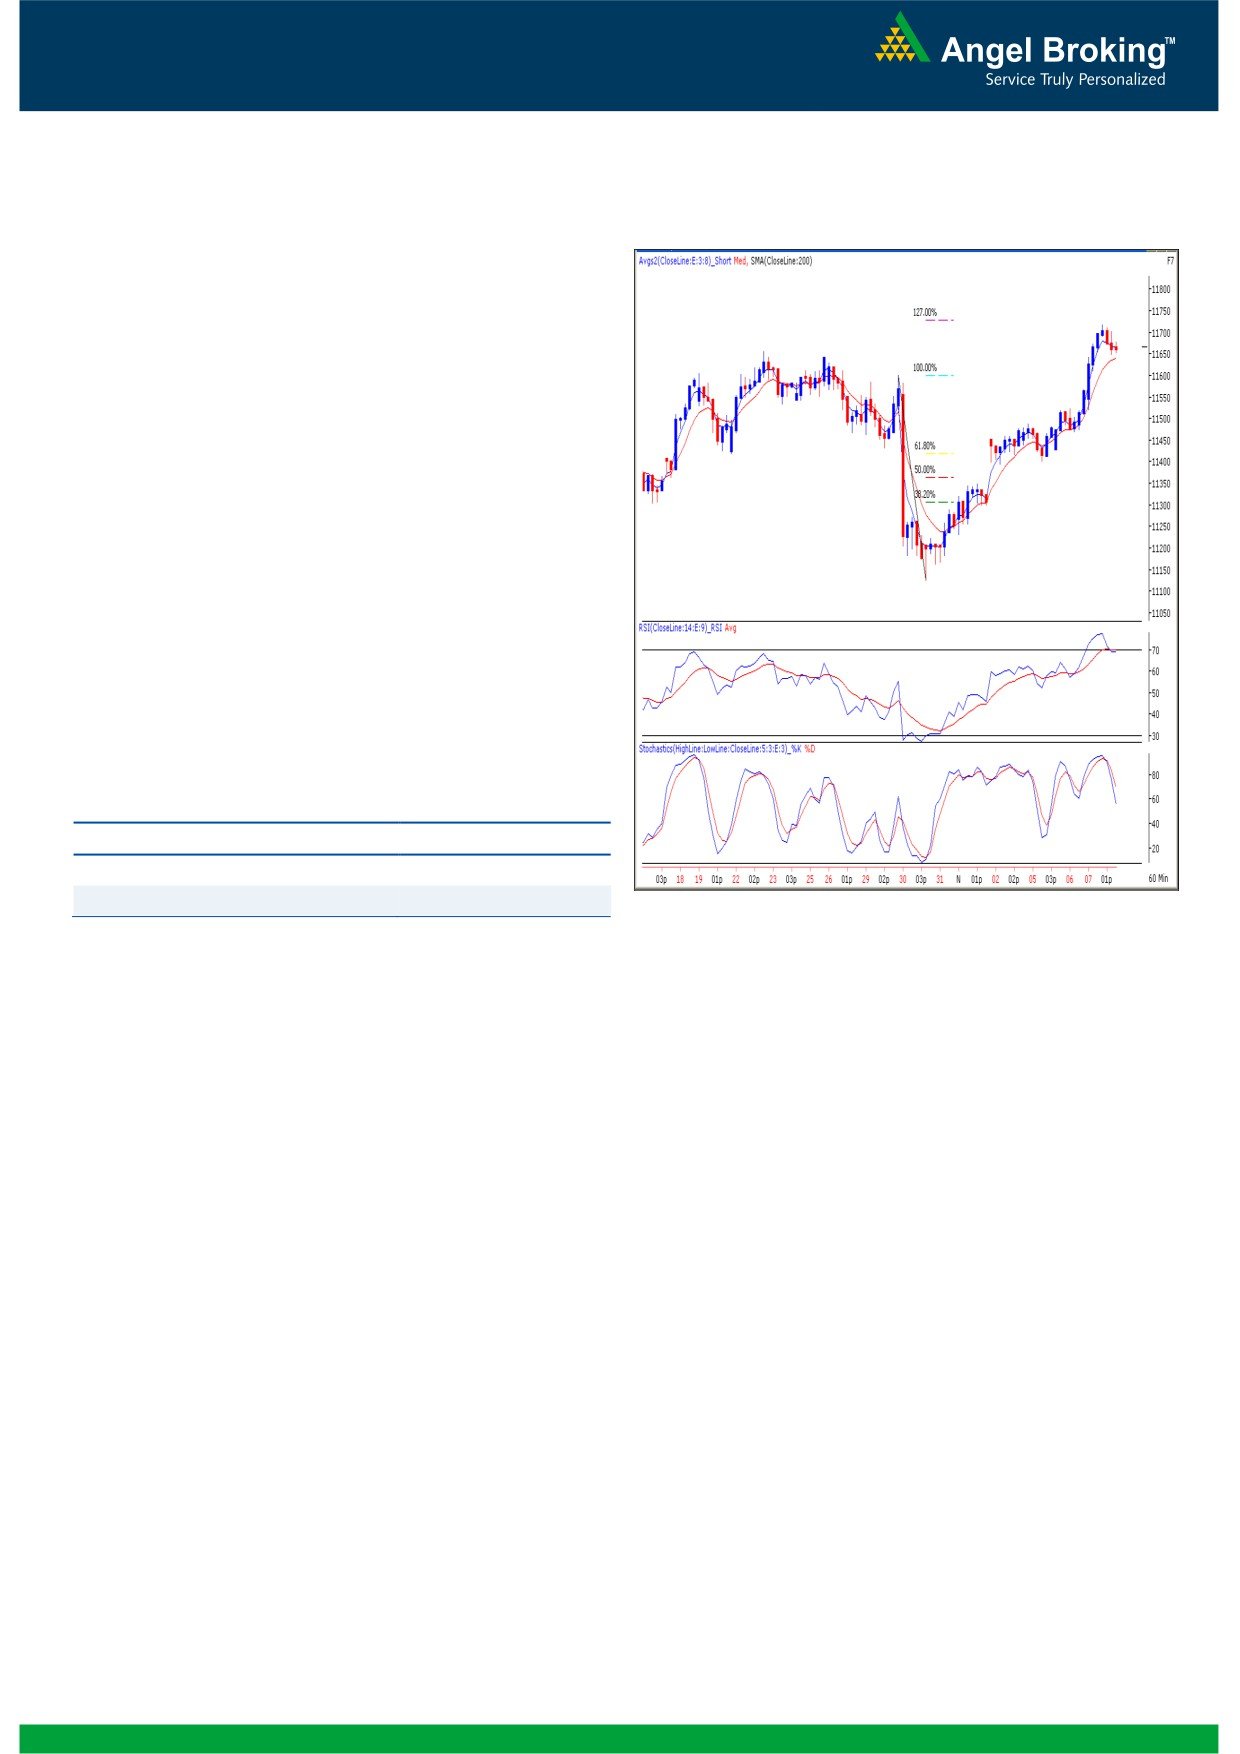
Exhibit 2: Bank Nifty Hourly Chart
Bank Nifty Outlook - (11666)
Yesterday, Bank Nifty opened on an optimistic note and
gained strength as the day progressed to close with a gain
of 1.10%. The index faced resistance near 127% Fibonacci
retracement of the fall from on 11600 - 11125 and
formed a “Bearish Engulfing” pattern on the hourly chart.
In addition we are also witnessing negative placement of
momentum oscillators “RSI” and “Stochastic” on the hourly
chart coupled with overbought condition of momentum
oscillator “RSI - Smoothened”. Looking at these technical
indicators we believe a correction in the index can be
expected if the index sustains below the 11648 level. In
this scenario the index is likely to drift lower towards the
11566 - 11468 levels. On the upside 11728 - 11774
levels are likely to act as resistance for the day.
Actionable points:
View for the day
Neutral
Resistance Levels
11728 - 11774
Support Levels
11566 - 11468
Source: Falcon:
2
Daily Technical Report
November 08, 2012
Daily Pivot Levels for Nifty 50 Stocks
SCRIPS
S2
S1
PIVOT
R1
R2
SENSEX
18,700
18,801
18,887
18,989
19,075
NIFTY
5,684
5,722
5,750
5,788
5,816
BANKNIFTY
11,435
11,550
11,635
11,750
11,834
ACC
1,450
1,461
1,471
1,482
1,491
AMBUJACEM
214
216
217
219
221
ASIANPAINT
4,066
4,093
4,119
4,146
4,172
AXISBANK
1,202
1,217
1,230
1,246
1,259
BAJAJ-AUTO
1,831
1,846
1,860
1,875
1,889
BANKBARODA
731
755
770
793
809
BHARTIARTL
262
267
274
278
285
BHEL
229
233
236
239
242
BPCL
338
339
340
341
343
CAIRN
326
329
331
333
335
CIPLA
389
393
397
401
405
COALINDIA
345
347
349
351
354
DLF
203
207
210
214
217
DRREDDY
1,755
1,774
1,792
1,812
1,830
GAIL
359
362
365
369
371
GRASIM
3,303
3,352
3,384
3,434
3,465
HCLTECH
601
609
615
622
628
HDFC
769
784
795
810
821
HDFCBANK
633
636
641
644
649
HEROMOTOCO
1,899
1,923
1,943
1,967
1,987
HINDALCO
111
112
113
115
116
HINDUNILVR
523
529
533
538
542
ICICIBANK
1,071
1,082
1,091
1,102
1,111
IDFC
158
162
165
170
173
INFY
2,359
2,382
2,398
2,421
2,437
ITC
286
288
289
291
293
JINDALSTEL
378
383
389
393
399
JPASSOCIAT
85
90
92
96
98
KOTAKBANK
620
625
629
634
638
LT
1,635
1,652
1,668
1,685
1,701
LUPIN
577
583
586
592
596
M&M
904
912
920
928
936
MARUTI
1,434
1,451
1,464
1,481
1,495
NTPC
166
168
169
171
172
ONGC
265
266
267
268
269
PNB
742
759
771
788
801
POWERGRID
118
119
120
121
121
RANBAXY
539
545
550
556
561
RELIANCE
794
797
801
805
809
RELINFRA
473
479
486
492
498
SBIN
2,139
2,178
2,204
2,243
2,269
SESAGOA
174
175
177
178
180
SIEMENS
696
701
707
712
718
SUNPHARMA
692
696
701
705
709
TATAMOTORS
263
266
270
273
277
TATAPOWER
102
103
104
105
107
TATASTEEL
393
397
401
406
409
TCS
1,317
1,324
1,329
1,336
1,341
ULTRACEMCO
1,990
2,007
2,018
2,035
2,046
WIPRO
363
365
368
371
374
3
Daily Technical Report
November 08, 2012
Research Team Tel: 022 - 39357800
DISCLAIMER
This document is solely for the personal information of the recipient, and must not be singularly used as the basis of any investment
decision. Nothing in this document should be construed as investment or financial advice. Each recipient of this document should make
such investigations as they deem necessary to arrive at an independent evaluation of an investment in the securities of the companies
referred to in this document (including the merits and risks involved), and should consult their own advisors to determine the merits and
risks of such an investment.
Angel Broking Limited, its affiliates, directors, its proprietary trading and investment businesses may, from time to time, make
investment decisions that are inconsistent with or contradictory to the recommendations expressed herein. The views contained in this
document are those of the analyst, and the company may or may not subscribe to all the views expressed within.
Reports based on technical and derivative analysis center on studying charts of a stock's price movement, outstanding positions and
trading volume, as opposed to focusing on a company's fundamentals and, as such, may not match with a report on a company's
fundamentals.
The information in this document has been printed on the basis of publicly available information, internal data and other reliable
sources believed to be true, but we do not represent that it is accurate or complete and it should not be relied on as such, as this
document is for general guidance only. Angel Broking Limited or any of its affiliates/ group companies shall not be in any way
responsible for any loss or damage that may arise to any person from any inadvertent error in the information contained in this report.
Angel Broking Limited has not independently verified all the information contained within this document. Accordingly, we cannot testify,
nor make any representation or warranty, express or implied, to the accuracy, contents or data contained within this document. While
Angel Broking Limited endeavours to update on a reasonable basis the information discussed in this material, there may be regulatory,
compliance, or other reasons that prevent us from doing so.
This document is being supplied to you solely for your information, and its contents, information or data may not be reproduced,
redistributed or passed on, directly or indirectly.
Angel Broking Limited and its affiliates may seek to provide or have engaged in providing corporate finance, investment banking or
other advisory services in a merger or specific transaction to the companies referred to in this report, as on the date of this report or in
the past.
Neither Angel Broking Limited, nor its directors, employees or affiliates shall be liable for any loss or damage that may arise from or in
connection with the use of this information.
Note: Please refer to the important `Stock Holding Disclosure' report on the Angel website (Research Section). Also, please refer to the
latest update on respective stocks for the disclosure status in respect of those stocks. Angel Broking Limited and its affiliates may have
investment positions in the stocks recommended in this report.
Research Team
Shardul Kulkarni
-
Head - Technicals
Sameet Chavan
-
Technical Analyst
Sacchitanand Uttekar
-
Technical Analyst
Mehul Kothari
-
Technical Analyst
Ankur Lakhotia
-
Technical Analyst
Angel Broking Pvt. Ltd.
Registered Office: G-1, Ackruti Trade Centre, Rd. No. 7, MIDC, Andheri (E), Mumbai - 400 093.
Corporate Office: 6th Floor, Ackruti Star, MIDC, Andheri (E), Mumbai - 400 093. Tel: (022) 3952 6600
Sebi Registration No: INB 010996539
4