Daily Technical Report
May 08, 2013
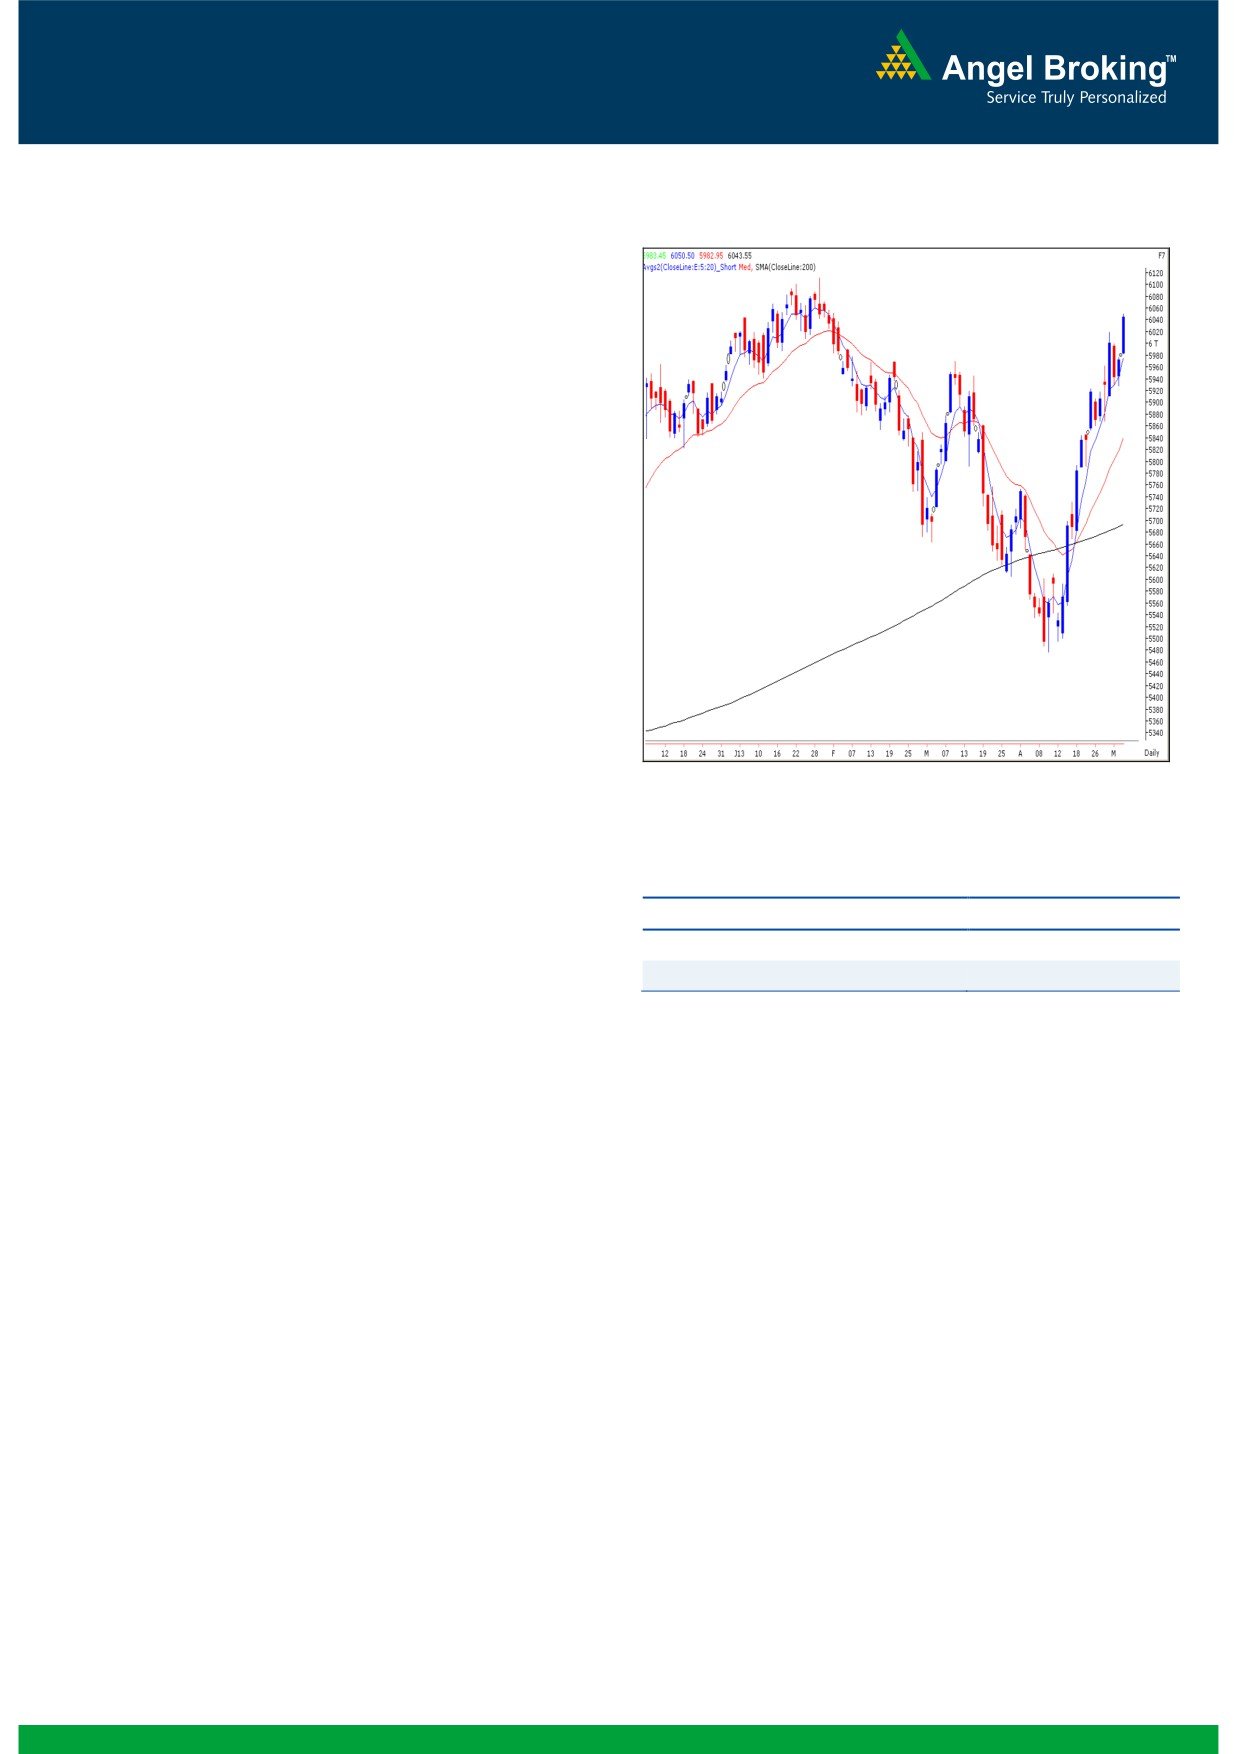
Exhibit 1: Nifty Daily Chart
Sensex (19889) / NIFTY (6044)
Yesterday, our benchmark indices opened slightly higher as
indicated by the SGX Nifty and then continued to climb up
gradually as the day progressed. As a result, we witnessed a
decent intraday rally, which eventually led indices to close at
a new 3 month high. For the day all the sectors ended on a
winning streak amongst which FMCG, Banking and Realty
stocks were among the major gainers. The advance to
decline ratio was in favor of advancing counters (A=1353
D=1064)
Formation
The ’20-week EMA’ and the ’20-day EMA’ are placed at
19166/ 5809 and 19241/ 5839 levels, respectively.
The weekly ADX (9) indicator and the ‘RSI-Smoothened’
oscillator have signaled a positive crossover.
Source: Falcon:
Actionable points:
Trading strategy:
Finally, indices came out of the range bound activity seen
View
Neutral
during past two trading sessions. Nifty has now closed above
Support levels
5980
the psychological level of 6000 for the first time after January
Resistance Levels
6072 - 6111
31, 2013. As mentioned in our earlier report, indices surged
towards 19792 / 6020 level after crossing Monday’s high of
19695 / 5977. Strong momentum in the latter half of the
session resulted in a further up move. Going forward, we
expect indices to test next resistance levels of 20074 - 20204
/ 6072 - 6112 if they manage to sustain above 19918 /
6051 level. On the flipside, 19792 / 5977 level would now
act as intraday support for our market.
1
Daily Technical Report
May 08, 2013
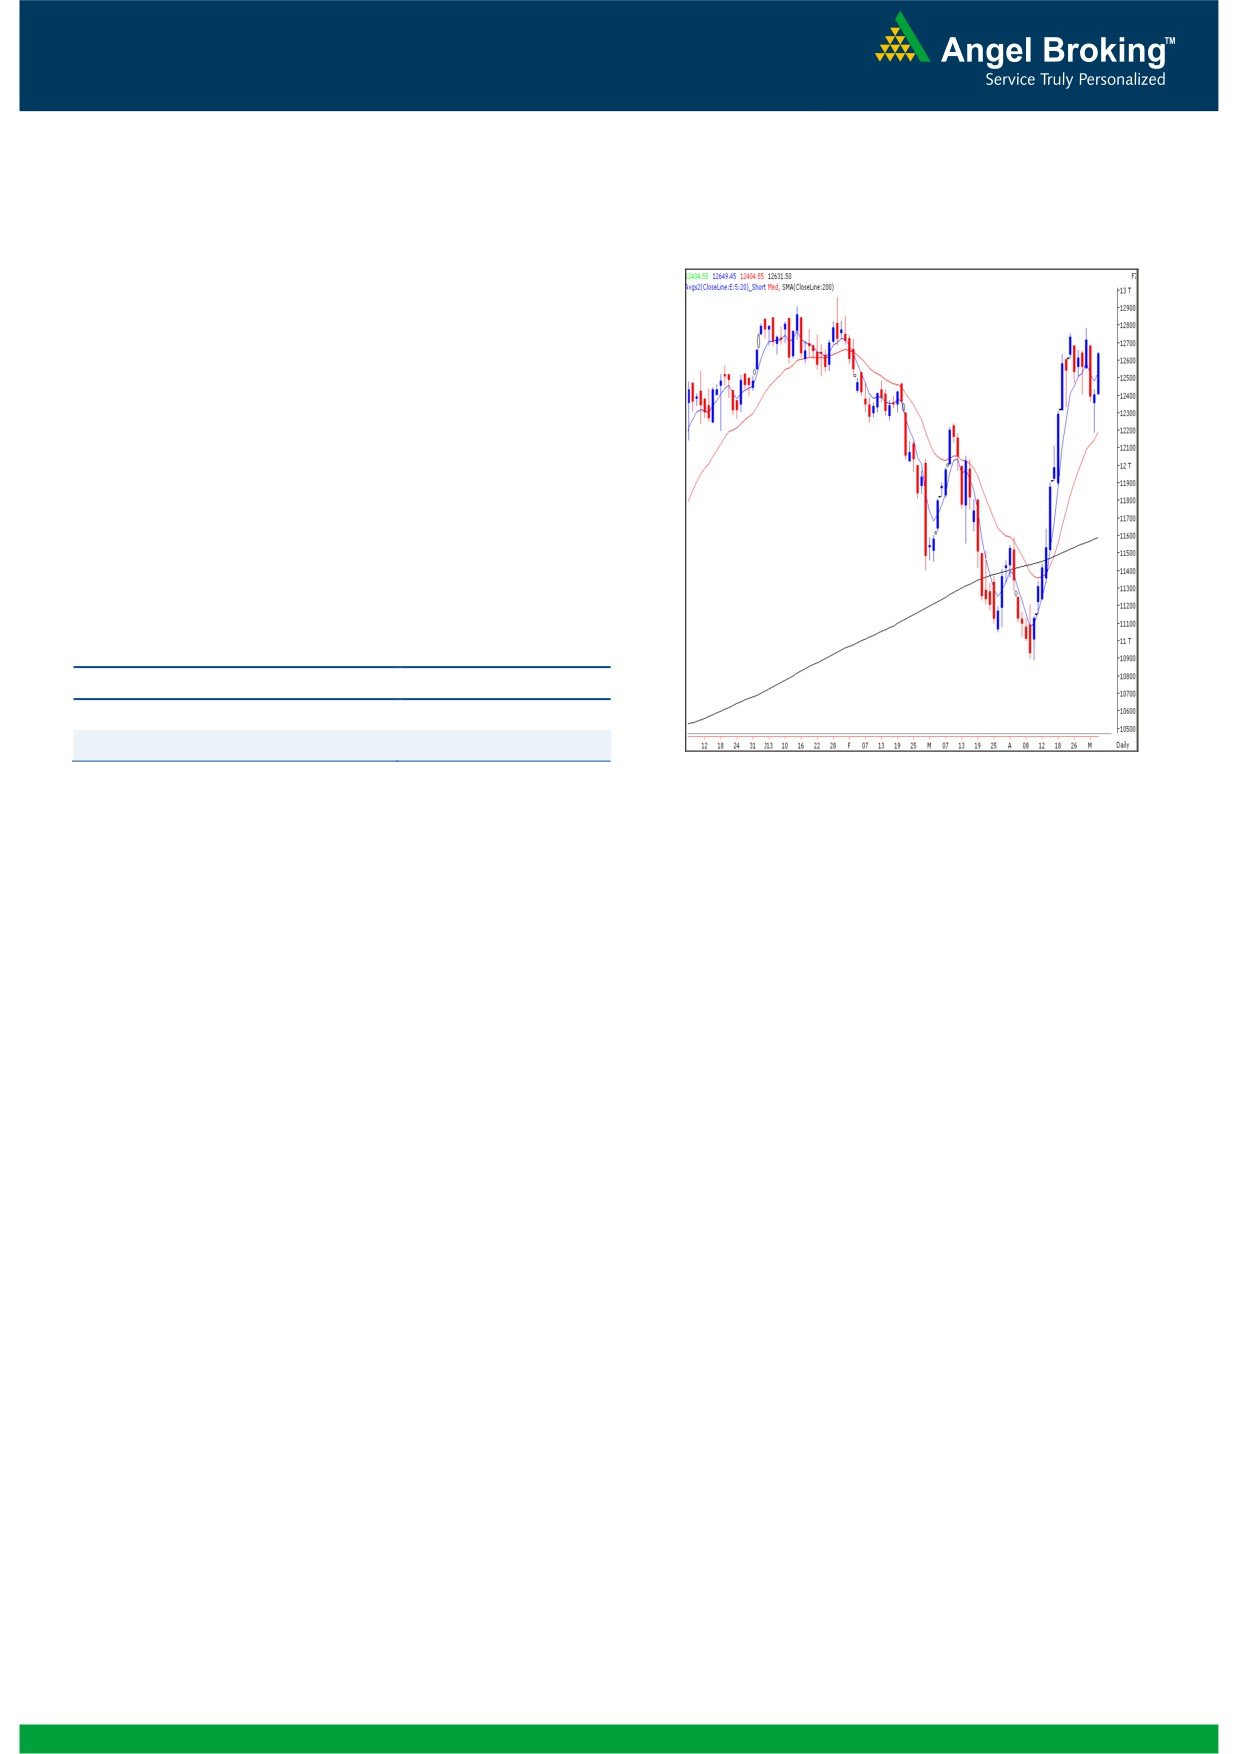
Exhibit 2: Bank Nifty Daily Chart
Bank Nifty Outlook - (12632)
Yesterday, Bank Nifty opened on an optimistic note and
gained strength as the day progressed to close near day’s
high. The buying interest was witnessed in most of the large
cap counters. The ‘Spinning Top’ candlestick pattern
mentioned in our previous report has been confirmed as the
index closed significantly above the 12396 mark. Thus if the
index sustains above yesterday’s high of 12650 then it is
likely to rally towards
12780 - 12850 levels. On the
downside 12470 - 12364 levels are likely to act as support
for the day.
Actionable points:
View
Bullish Above 12650
Expected Target
12780 - 12850
Support Levels
12470 - 12364
Source: Falcon:
2
Daily Technical Report
May 08, 2013
Research Team Tel: 022 - 30940000
DISCLAIMER
This document is solely for the personal information of the recipient, and must not be singularly used as the basis of any investment
decision. Nothing in this document should be construed as investment or financial advice. Each recipient of this document should make
such investigations as they deem necessary to arrive at an independent evaluation of an investment in the securities of the companies
referred to in this document (including the merits and risks involved), and should consult their own advisors to determine the merits and
risks of such an investment.
Angel Broking Limited, its affiliates, directors, its proprietary trading and investment businesses may, from time to time, make
investment decisions that are inconsistent with or contradictory to the recommendations expressed herein. The views contained in this
document are those of the analyst, and the company may or may not subscribe to all the views expressed within.
Reports based on technical and derivative analysis center on studying charts of a stock's price movement, outstanding positions and
trading volume, as opposed to focusing on a company's fundamentals and, as such, may not match with a report on a company's
fundamentals.
The information in this document has been printed on the basis of publicly available information, internal data and other reliable
sources believed to be true, but we do not represent that it is accurate or complete and it should not be relied on as such, as this
document is for general guidance only. Angel Broking Limited or any of its affiliates/ group companies shall not be in any way
responsible for any loss or damage that may arise to any person from any inadvertent error in the information contained in this report.
Angel Broking Limited has not independently verified all the information contained within this document. Accordingly, we cannot testify,
nor make any representation or warranty, express or implied, to the accuracy, contents or data contained within this document. While
Angel Broking Limited endeavors to update on a reasonable basis the information discussed in this material, there may be regulatory,
compliance, or other reasons that prevent us from doing so.
This document is being supplied to you solely for your information, and its contents, information or data may not be reproduced,
redistributed or passed on, directly or indirectly.
Angel Broking Limited and its affiliates may seek to provide or have engaged in providing corporate finance, investment banking or
other advisory services in a merger or specific transaction to the companies referred to in this report, as on the date of this report or in
the past.
Neither Angel Broking Limited, nor its directors, employees or affiliates shall be liable for any loss or damage that may arise from or in
connection with the use of this information.
Note: Please refer to the important `Stock Holding Disclosure' report on the Angel website (Research Section). Also, please refer to the
latest update on respective stocks for the disclosure status in respect of those stocks. Angel Broking Limited and its affiliates may have
investment positions in the stocks recommended in this report.
Research Team
Shardul Kulkarni
-
Head - Technicals
Sameet Chavan
-
Technical Analyst
Sacchitanand Uttekar
-
Technical Analyst
Ankur Lakhotia
-
Technical Analyst
Angel Broking Pvt. Ltd.
Registered Office: G-1, Ackruti Trade Centre, Rd. No. 7, MIDC, Andheri (E), Mumbai - 400 093.
Corporate Office: 6th Floor, Ackruti Star, MIDC, Andheri (E), Mumbai - 400 093. Tel: (022) 30940000
Sebi Registration No: INB 010996539
4