Daily Technical Report
April 08, 2013
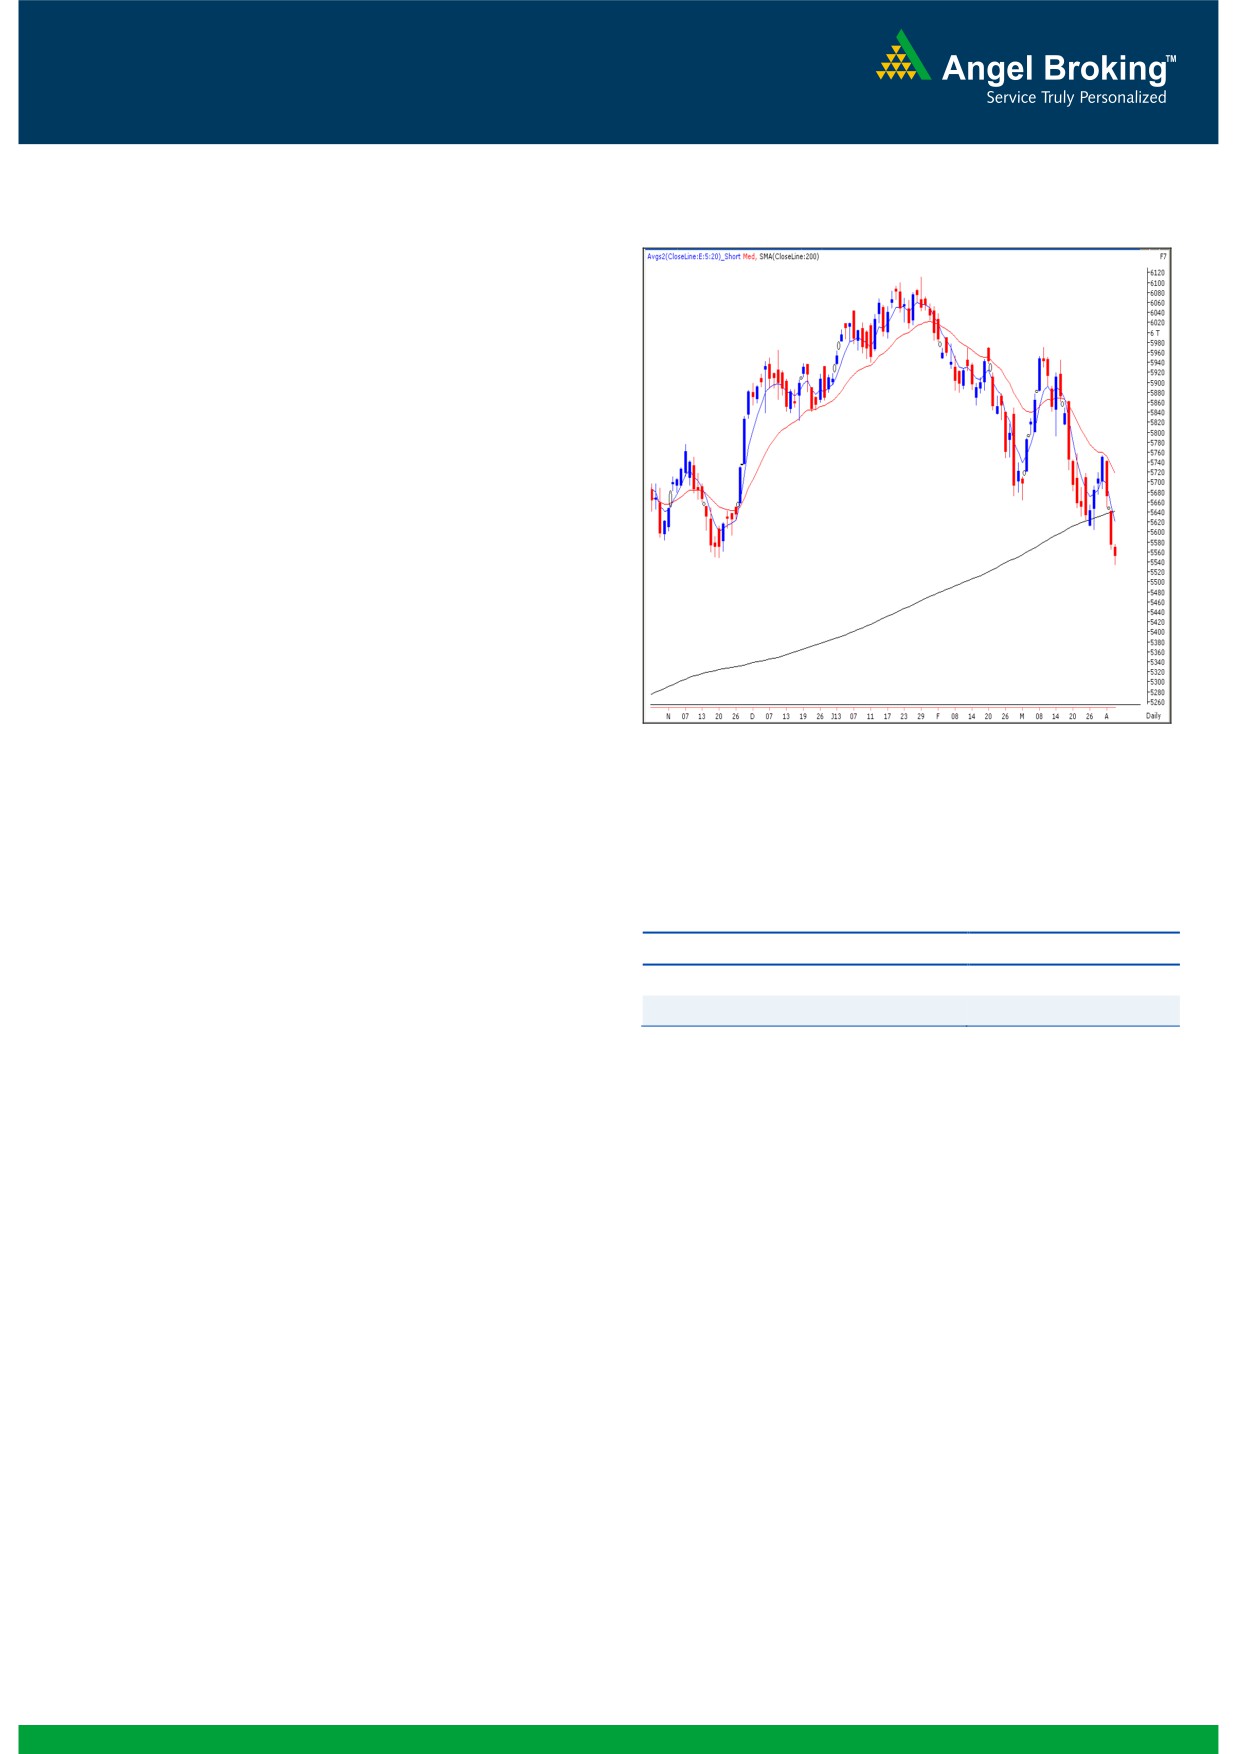
Exhibit 1: Nifty Daily Chart
Sensex (18450) / NIFTY (5553)
On Firday, indices opened on a pessimistic note and traded
with extreme volatility throughout the sesszion to close
marginally above the
5550 mark. FMCG, Consumer
Durables, and Capital Goods stocks were among the major
losers whereas Oil & Gas, Auto and Metal Counters ended
with gains. The advance to decline ratio was in favor of
advancing counters (A=1422 D=1306) (Source-
Formation
The ’20-week EMA’ and the ’20-day EMA’ are placed at
19094 / 5777 and 18941 / 5717 levels, respectively.
The ’89-week EMA’ and ‘200 Day SMA’ are placed at
18200 / 5500 and 18556 / 5640, respectively.
Source: Falcon:
The ‘Lower Top Lower Bottom’ formation on weekly
chart is still intact.
Actionable points:
Trading strategy:
The bulls finally had to surrender this week, as the
View
Neutral
benchmark indices gave a weekly closing below the
Resistance levels
5577 - 5605
psychological level of 18500 / 5600, which is for the first
Support levels
5500
time after November 16, 2012’s weekly candle. Indices are
now approaching the next support level at the weekly ’89-
The charts of global markets too appear weak and may add
EMA’ placed around 18200 / 5500 level. The momentum
on to the prevailing negative sentiment. A fall below 18200 /
oscillators on the daily charts are extremely oversold and the
5500 may reinforce selling pressure in the market. In this
possibility of a bounce thus cannot be ruled out. However,
scenario, we may witness a continuation of the concluded
week’s pessimism, possibly leading indices to slide towards
one must remember that to time the bounce will be difficult;
17976 / 5441 levels, or even further down. We advise
traders looking to initiating long positions should wait for the
traders to stay light on the positions and follow strict stop
indices to cross the Friday’s high of 18525 / 5577. Only a
losses. Initiating fresh short positions on the index at current
sustainable move beyond this level may push markets higher
levels is not recommended as the risk - reward ratio is not
to test the next resistance levels placed at 18727 - 18960 /
favorable and may incur losses.
5645 - 5720. On the other hand the ‘Lower Top - Lower
Bottom’ formation on the weekly chart is still intact and the
momentum on the down side is quite strong.
1
Daily Technical Report
April 08, 2013
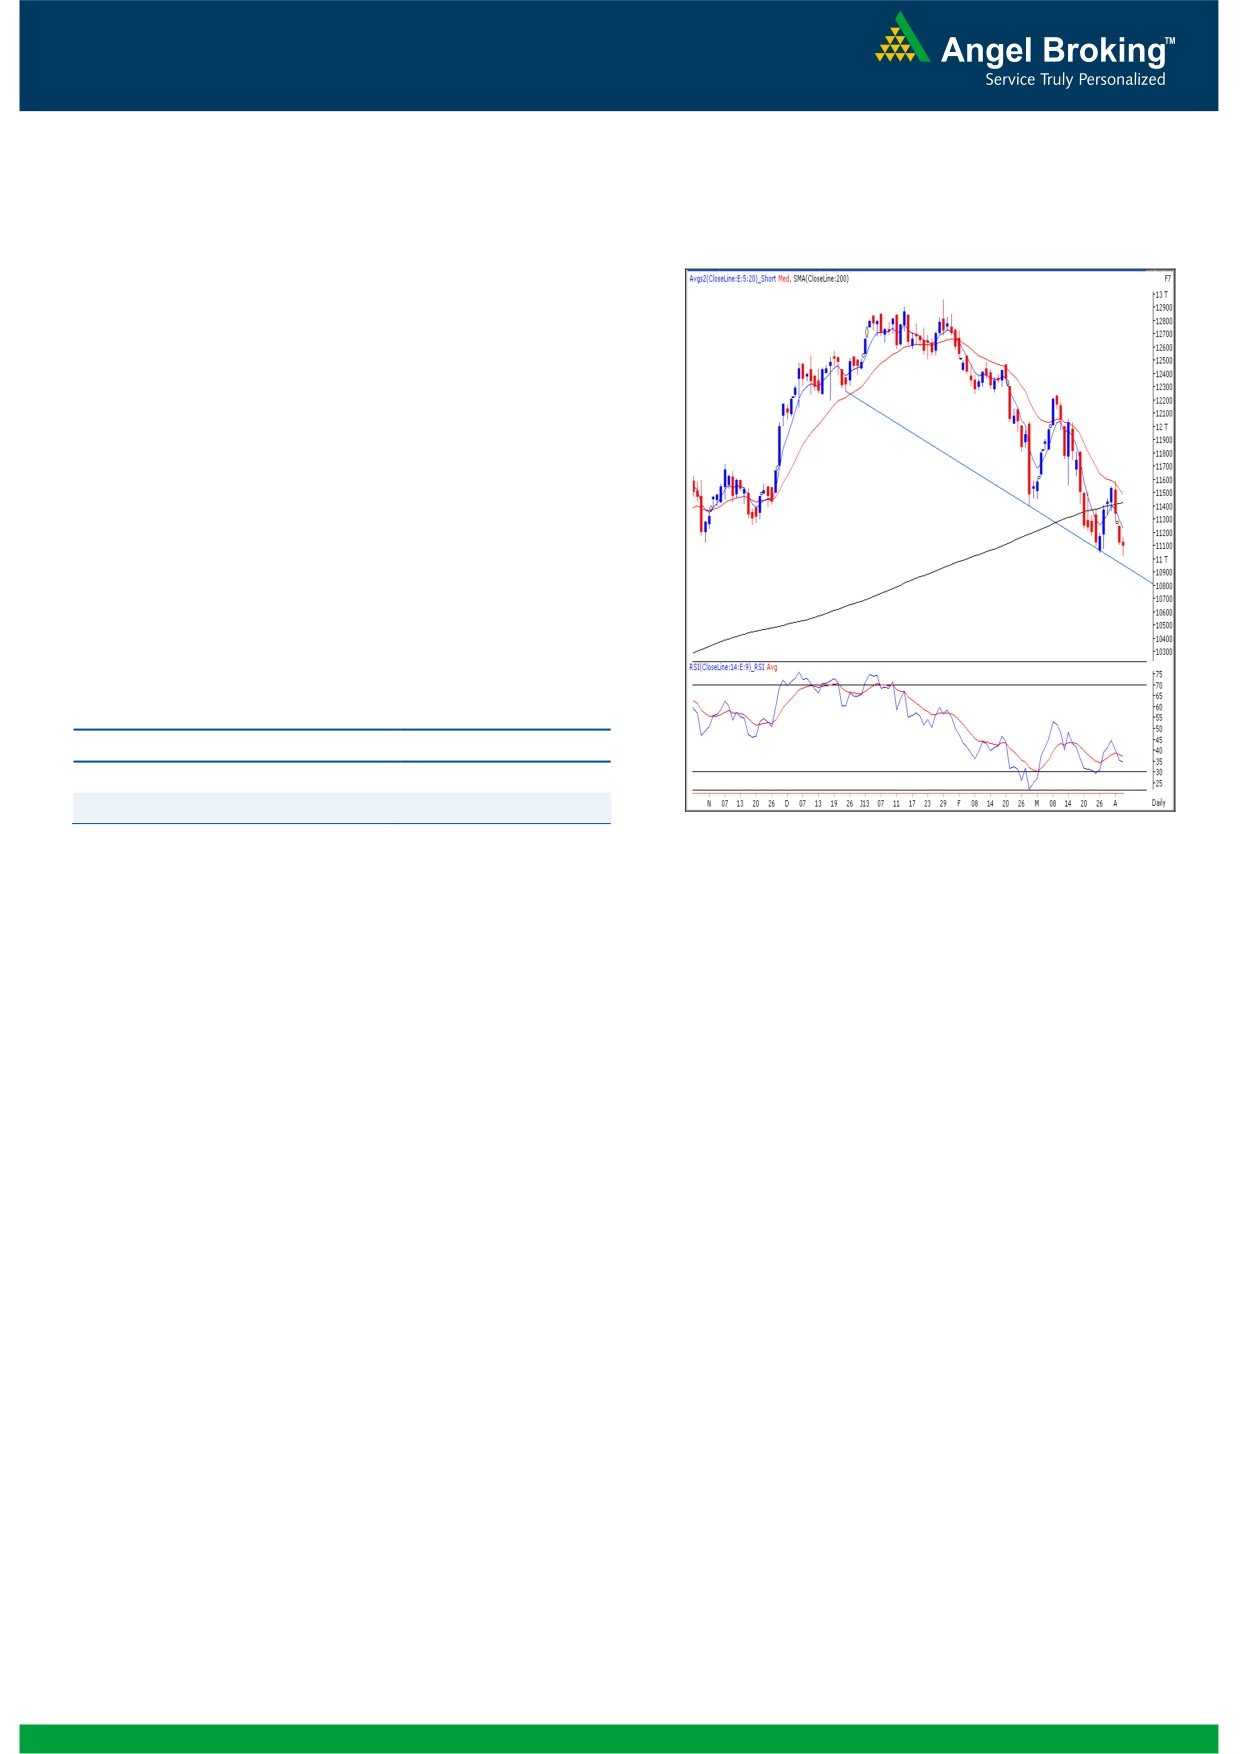
Exhibit 2: Bank Nifty Daily Chart
Bank Nifty Outlook - (11099)
On Friday, Bank Nifty opened on a flat note and traded
in a narrow range throughout the session to close with a
loss of
0.25%. During the day the index slipped
marginally below the 11048 level, however manged to
give a close above it. We are now witnessing a ‘Spinning
Top’ candlestick pattern on the daily chart. The mentioned
pattern requires confirmation in the form of a close above
the 11168 level. A breach of 11021 level would drag the
index lower towards the 10970 - 10887 levels. On the
upside
11168
-
11254 levels are likely to act as
resistance for the day. The mentioned pattern will be
negated only if the index closes below 11021 the level.
Actionable points:
View
Neutral
Resistance Levels
11168 - 11254
Support Levels
11021 - 10970
Source: Falcon:
2
Daily Technical Report
April 08, 2013
Daily Pivot Levels for Nifty 50 Stocks
SCRIPS
S2
S1
PIVOT
R1
R2
SENSEX
18,319
18,385
18,455
18,521
18,591
NIFTY
5,512
5,533
5,555
5,575
5,598
BANKNIFTY
10,949
11,024
11,096
11,171
11,243
ACC
1,090
1,110
1,126
1,146
1,163
AMBUJACEM
159
162
165
168
171
ASIANPAINT
4,679
4,723
4,777
4,821
4,874
AXISBANK
1,200
1,215
1,232
1,247
1,264
BAJAJ-AUTO
1,644
1,672
1,697
1,726
1,750
BANKBARODA
646
651
656
661
667
BHARTIARTL
259
265
272
278
285
BHEL
174
176
178
180
183
BPCL
364
370
376
382
387
CAIRN
281
285
289
293
296
CIPLA
378
382
386
391
395
COALINDIA
302
306
310
314
318
DLF
224
228
235
239
245
DRREDDY
1,848
1,880
1,905
1,937
1,962
GAIL
306
311
317
322
327
GRASIM
2,672
2,694
2,716
2,738
2,760
HCLTECH
732
745
755
767
777
HDFC
748
759
775
786
801
HDFCBANK
607
614
620
627
633
HEROMOTOCO
1,415
1,448
1,468
1,501
1,521
HINDALCO
87
88
89
91
92
HINDUNILVR
465
469
471
475
478
ICICIBANK
974
986
997
1,010
1,021
IDFC
136
139
142
144
147
INDUSINDBK
394
398
401
405
409
INFY
2,823
2,844
2,872
2,893
2,921
ITC
284
288
294
297
303
JINDALSTEL
322
329
335
341
347
JPASSOCIAT
62
63
64
65
66
KOTAKBANK
624
630
636
642
647
LT
1,324
1,337
1,354
1,367
1,385
LUPIN
602
610
622
630
642
M&M
819
828
841
851
864
MARUTI
1,289
1,348
1,386
1,445
1,483
NMDC
119
122
127
130
135
NTPC
136
139
142
144
147
ONGC
304
309
312
317
321
PNB
701
711
720
729
738
POWERGRID
103
104
104
105
106
RANBAXY
435
442
448
456
462
RELIANCE
762
771
777
786
791
RELINFRA
321
326
332
337
343
SBIN
2,019
2,038
2,061
2,080
2,103
SESAGOA
144
147
149
152
154
SUNPHARMA
842
851
860
869
878
TATAMOTORS
247
251
256
260
266
TATAPOWER
94
94
95
96
97
TATASTEEL
299
304
308
314
318
TCS
1,472
1,485
1,497
1,510
1,523
ULTRACEMCO
1,714
1,743
1,766
1,795
1,818
3
Daily Technical Report
April 08, 2013
Research Team Tel: 022 - 30940000
DISCLAIMER
This document is solely for the personal information of the recipient, and must not be singularly used as the basis of any investment
decision. Nothing in this document should be construed as investment or financial advice. Each recipient of this document should make
such investigations as they deem necessary to arrive at an independent evaluation of an investment in the securities of the companies
referred to in this document (including the merits and risks involved), and should consult their own advisors to determine the merits and
risks of such an investment.
Angel Broking Limited, its affiliates, directors, its proprietary trading and investment businesses may, from time to time, make
investment decisions that are inconsistent with or contradictory to the recommendations expressed herein. The views contained in this
document are those of the analyst, and the company may or may not subscribe to all the views expressed within.
Reports based on technical and derivative analysis center on studying charts of a stock's price movement, outstanding positions and
trading volume, as opposed to focusing on a company's fundamentals and, as such, may not match with a report on a company's
fundamentals.
The information in this document has been printed on the basis of publicly available information, internal data and other reliable
sources believed to be true, but we do not represent that it is accurate or complete and it should not be relied on as such, as this
document is for general guidance only. Angel Broking Limited or any of its affiliates/ group companies shall not be in any way
responsible for any loss or damage that may arise to any person from any inadvertent error in the information contained in this report.
Angel Broking Limited has not independently verified all the information contained within this document. Accordingly, we cannot testify,
nor make any representation or warranty, express or implied, to the accuracy, contents or data contained within this document. While
Angel Broking Limited endeavors to update on a reasonable basis the information discussed in this material, there may be regulatory,
compliance, or other reasons that prevent us from doing so.
This document is being supplied to you solely for your information, and its contents, information or data may not be reproduced,
redistributed or passed on, directly or indirectly.
Angel Broking Limited and its affiliates may seek to provide or have engaged in providing corporate finance, investment banking or
other advisory services in a merger or specific transaction to the companies referred to in this report, as on the date of this report or in
the past.
Neither Angel Broking Limited, nor its directors, employees or affiliates shall be liable for any loss or damage that may arise from or in
connection with the use of this information.
Note: Please refer to the important `Stock Holding Disclosure' report on the Angel website (Research Section). Also, please refer to the
latest update on respective stocks for the disclosure status in respect of those stocks. Angel Broking Limited and its affiliates may have
investment positions in the stocks recommended in this report.
Research Team
Shardul Kulkarni
-
Head - Technicals
Sameet Chavan
-
Technical Analyst
Sacchitanand Uttekar
-
Technical Analyst
Ankur Lakhotia
-
Technical Analyst
Angel Broking Pvt. Ltd.
Registered Office: G-1, Ackruti Trade Centre, Rd. No. 7, MIDC, Andheri (E), Mumbai - 400 093.
Corporate Office: 6th Floor, Ackruti Star, MIDC, Andheri (E), Mumbai - 400 093. Tel: (022) 30940000
Sebi Registration No: INB 010996539
4