Daily Technical Report
March 08, 2013
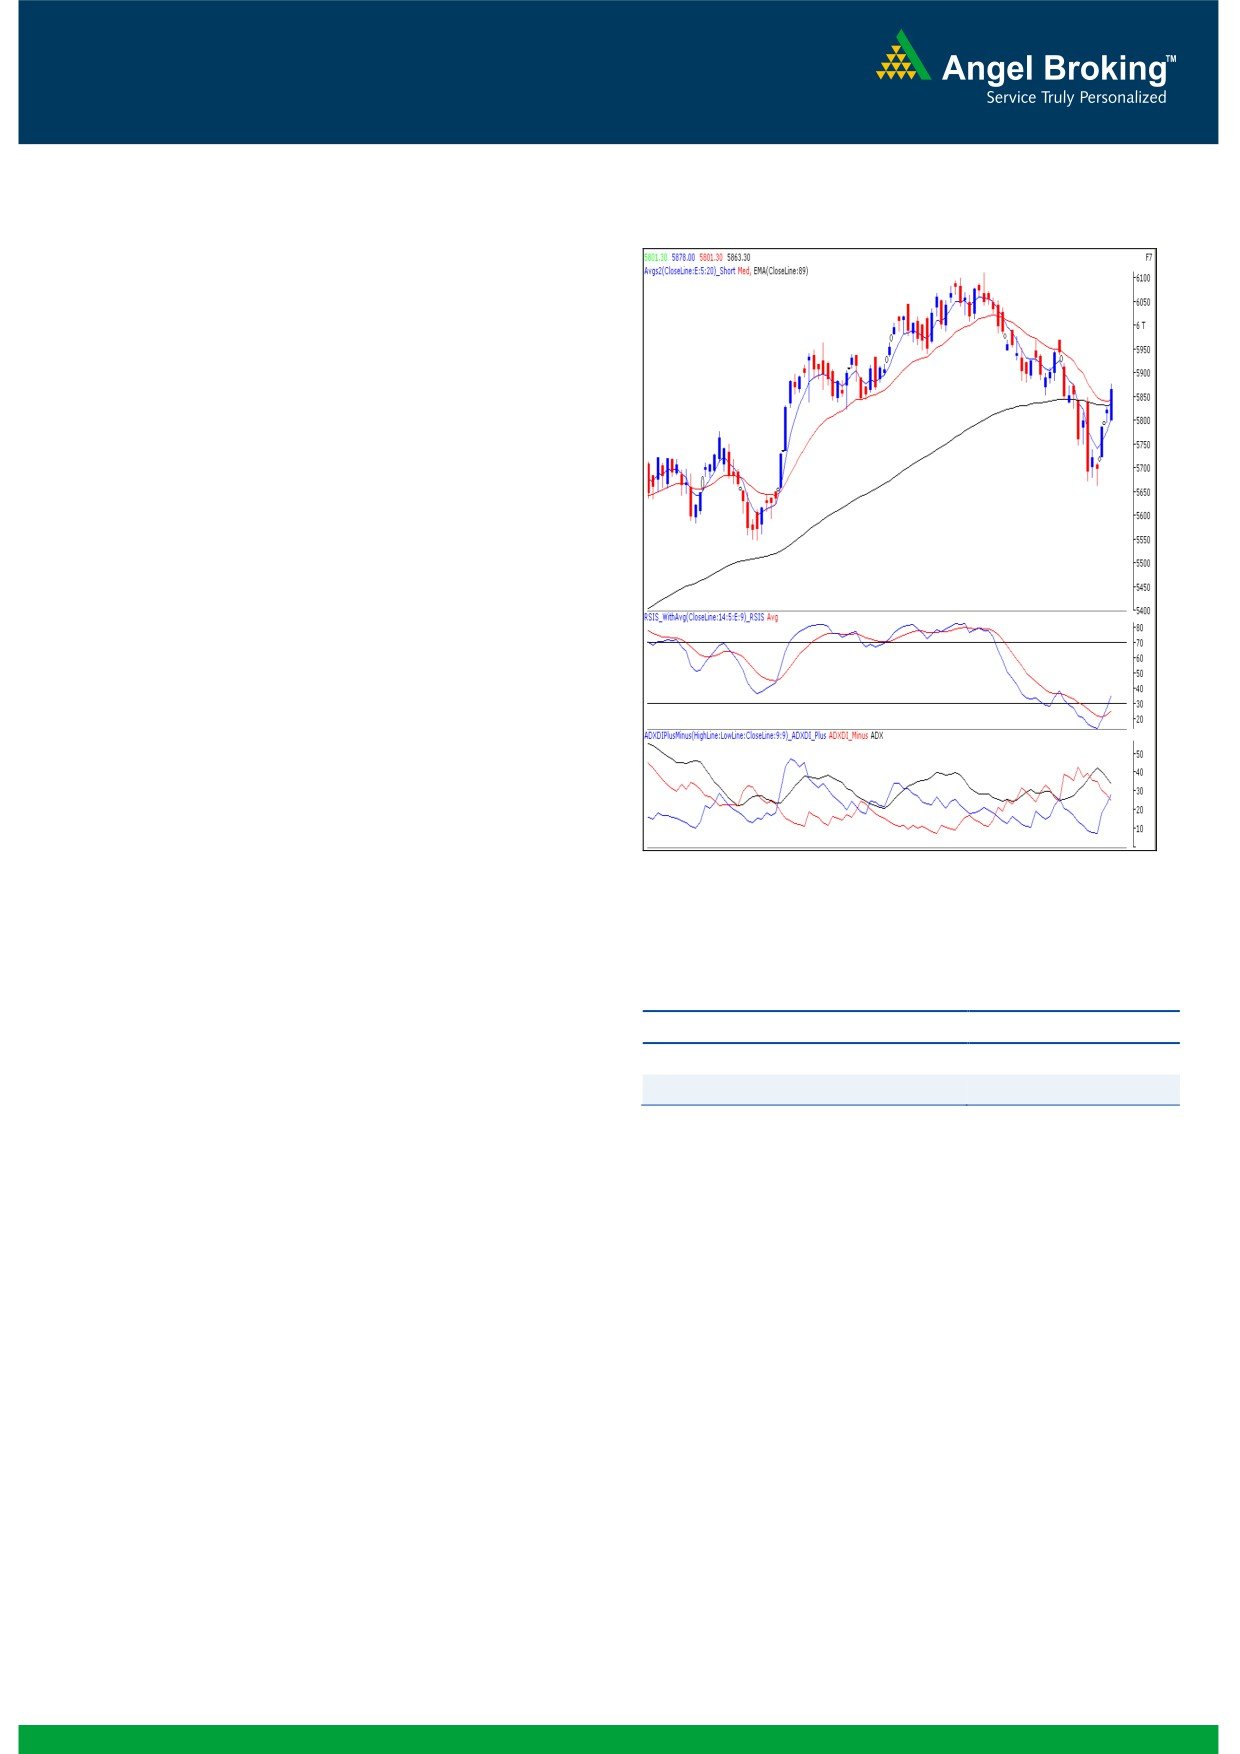
Exhibit 1: Nifty Daily Chart
Sensex (19414) / NIFTY (5863)
Yesterday, indices opened on a muted note in-line with
mixed global cues and then slipped into consolidation mode
to trade within half a percent range for major part of the
session. However, we witnessed a sudden spurt during the
last hour and markets closed at the highest point of the day.
During the day, most of the sectors ended on the gaining
side except for Consumer Durables and Metal counters
which ended with marginal losses. The advance to decline
ratio was in favor of advancing counters (A=1523 D=1307)
Formation
The ’20-day EMA’ and the ’20-week EMA’ are placed at
19308 / 5839 and 19175 / 5813 levels, respectively.
The monthly chart exhibits a ‘Bearish Engulfing’ pattern.
The monthly momentum oscillators are signaling a
negative crossover.
Source: Falcon:
The level of the weekly ‘RSI’ momentum oscillator has
now dropped below the 50 mark.
Indices have closed marginally above the ‘Downward
Actionable points:
Sloping Trend Line’, drawn by joining two significant
highs of 21109 / 6339 (high of November 05, 2010
View
Neutral
weekly candle) and 19137 / 5816 (high of October 05,
2012 weekly candle).
Support Levels
5795
Resistance levels
5880 - 5921
Trading strategy:
Yesterday, Indices opened flat and then soared sharply
during the latter part of the session. In this process, indices
managed to traverse the stiff resistance zone '20-day EMA' as
well as '89-day EMA'. This up move was supported by the
humongous volumes in Nifty future during the last half an
hour of the session. As a result, indices eventually closed
convincingly above the stiff resistance of 19322 / 5850. We
are now observing a positive crossover in daily 'RSI
-
Smoothened' momentum oscillator and the 'ADX 9' indicator.
Also, a closing above '20-day EMA' indicates possibility of a
further upside in coming trading session if the markets trade
convincingly above yesterday’s high of 19466 / 5880. In this
scenario we may witness a rally towards 19554 - 19620 /
5920 - 5950. On the flipside, 19322 - 19239 / 5850 -
5820 would act as a key support for our market. Only a
move below Wednesday's low of 19195 / 5795 may result
into a loss of optimism seen during yesterday's session.
1
Daily Technical Report
March 08, 2013
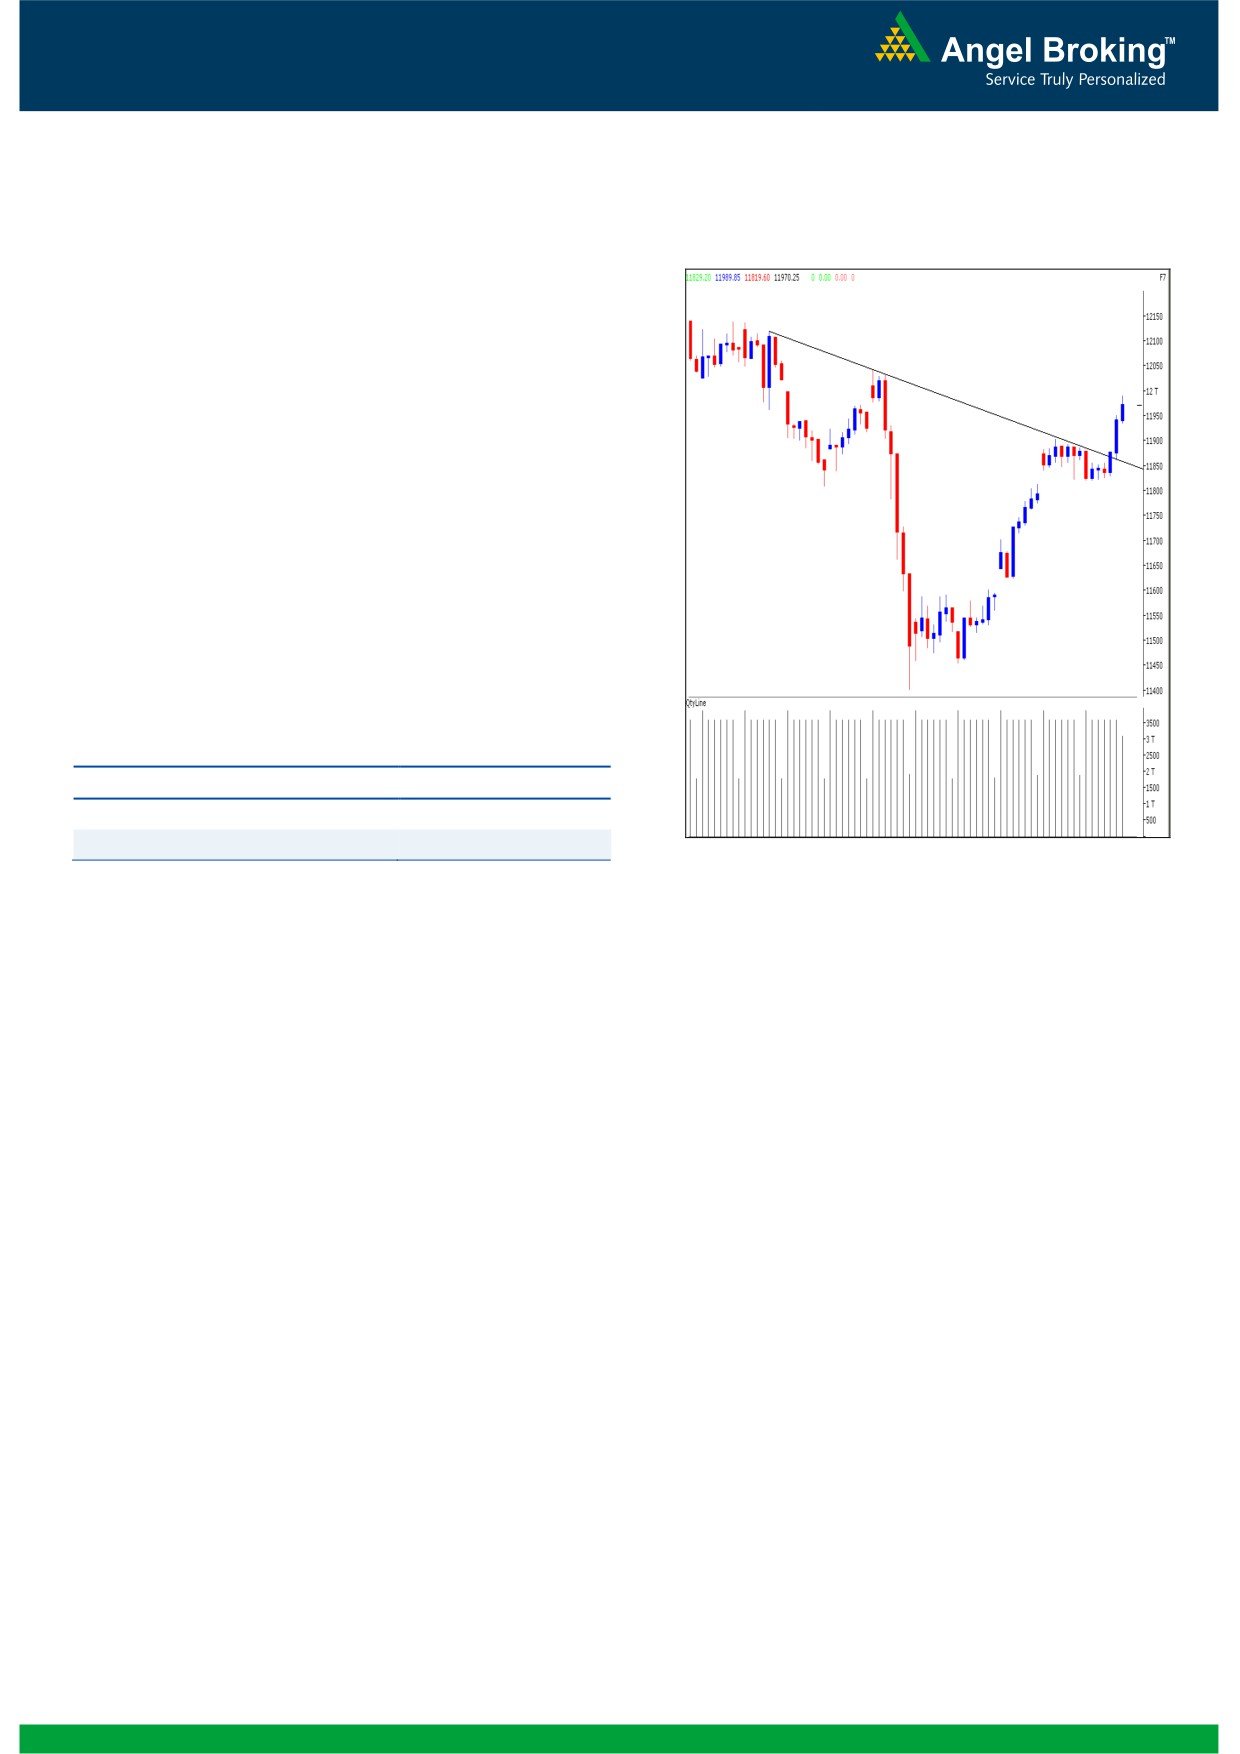
Exhibit 2: Bank Nifty Daily Chart
Bank Nifty Outlook - (11970)
Yesterday, Bank Nifty opened on a flat note in line with
our benchmark indices and traded in a narrow range
during major part of the session. However, buying interest
during the last hour of trade led the index to cross the stiff
resistance of 11910 and headed towards the 12000 mark.
On the hourly chart we are now witnessing a trend line
breakout and clear signs of ‘Higher Top Higher Bottom’.
The positive momentum is likely to continue if the index
sustains above the 12040 level. In this scenario the index
is likely to rally towards 12135 - 12250 mark. On the
downside 11852 - 11819 levels are likely to act as
support for the day.
Actionable points:
View
Bullish Above 12040
Expected target
12135 - 12250
Support Levels
11852 - 11819
Source: Falcon:
2
Daily Technical Report
March 08, 2013
Research Team Tel: 022 - 30940000
DISCLAIMER
This document is solely for the personal information of the recipient, and must not be singularly used as the basis of any investment
decision. Nothing in this document should be construed as investment or financial advice. Each recipient of this document should make
such investigations as they deem necessary to arrive at an independent evaluation of an investment in the securities of the companies
referred to in this document (including the merits and risks involved), and should consult their own advisors to determine the merits and
risks of such an investment.
Angel Broking Limited, its affiliates, directors, its proprietary trading and investment businesses may, from time to time, make
investment decisions that are inconsistent with or contradictory to the recommendations expressed herein. The views contained in this
document are those of the analyst, and the company may or may not subscribe to all the views expressed within.
Reports based on technical and derivative analysis center on studying charts of a stock's price movement, outstanding positions and
trading volume, as opposed to focusing on a company's fundamentals and, as such, may not match with a report on a company's
fundamentals.
The information in this document has been printed on the basis of publicly available information, internal data and other reliable
sources believed to be true, but we do not represent that it is accurate or complete and it should not be relied on as such, as this
document is for general guidance only. Angel Broking Limited or any of its affiliates/ group companies shall not be in any way
responsible for any loss or damage that may arise to any person from any inadvertent error in the information contained in this report.
Angel Broking Limited has not independently verified all the information contained within this document. Accordingly, we cannot testify,
nor make any representation or warranty, express or implied, to the accuracy, contents or data contained within this document. While
Angel Broking Limited endeavours to update on a reasonable basis the information discussed in this material, there may be regulatory,
compliance, or other reasons that prevent us from doing so.
This document is being supplied to you solely for your information, and its contents, information or data may not be reproduced,
redistributed or passed on, directly or indirectly.
Angel Broking Limited and its affiliates may seek to provide or have engaged in providing corporate finance, investment banking or
other advisory services in a merger or specific transaction to the companies referred to in this report, as on the date of this report or in
the past.
Neither Angel Broking Limited, nor its directors, employees or affiliates shall be liable for any loss or damage that may arise from or in
connection with the use of this information.
Note: Please refer to the important `Stock Holding Disclosure' report on the Angel website (Research Section). Also, please refer to the
latest update on respective stocks for the disclosure status in respect of those stocks. Angel Broking Limited and its affiliates may have
investment positions in the stocks recommended in this report.
Research Team
Shardul Kulkarni
-
Head - Technicals
Sameet Chavan
-
Technical Analyst
Sacchitanand Uttekar
-
Technical Analyst
Ankur Lakhotia
-
Technical Analyst
Angel Broking Pvt. Ltd.
Registered Office: G-1, Ackruti Trade Centre, Rd. No. 7, MIDC, Andheri (E), Mumbai - 400 093.
Corporate Office: 6th Floor, Ackruti Star, MIDC, Andheri (E), Mumbai - 400 093. Tel: (022) 30940000
Sebi Registration No: INB 010996539
4