Daily Technical Report
February 08, 2013
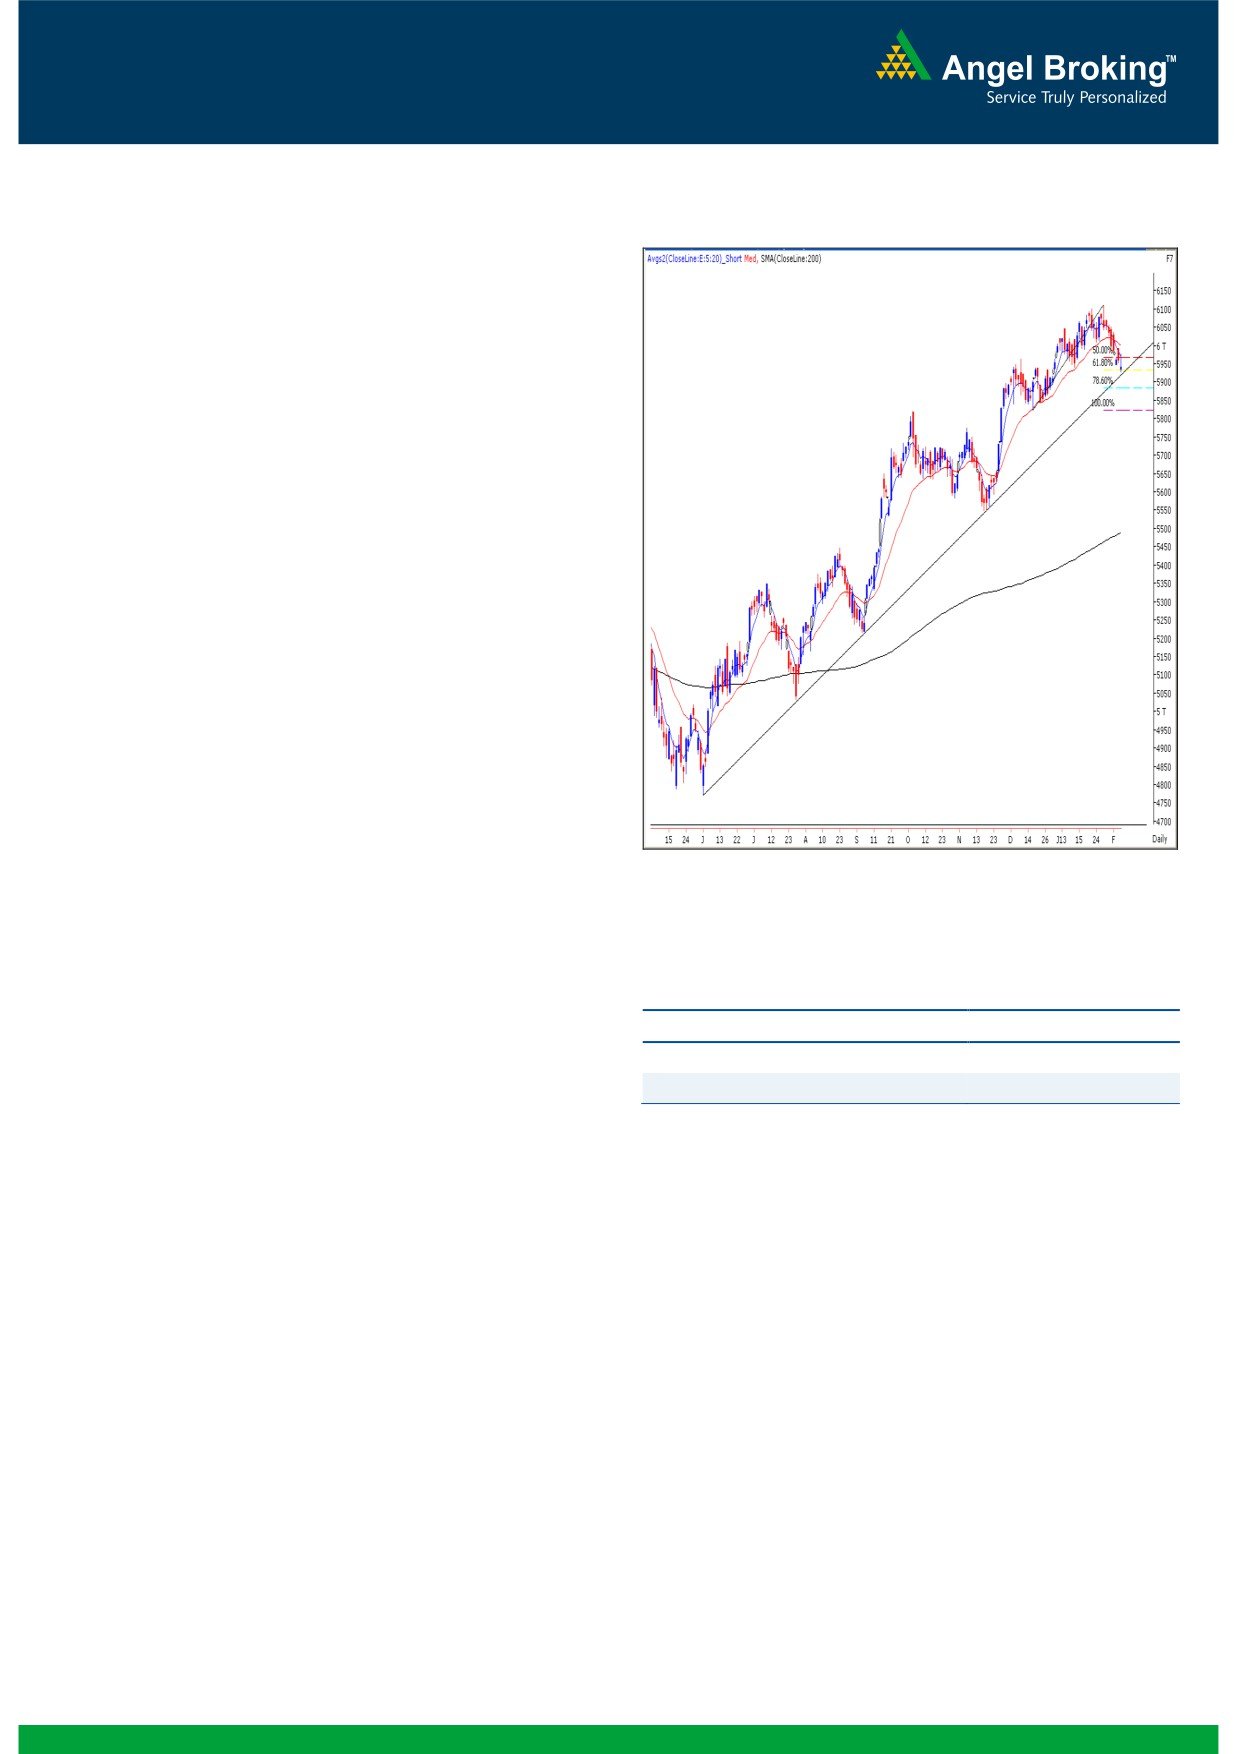
Exhibit 1: Nifty Daily Chart
Sensex (19580) / NIFTY (5939)
Yesterday, indices opened marginally lower in-line with
mixed global cues and moved higher during the initial hour
of the session; but post midsession indices once again gave
away all their gains to eventually close in the negative
territory. Consumer Durables, Realty and Power were the
most beaten down stocks in yesterday’s trading session.
However, IT, Auto and FMCG counters provided descent
support to the markets. The advance to decline ratio was
strongly in favor of declining counters (A=799 D=1378)
Formation
The ’20-day EMA’ and the ’20-week EMA’ are placed at
19798 / 5999 and 19171 / 5817 levels, respectively.
On the daily chart, the benchmark indices are facing
resistance near the ‘Upward Sloping Trend Line’ drawn
by joining the highs of October 5, 2012 and January
18, 2012.
Source: Falcon:
The weekly ‘RSI’ momentum oscillator as well as the
Daily ‘ADX (9)’ indicator are now signaling a negative
crossover.
Actionable points:
The ‘Hanging Man’ Japanese Candlestick pattern on the
weekly chart has been confirmed.
View
Neutral
Resistance Levels
5979 - 6000
Support Levels
5927 - 5897
Trading strategy:
Similar to Wednesday’s session, our benchmark indices
However, a sustainable price action below this trend line
faced tremendous resistance near hourly ’20-EMA. Strong
would lead to a break down from this strong support zone.
selling pressure led indices to sneak marginally below
This may trigger immense pessimism in the market. In this
mentioned support level of 19596 / 5940; but managed to
scenario, indices may slide to test 19406 - 19150 / 5897 -
close around it. Indices are now hovering near the 61.8%
5823 levels.
Fibonacci retracement level of the rise from 19149 / 5823
(low on December 18, 2012) to 20204 / 6112 (high on
January 29, 2013). Moreover, we are observing an ‘Upward
Sloping Trend Line’ drawn from the important swing low of
15748 / 4770 (low on June 4, 2012). This trend line has
been tested for nearly 3 - 4 times and each time prices have
managed to bounce from it. Also, considering ‘Narrow
Range’ body formation on daily chart, possibility of a bounce
cannot be ruled out. Hence, any sustainable move beyond
yesterday’s high of 19703 / 5979 may push indices higher
towards 19800 - 19865 / 6000 - 6020 levels.
1
Daily Technical Report
February 08, 2013
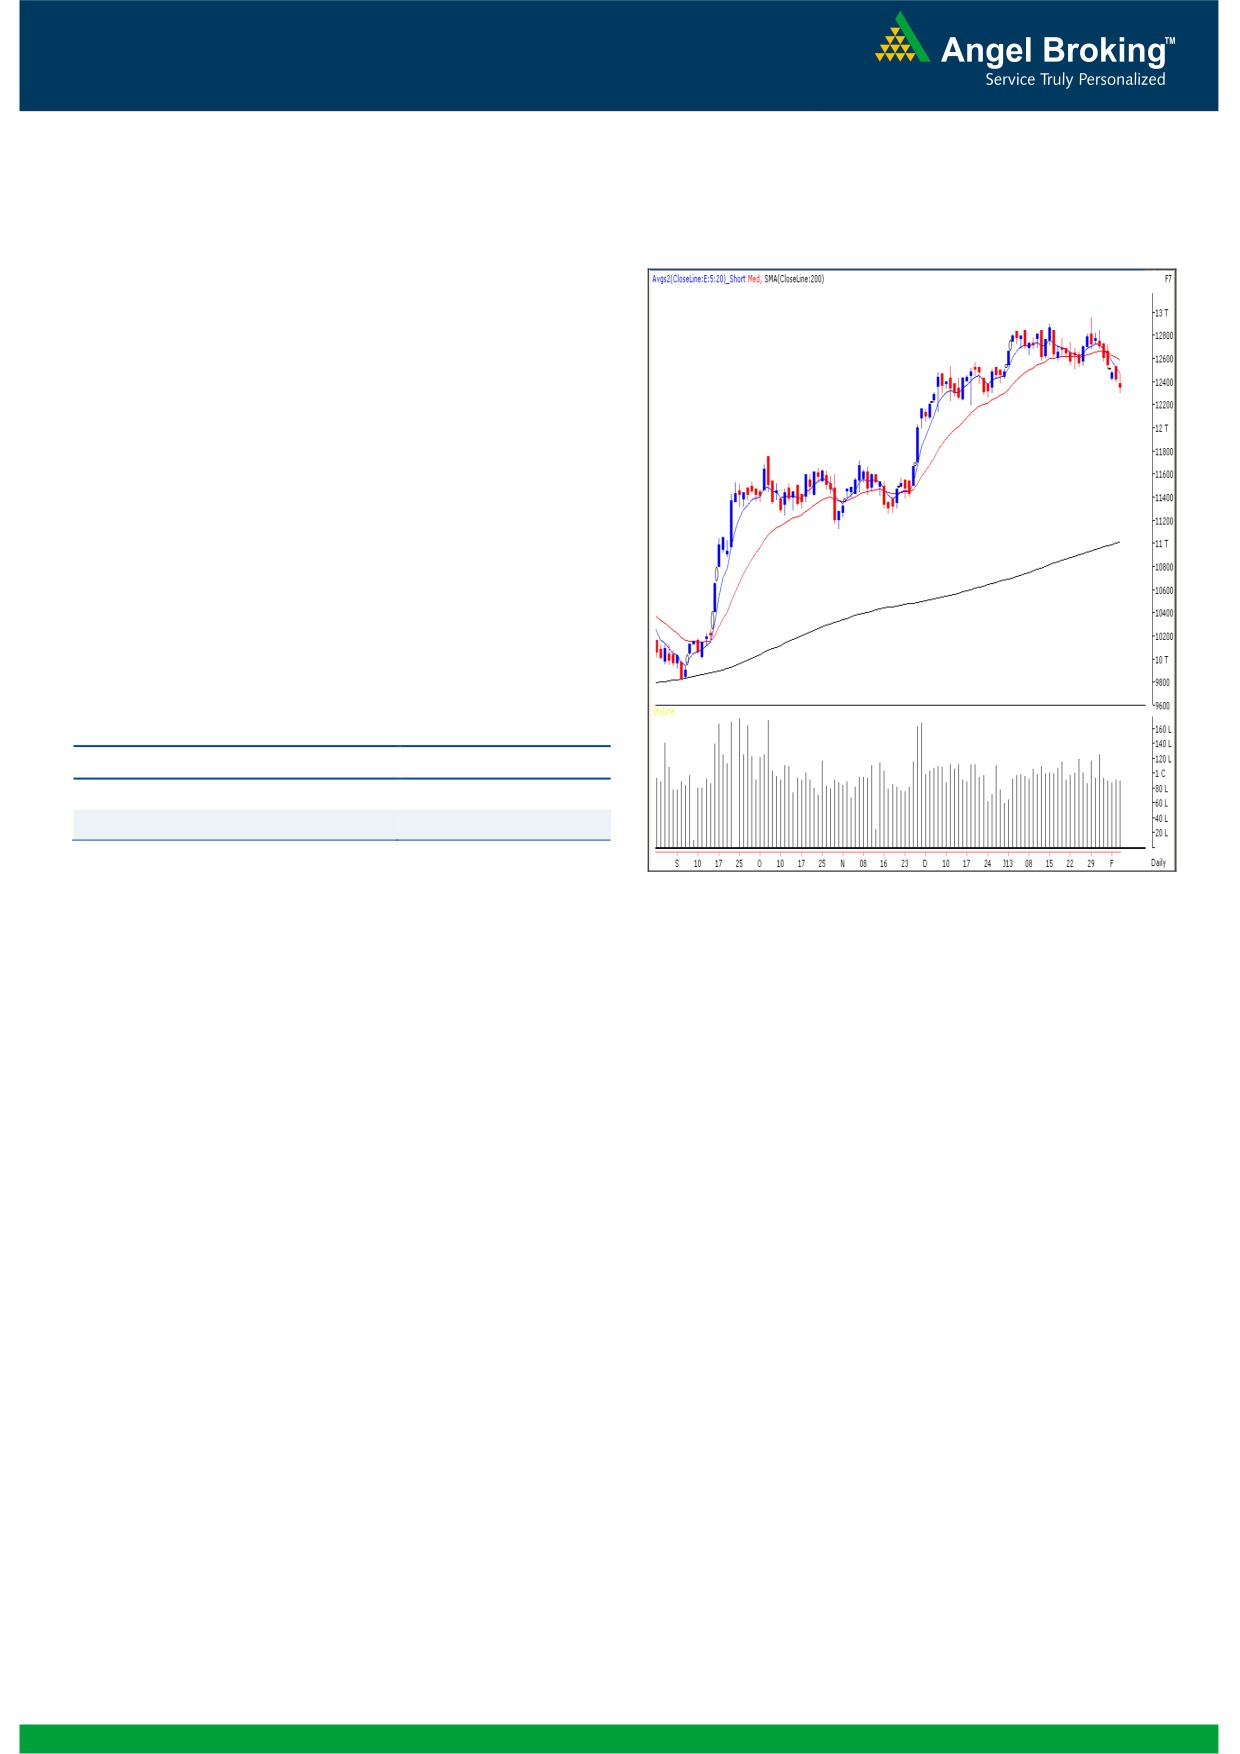
Exhibit 2: Bank Nifty Daily Chart
Bank Nifty Outlook - (12349)
Yesterday, in line with our benchmark indices Bank Nifty too
opened with a downside gap and traded with extreme
volatility to close near the initial opening level. At this
juncture we are witnessing positive divergence in “RSI”
momentum oscillator on the hourly chart coupled with
oversold condition of momentum oscillator “RSI
-
Smoothened”. The effect of the above mentioned technical
evidences would be seen only if the index sustains above
12475 level. On the upside 12475 - 12534 levels are likely
to act as resistance for the day. Traders should note that a
breach below the 12305 level may attract significant selling
pressure and Indices may then test 12197 - 12100 levels.
Actionable points:
View
Neutral
Resistance Levels
12475 - 12534
Support Levels
12197 - 12100
Source: Falcon:
2
Daily Technical Report
February 08, 2013
Daily Pivot Levels for Nifty 50 Stocks
SCRIPS
S2
S1
PIVOT
R1
R2
SENSEX
19,445
19,513
19,608
19,675
19,770
NIFTY
5,897
5,918
5,948
5,969
5,999
BANKNIFTY
12,207
12,278
12,376
12,447
12,545
ACC
1,311
1,328
1,338
1,355
1,366
AMBUJACEM
195
197
202
204
208
ASIANPAINT
4,563
4,583
4,614
4,635
4,666
AXISBANK
1,440
1,450
1,466
1,476
1,492
BAJAJ-AUTO
2,043
2,053
2,067
2,078
2,092
BANKBARODA
746
759
781
795
817
BHARTIARTL
310
315
321
326
332
BHEL
201
204
207
209
213
BPCL
401
406
413
418
426
CAIRN
316
318
322
324
327
CIPLA
388
391
396
399
404
COALINDIA
336
340
343
347
350
DLF
264
267
271
274
278
DRREDDY
1,867
1,881
1,897
1,911
1,928
GAIL
328
332
338
341
347
GRASIM
3,001
3,030
3,049
3,078
3,097
HCLTECH
662
666
669
672
675
HDFC
792
801
811
821
831
HDFCBANK
631
636
640
645
648
HEROMOTOCO
1,734
1,745
1,758
1,769
1,783
HINDALCO
111
112
114
115
116
HINDUNILVR
449
453
455
459
462
ICICIBANK
1,119
1,132
1,149
1,162
1,180
IDFC
158
160
161
164
165
INFY
2,771
2,780
2,790
2,799
2,808
ITC
300
302
304
306
307
JINDALSTEL
411
415
420
424
429
JPASSOCIAT
71
72
74
75
77
KOTAKBANK
679
683
689
694
700
LT
1,473
1,485
1,498
1,510
1,523
LUPIN
583
589
597
603
610
M&M
876
886
893
903
909
MARUTI
1,607
1,615
1,622
1,629
1,636
NTPC
146
147
149
150
152
ONGC
314
317
320
323
327
PNB
863
870
880
887
897
POWERGRID
108
110
111
113
114
RANBAXY
429
433
438
442
447
RELIANCE
861
867
874
880
888
RELINFRA
482
491
505
515
529
SBIN
2,293
2,310
2,337
2,354
2,381
SESAGOA
168
171
175
178
182
SIEMENS
612
616
623
627
634
SUNPHARMA
740
745
750
754
759
TATAMOTORS
283
286
288
291
294
TATAPOWER
95
96
98
99
100
TATASTEEL
384
387
393
396
401
TCS
1,350
1,369
1,379
1,398
1,408
ULTRACEMCO
1,868
1,895
1,935
1,961
2,002
WIPRO
398
402
405
409
411
3
Daily Technical Report
February 08, 2013
Research Team Tel: 022 - 30940000
DISCLAIMER
This document is solely for the personal information of the recipient, and must not be singularly used as the basis of any investment
decision. Nothing in this document should be construed as investment or financial advice. Each recipient of this document should make
such investigations as they deem necessary to arrive at an independent evaluation of an investment in the securities of the companies
referred to in this document (including the merits and risks involved), and should consult their own advisors to determine the merits and
risks of such an investment.
Angel Broking Limited, its affiliates, directors, its proprietary trading and investment businesses may, from time to time, make
investment decisions that are inconsistent with or contradictory to the recommendations expressed herein. The views contained in this
document are those of the analyst, and the company may or may not subscribe to all the views expressed within.
Reports based on technical and derivative analysis center on studying charts of a stock's price movement, outstanding positions and
trading volume, as opposed to focusing on a company's fundamentals and, as such, may not match with a report on a company's
fundamentals.
The information in this document has been printed on the basis of publicly available information, internal data and other reliable
sources believed to be true, but we do not represent that it is accurate or complete and it should not be relied on as such, as this
document is for general guidance only. Angel Broking Limited or any of its affiliates/ group companies shall not be in any way
responsible for any loss or damage that may arise to any person from any inadvertent error in the information contained in this report.
Angel Broking Limited has not independently verified all the information contained within this document. Accordingly, we cannot testify,
nor make any representation or warranty, express or implied, to the accuracy, contents or data contained within this document. While
Angel Broking Limited endeavours to update on a reasonable basis the information discussed in this material, there may be regulatory,
compliance, or other reasons that prevent us from doing so.
This document is being supplied to you solely for your information, and its contents, information or data may not be reproduced,
redistributed or passed on, directly or indirectly.
Angel Broking Limited and its affiliates may seek to provide or have engaged in providing corporate finance, investment banking or
other advisory services in a merger or specific transaction to the companies referred to in this report, as on the date of this report or in
the past.
Neither Angel Broking Limited, nor its directors, employees or affiliates shall be liable for any loss or damage that may arise from or in
connection with the use of this information.
Note: Please refer to the important `Stock Holding Disclosure' report on the Angel website (Research Section). Also, please refer to the
latest update on respective stocks for the disclosure status in respect of those stocks. Angel Broking Limited and its affiliates may have
investment positions in the stocks recommended in this report.
Research Team
Shardul Kulkarni
-
Head - Technicals
Sameet Chavan
-
Technical Analyst
Sacchitanand Uttekar
-
Technical Analyst
Mehul Kothari
-
Technical Analyst
Ankur Lakhotia
-
Technical Analyst
Angel Broking Pvt. Ltd.
Registered Office: G-1, Ackruti Trade Centre, Rd. No. 7, MIDC, Andheri (E), Mumbai - 400 093.
Corporate Office: 6th Floor, Ackruti Star, MIDC, Andheri (E), Mumbai - 400 093. Tel: (022) 30940000
Sebi Registration No: INB 010996539
4