Daily Technical Report
January 08, 2013
Sensex (19691) / NIFTY (5988)
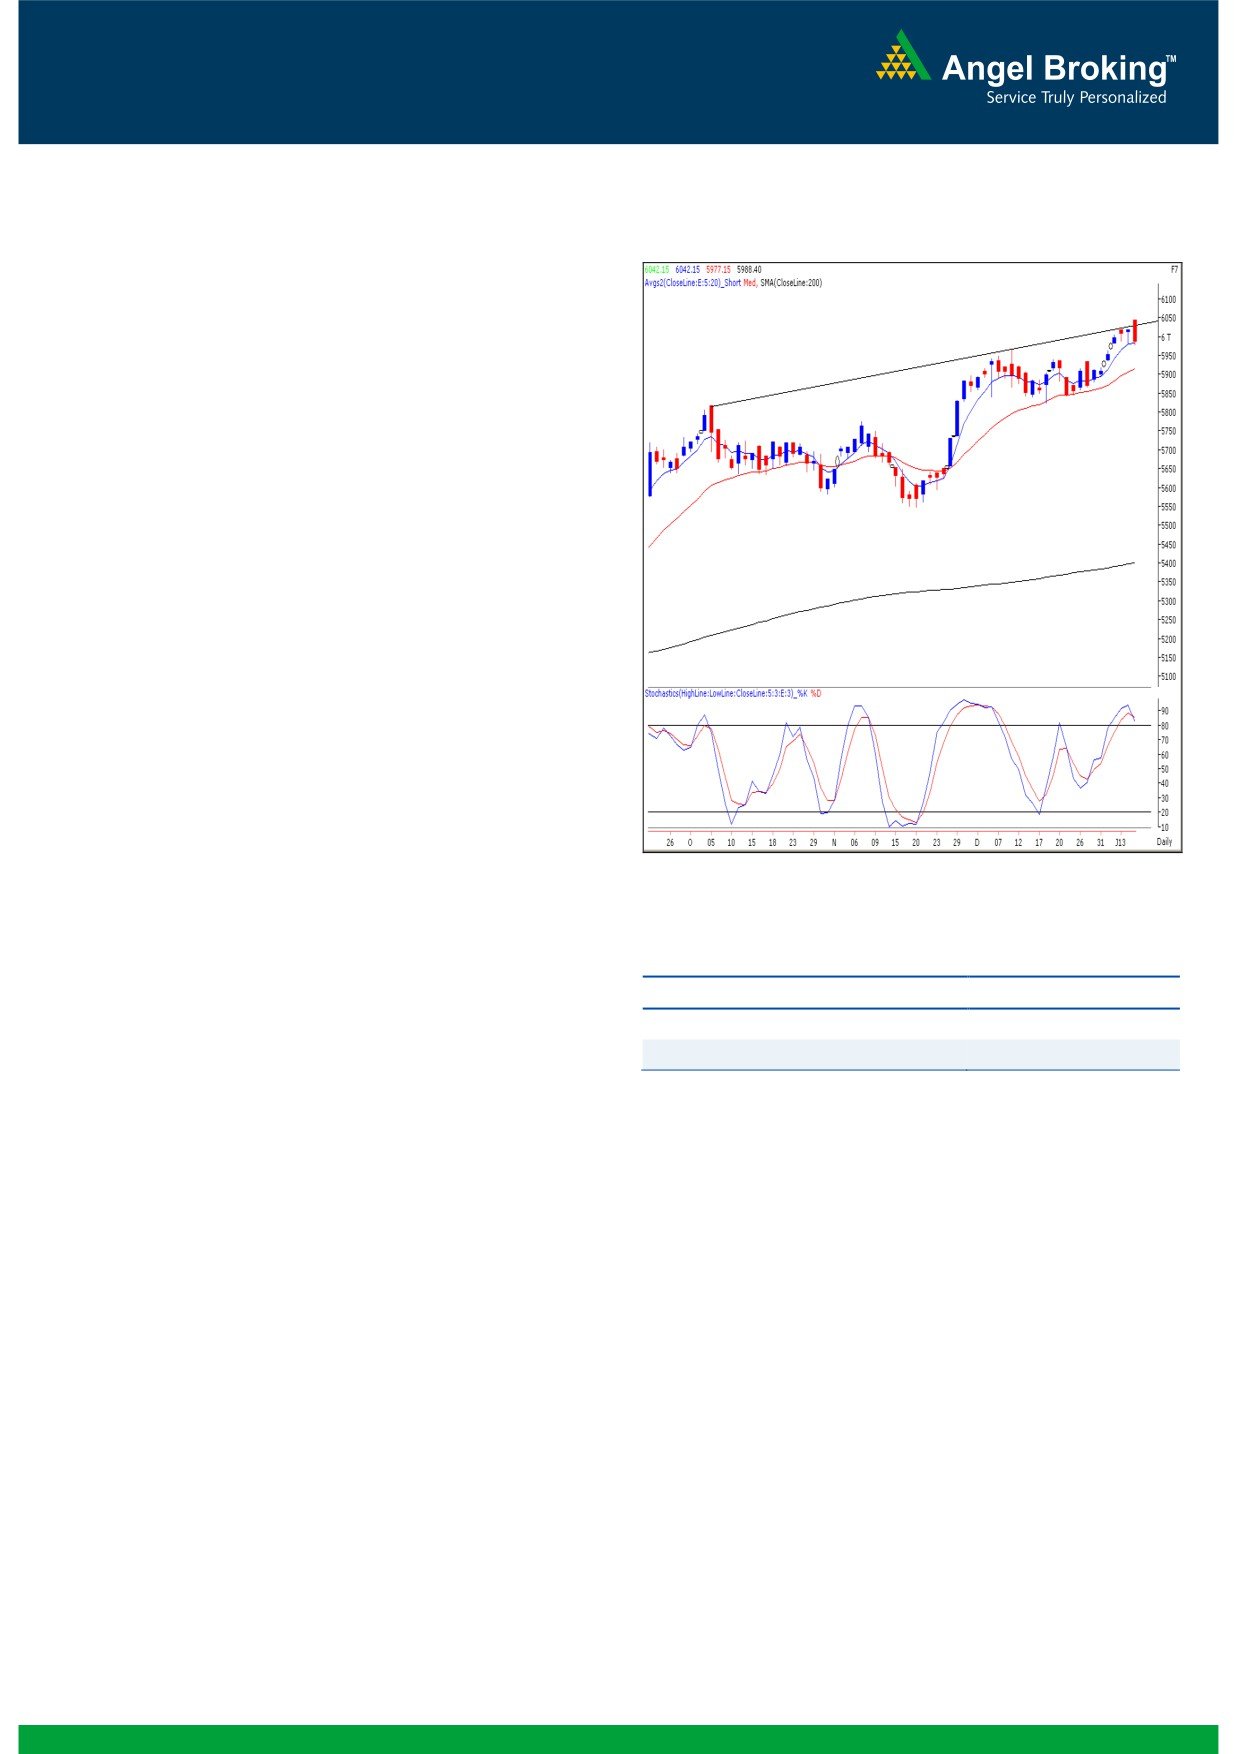
Exhibit 1: Nifty Daily Chart
Yesterday we witnessed a marginal gap up opening but
indices pared down their early gains and strong selling
pressure during the final hour of the trade led the Nifty to
close marginally below 6000 mark. The Capital Goods,
FMCG, Consumer Durables and Realty counters influenced
the price correction during the second half; whereas the
Metal and Health Care sectors ended in the positive territory.
The advance to decline ratio was in favor of advancing
Formation
The ’20-day EMA’ and the ’20-week EMA’ are placed at
19449 / 5914 and 18837 / 5723 levels, respectively.
On the daily chart, the benchmark indices are facing
resistance near the ‘Upward Sloping Trend Line’ drawn
by joining the highs of October 5, 2012 and December
11, 2012.
The last two daily candles resemble a ‘Hanging Man’
Source: Falcon:
Japanese candlestick pattern.
Actionable points:
Trading strategy:
View
Neutral
The week started on a positive note but indices faced
Resistance Levels
6042
tremendous resistance near the mentioned ‘Upward Sloping
Support Levels
5977 - 5960 - 5935
Trend Line’ (drawn by joining the highs of October 5, 2012
and December 11, 2012). Enhanced selling pressure in the
latter half of the session led indices to close in the negative
territory. The daily chart now depicts a ‘Bearish Engulfing’
pattern as yesterday’s real body has completely engulfed
Friday’s as well as Thursday’s candle. This is also supported
by the negative placement of the ‘RSI’ and ‘Stochastic’
oscillators. Hence, going forward, any sustainable move
below yesterday’s low of 19654 / 5977 may trigger near
term pessimism in the market. In this scenario, we can expect
a correction towards 19624 - 19509 / 5960 - 5935 levels.
On the flipside, 19857 / 6042 would now act a resistance in
coming trading session.
1
Daily Technical Report
January 08, 2013
Bank Nifty Outlook - (12709)
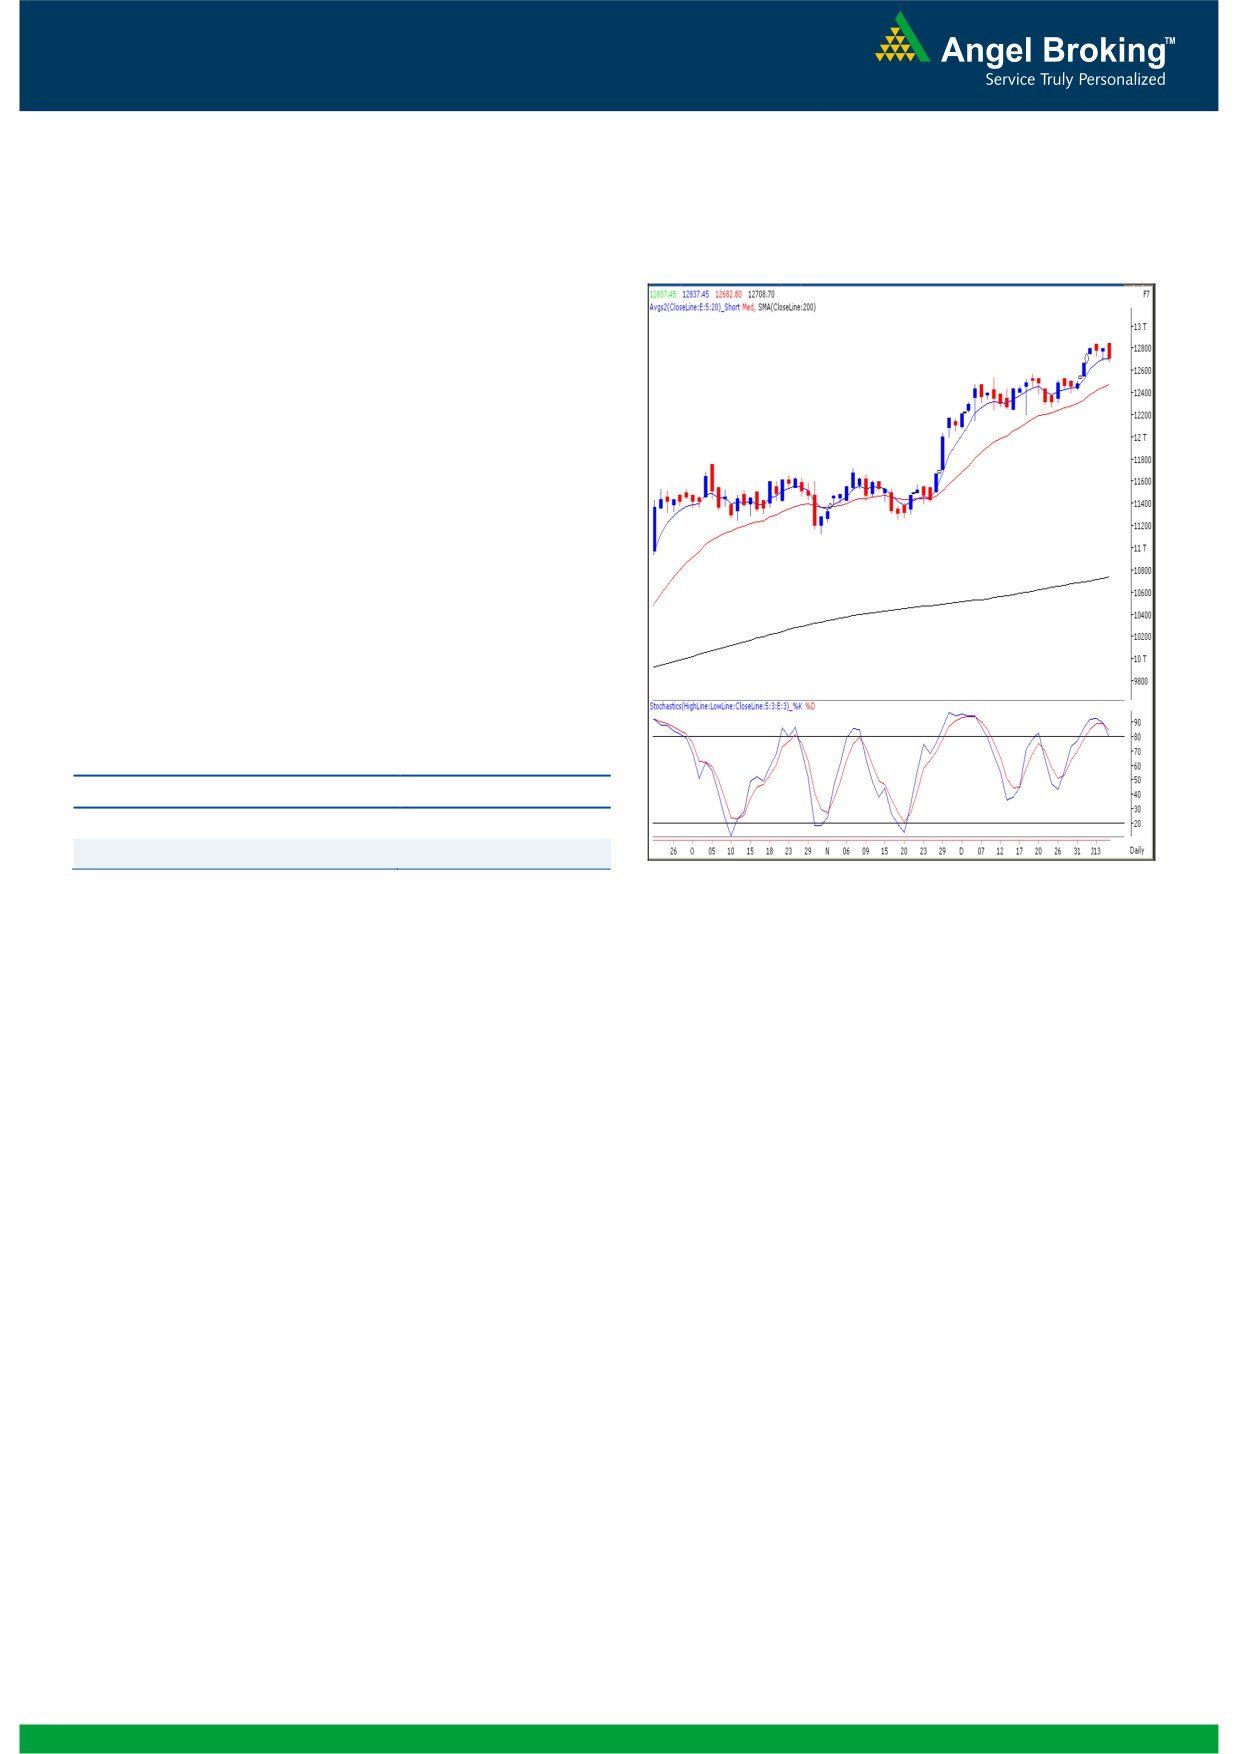
Exhibit 2: Bank Nifty Daily Chart
Yesterday, the Bank Nifty opened near the mentioned
resistance level of 12838 and traded in a narrow range
during the first half. However, in line with the broader
markets, we witnessed substantial selling pressure in the
index during the last hour of trade. Similar to the charts of
the Benchmark Indices, we are now witnessing a negative
crossover in momentum oscillator “RSI” and “Stochastic” on
the daily chart of the Bank Nifty. The effect of these technical
indicators would be seen if the index sustains below
yesterday’s low of 12683. In this scenario the index is likely
to drift lower towards 12615 - 12580 levels. On the upside
12768 - 12802 levels are likely to act as resistance for the
day.
Actionable points:
View
Bearish Below 12682
Expected targets
12615 - 12580
Resistance Levels
12768 - 12802
Source: Falcon:
2
Daily Technical Report
January 08, 2013
Research Team Tel: 022 - 39357800
DISCLAIMER
This document is solely for the personal information of the recipient, and must not be singularly used as the basis of any investment
decision. Nothing in this document should be construed as investment or financial advice. Each recipient of this document should make
such investigations as they deem necessary to arrive at an independent evaluation of an investment in the securities of the companies
referred to in this document (including the merits and risks involved), and should consult their own advisors to determine the merits and
risks of such an investment.
Angel Broking Limited, its affiliates, directors, its proprietary trading and investment businesses may, from time to time, make
investment decisions that are inconsistent with or contradictory to the recommendations expressed herein. The views contained in this
document are those of the analyst, and the company may or may not subscribe to all the views expressed within.
Reports based on technical and derivative analysis center on studying charts of a stock's price movement, outstanding positions and
trading volume, as opposed to focusing on a company's fundamentals and, as such, may not match with a report on a company's
fundamentals.
The information in this document has been printed on the basis of publicly available information, internal data and other reliable
sources believed to be true, but we do not represent that it is accurate or complete and it should not be relied on as such, as this
document is for general guidance only. Angel Broking Limited or any of its affiliates/ group companies shall not be in any way
responsible for any loss or damage that may arise to any person from any inadvertent error in the information contained in this report.
Angel Broking Limited has not independently verified all the information contained within this document. Accordingly, we cannot testify,
nor make any representation or warranty, express or implied, to the accuracy, contents or data contained within this document. While
Angel Broking Limited endeavours to update on a reasonable basis the information discussed in this material, there may be regulatory,
compliance, or other reasons that prevent us from doing so.
This document is being supplied to you solely for your information, and its contents, information or data may not be reproduced,
redistributed or passed on, directly or indirectly.
Angel Broking Limited and its affiliates may seek to provide or have engaged in providing corporate finance, investment banking or
other advisory services in a merger or specific transaction to the companies referred to in this report, as on the date of this report or in
the past.
Neither Angel Broking Limited, nor its directors, employees or affiliates shall be liable for any loss or damage that may arise from or in
connection with the use of this information.
Note: Please refer to the important `Stock Holding Disclosure' report on the Angel website (Research Section). Also, please refer to the
latest update on respective stocks for the disclosure status in respect of those stocks. Angel Broking Limited and its affiliates may have
investment positions in the stocks recommended in this report.
Research Team
Shardul Kulkarni
-
Head - Technicals
Sameet Chavan
-
Technical Analyst
Sacchitanand Uttekar
-
Technical Analyst
Mehul Kothari
-
Technical Analyst
Ankur Lakhotia
-
Technical Analyst
Angel Broking Pvt. Ltd.
Registered Office: G-1, Ackruti Trade Centre, Rd. No. 7, MIDC, Andheri (E), Mumbai - 400 093.
Corporate Office: 6th Floor, Ackruti Star, MIDC, Andheri (E), Mumbai - 400 093. Tel: (022) 3952 6600
Sebi Registration No: INB 010996539
4