Daily Technical Report
May 07, 2013
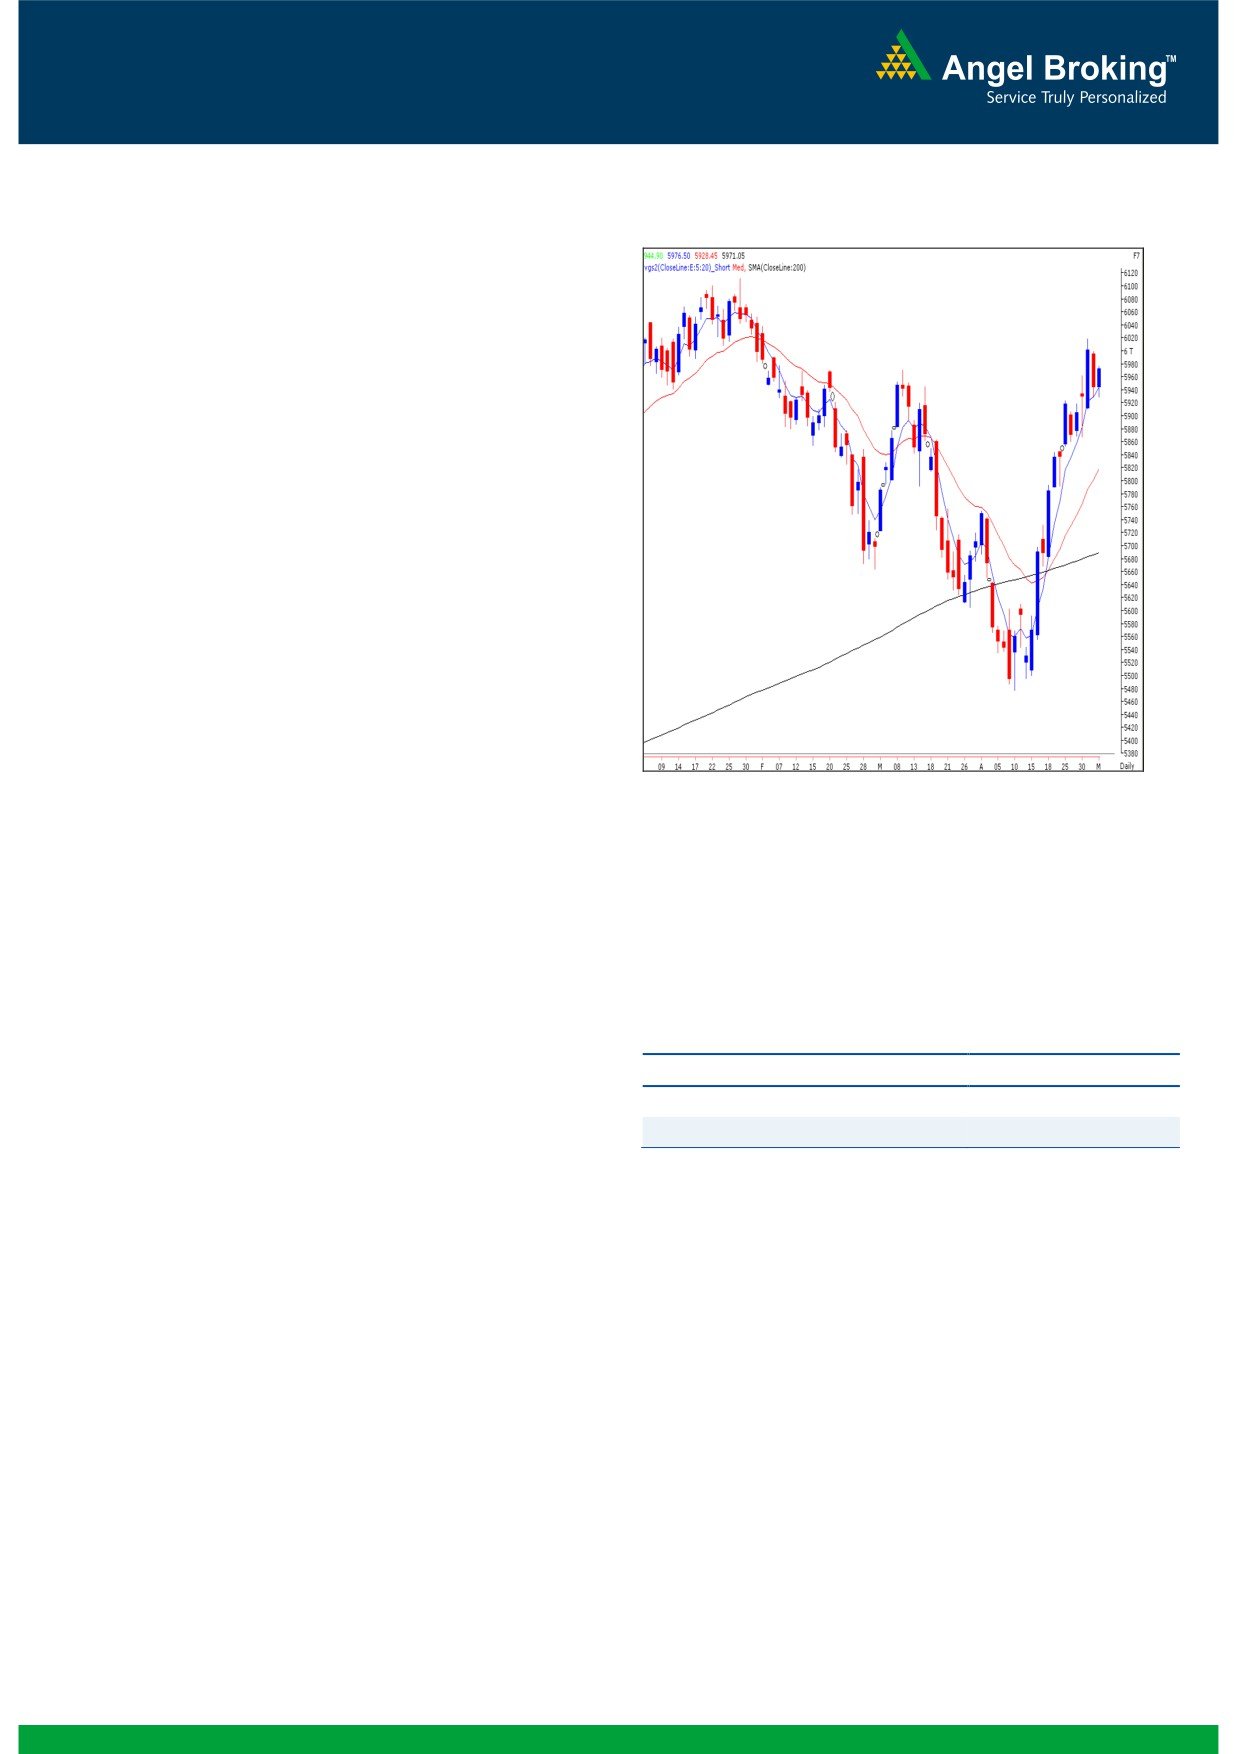
Exhibit 1: Nifty Daily Chart
Sensex (19674) / NIFTY (5971)
The opening session of the week started off on a flat note in-
line with quiet mood across the globe. Indices then oscillated
within the narrow trading range of about half a percent for
most part of the session. For the day, Metal, IT and Teck
counters ended on a gaining side whereas FMCG stocks
ended in the red. The advance to decline ratio was in favor
of advancing counters (A=1339 D=1006) (Source-
Formation
The ’20-week EMA’ and the ’20-day EMA’ are placed at
19145/ 5802 and 19172/ 5818 levels, respectively.
The ’89-day EMA’ and the ‘200-day SMA’ are placed at
19118/ 5792 and 18763 / 5689, respectively.
The weekly ADX (9) indicator and the ‘RSI-Smoothened’
Source: Falcon:
oscillator have signaled a positive crossover.
The 78.60%Fibonacci retracement levels of the fall from
20204 / 6112 to 18144 / 5477 is placed at 19762 /
5976.
Actionable points:
Trading strategy:
For the second consecutive session, indices oscillated within
View
Bearish Below 5928
the price range of Thursday’s session. However, unlike
Expected Target
5880 - 5867
Friday’s session, the price action was narrower and indices
Resistance Levels
6020
traded with positive bias for the most part of the session.
Considering price movement in hourly chart, indices may
trade with positive bias only if they sustain above 19695 /
5977 level. In this case, an intraday up move towards 19792
/ 6020 can be expected. On the flipside, it is important to
note that the markets have now made a higher low for 12
consecutive trading sessions. A fall and close below the low
of 19550 / 5928 may result in a bout of profit booking in
the market. Traders with a positional trading perspective are
advised to book profits in their long positions and wait for
declines.
1
Daily Technical Report
May 07, 2013
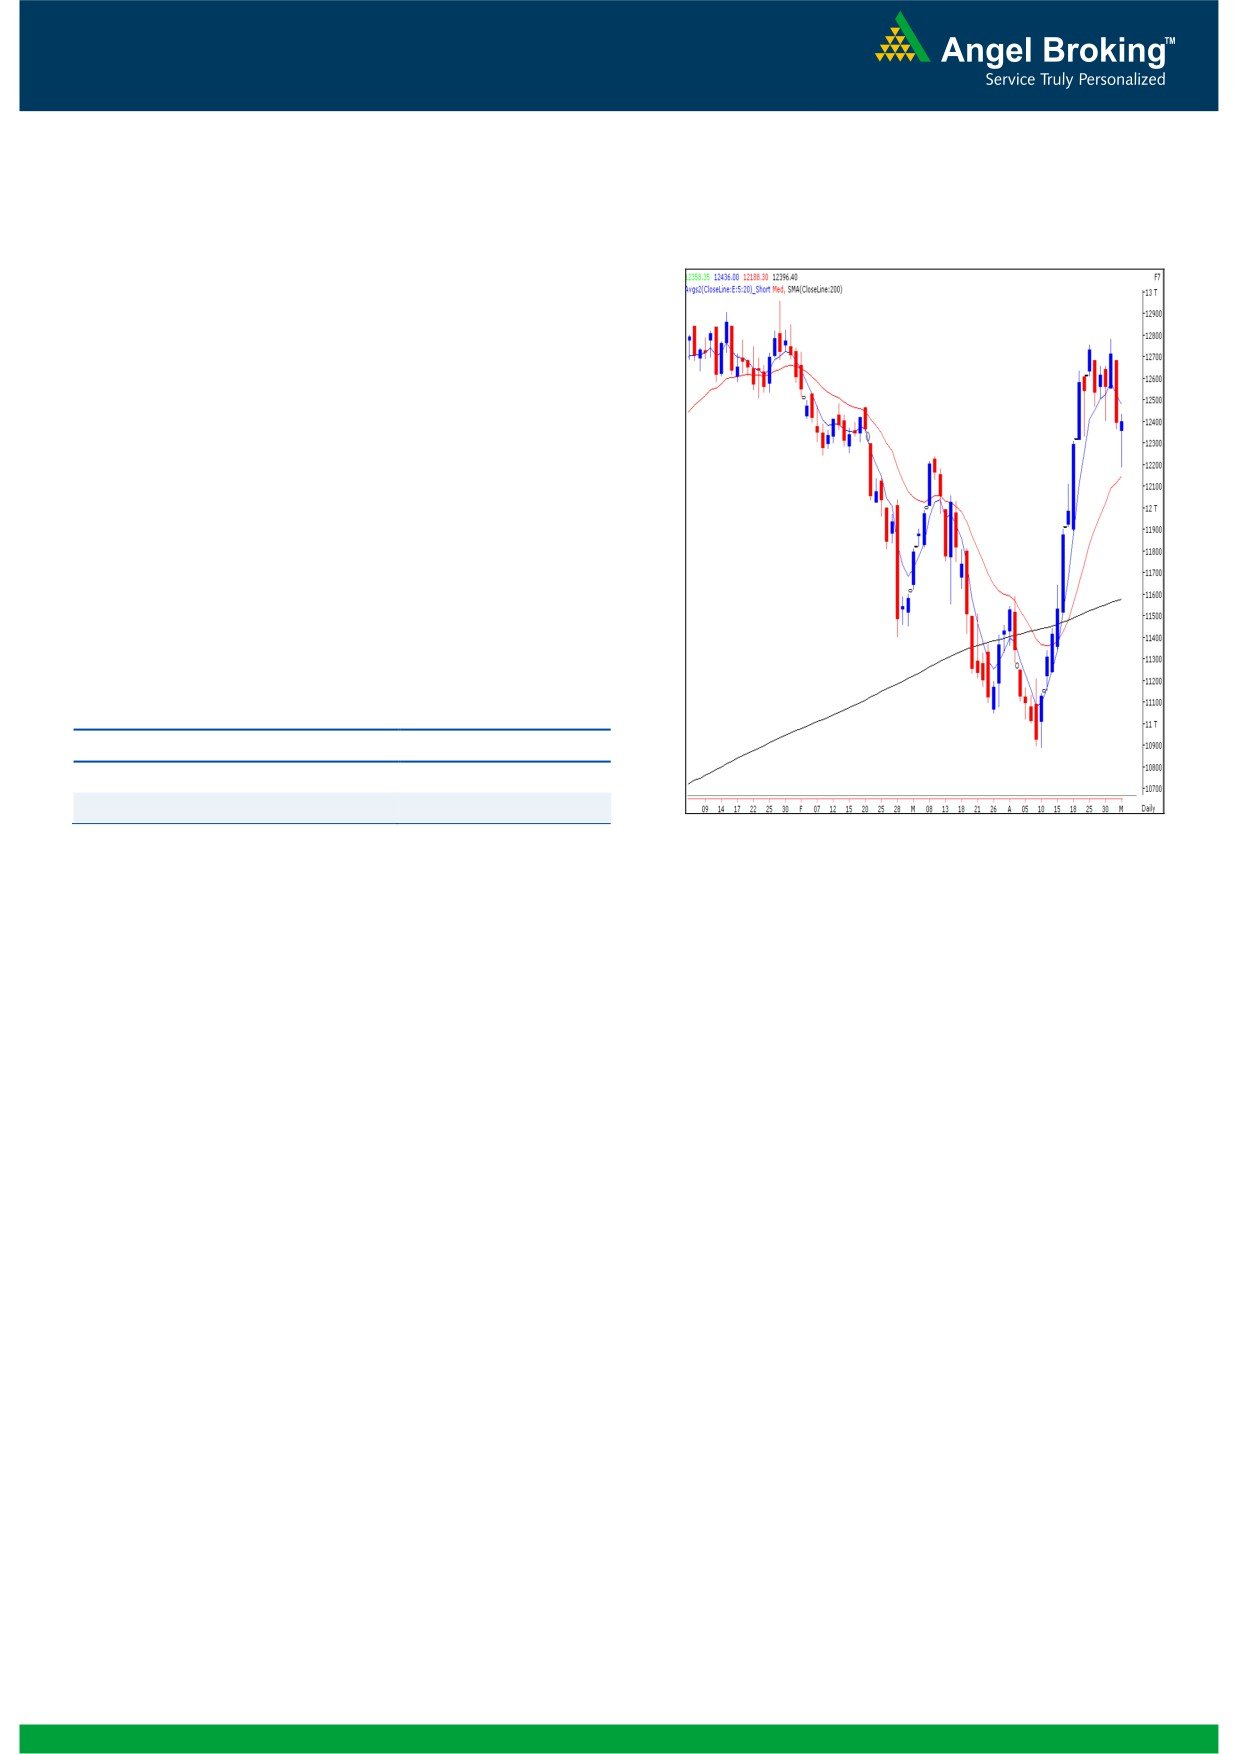
Exhibit 2: Bank Nifty Daily Chart
Bank Nifty Outlook - (12396)
Yesterday, Bank Nifty opened on a flat note and immediately
fell below the support level of 12313. As mentioned we
witnessed selling pressure in the index and the Bank Nifty
nearly tested the ’20 - day EMA’ during the first hour of
trade. However, a gradual recovery from this support level
led the index to close near the initial opening level. We are
now witnessing a ‘Spinning Top’ candlestick pattern on the
daily chart indicating indecisiveness at current levels.
However, the “RSI - Smoothened” indicator has given a
negative crossover. For the day, 12486 - 12556 levels are
likely to act as resistance levels whereas 12250 - 12144 are
likely to act as support.
Actionable points:
View
Neutral
Resistance levels
12486 - 12556
Support Levels
12250 - 12144
Source: Falcon:
2
Daily Technical Report
May 07, 2013
Research Team Tel: 022 - 30940000
DISCLAIMER
This document is solely for the personal information of the recipient, and must not be singularly used as the basis of any investment
decision. Nothing in this document should be construed as investment or financial advice. Each recipient of this document should make
such investigations as they deem necessary to arrive at an independent evaluation of an investment in the securities of the companies
referred to in this document (including the merits and risks involved), and should consult their own advisors to determine the merits and
risks of such an investment.
Angel Broking Limited, its affiliates, directors, its proprietary trading and investment businesses may, from time to time, make
investment decisions that are inconsistent with or contradictory to the recommendations expressed herein. The views contained in this
document are those of the analyst, and the company may or may not subscribe to all the views expressed within.
Reports based on technical and derivative analysis center on studying charts of a stock's price movement, outstanding positions and
trading volume, as opposed to focusing on a company's fundamentals and, as such, may not match with a report on a company's
fundamentals.
The information in this document has been printed on the basis of publicly available information, internal data and other reliable
sources believed to be true, but we do not represent that it is accurate or complete and it should not be relied on as such, as this
document is for general guidance only. Angel Broking Limited or any of its affiliates/ group companies shall not be in any way
responsible for any loss or damage that may arise to any person from any inadvertent error in the information contained in this report.
Angel Broking Limited has not independently verified all the information contained within this document. Accordingly, we cannot testify,
nor make any representation or warranty, express or implied, to the accuracy, contents or data contained within this document. While
Angel Broking Limited endeavors to update on a reasonable basis the information discussed in this material, there may be regulatory,
compliance, or other reasons that prevent us from doing so.
This document is being supplied to you solely for your information, and its contents, information or data may not be reproduced,
redistributed or passed on, directly or indirectly.
Angel Broking Limited and its affiliates may seek to provide or have engaged in providing corporate finance, investment banking or
other advisory services in a merger or specific transaction to the companies referred to in this report, as on the date of this report or in
the past.
Neither Angel Broking Limited, nor its directors, employees or affiliates shall be liable for any loss or damage that may arise from or in
connection with the use of this information.
Note: Please refer to the important `Stock Holding Disclosure' report on the Angel website (Research Section). Also, please refer to the
latest update on respective stocks for the disclosure status in respect of those stocks. Angel Broking Limited and its affiliates may have
investment positions in the stocks recommended in this report.
Research Team
Shardul Kulkarni
-
Head - Technicals
Sameet Chavan
-
Technical Analyst
Sacchitanand Uttekar
-
Technical Analyst
Ankur Lakhotia
-
Technical Analyst
Angel Broking Pvt. Ltd.
Registered Office: G-1, Ackruti Trade Centre, Rd. No. 7, MIDC, Andheri (E), Mumbai - 400 093.
Corporate Office: 6th Floor, Ackruti Star, MIDC, Andheri (E), Mumbai - 400 093. Tel: (022) 30940000
Sebi Registration No: INB 010996539
4