Daily Technical Report
February 07, 2013
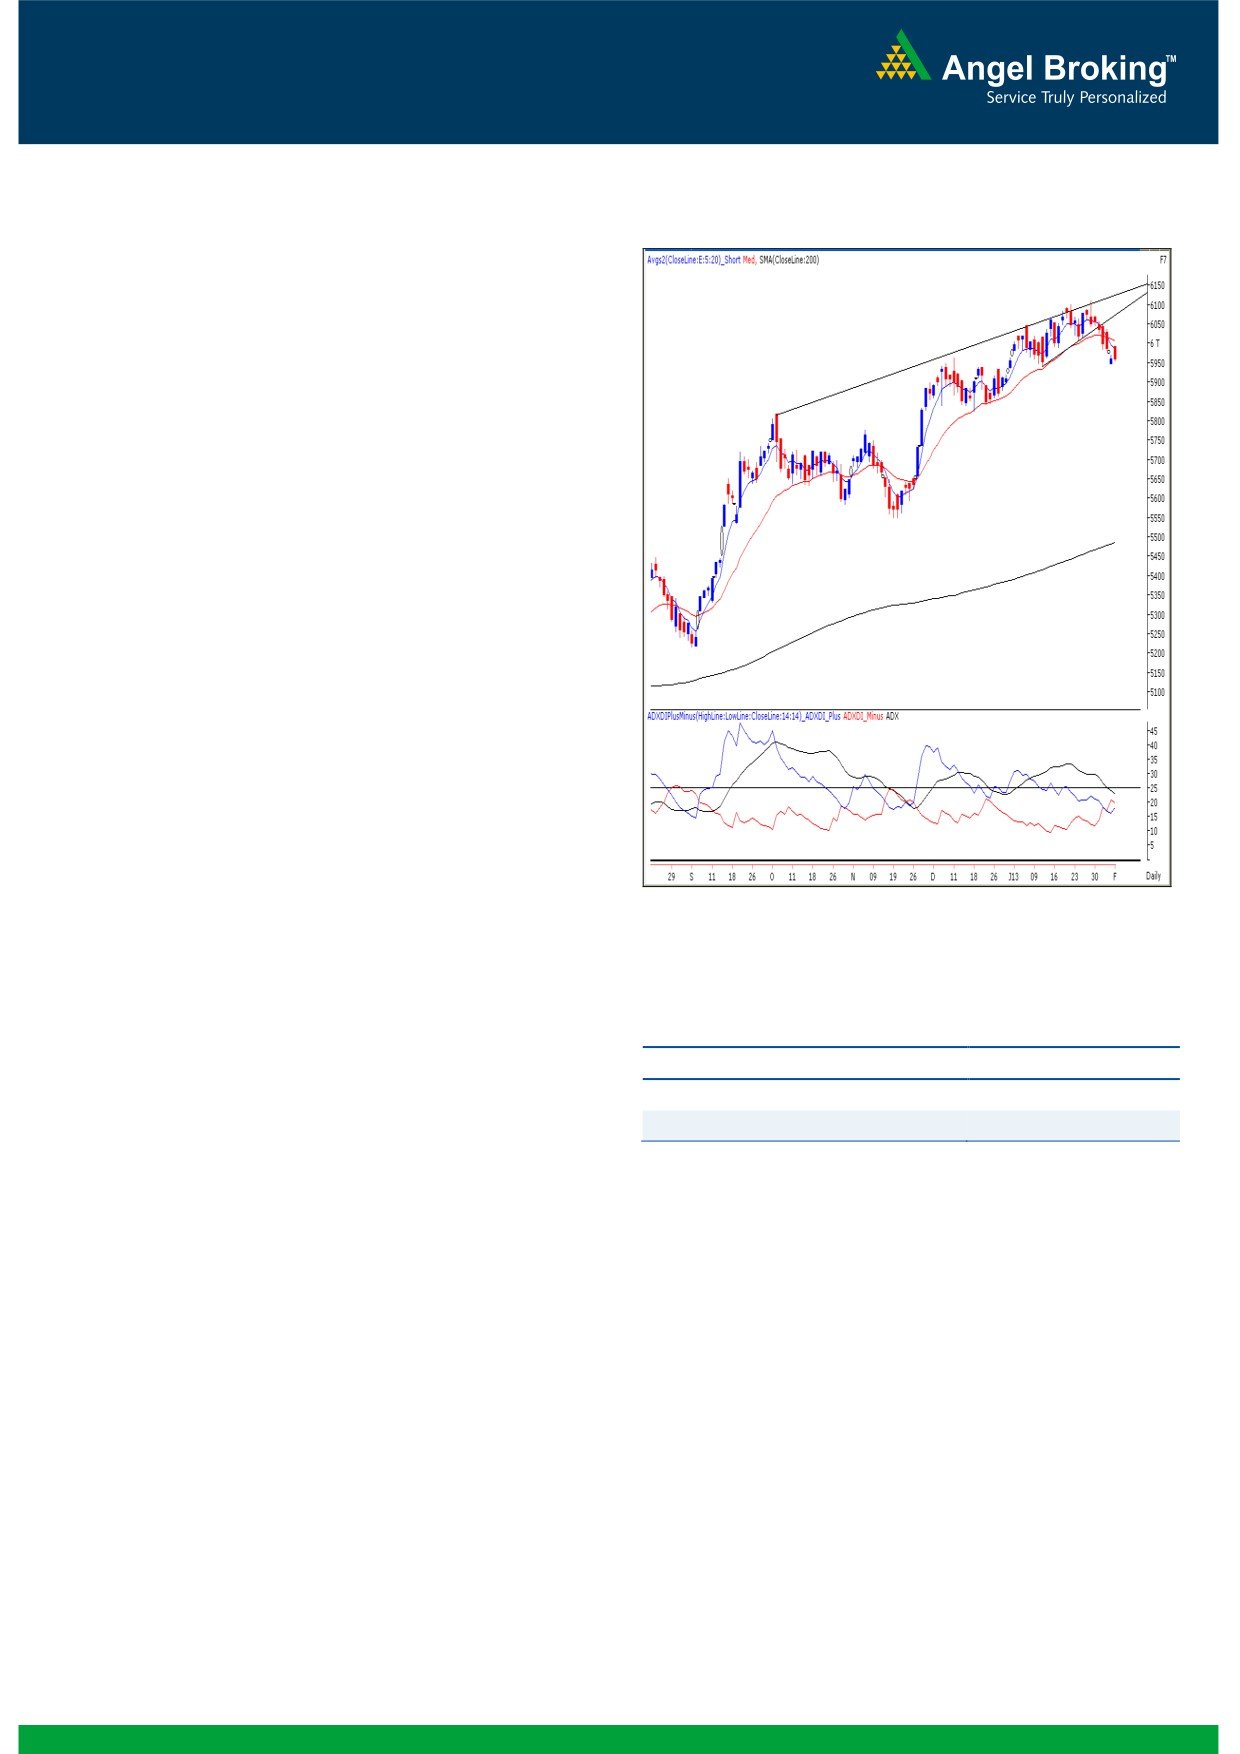
Exhibit 1: Nifty Daily Chart
Sensex (19640) / NIFTY (5959)
Yesterday, indices opened higher considering overnight rally
in US as well as European bourses but struggled to sustain at
higher levels. As a result, all the early gains got wiped out
and eventually the session closed on a flat note. On sectoral
front, Capital Goods, PSU and Power counters were among
the top losers. The Realty, IT and Teck sectors outperformed
during the session. The advance to decline ratio was in just
marginally favor of advancing counters (A=1165 D=1017)
Formation
The ’20-day EMA’ and the ’20-week EMA’ are placed at
19820 / 6006 and 19178 / 5819 levels, respectively.
On the daily chart, the benchmark indices are facing
resistance near the ‘Upward Sloping Trend Line’ drawn
by joining the highs of October 5, 2012 and January
18, 2012.
The weekly ‘RSI’ momentum oscillator as well as the
Daily ‘ADX (9)’ indicator are now signaling a negative
Source: Falcon:
crossover.
The ‘Hanging Man’ Japanese Candlestick pattern on the
weekly chart has been confirmed.
Actionable points:
View
Bearish Below 5940
Trading strategy:
Expected Target
5897
Indices opened higher and precisely tested hourly ’20-EMA’,
Resistance Levels
5972 - 6039
which acted as a strong resistance for the entire trading
session. Eventually traders pared down all their opening
gains. Going forward, we continue to mention possibility of
further down move if indices sustain below 19596 / 5940. In
this case, our indices may slide towards their next support
level of 19406 / 5897. On the flipside, yesterday’s high of
19765 / 5990 would act as immediate resistance in coming
trading session. Any move beyond this level is likely to attract
short covering by market participants.
1
Daily Technical Report
February 07, 2013
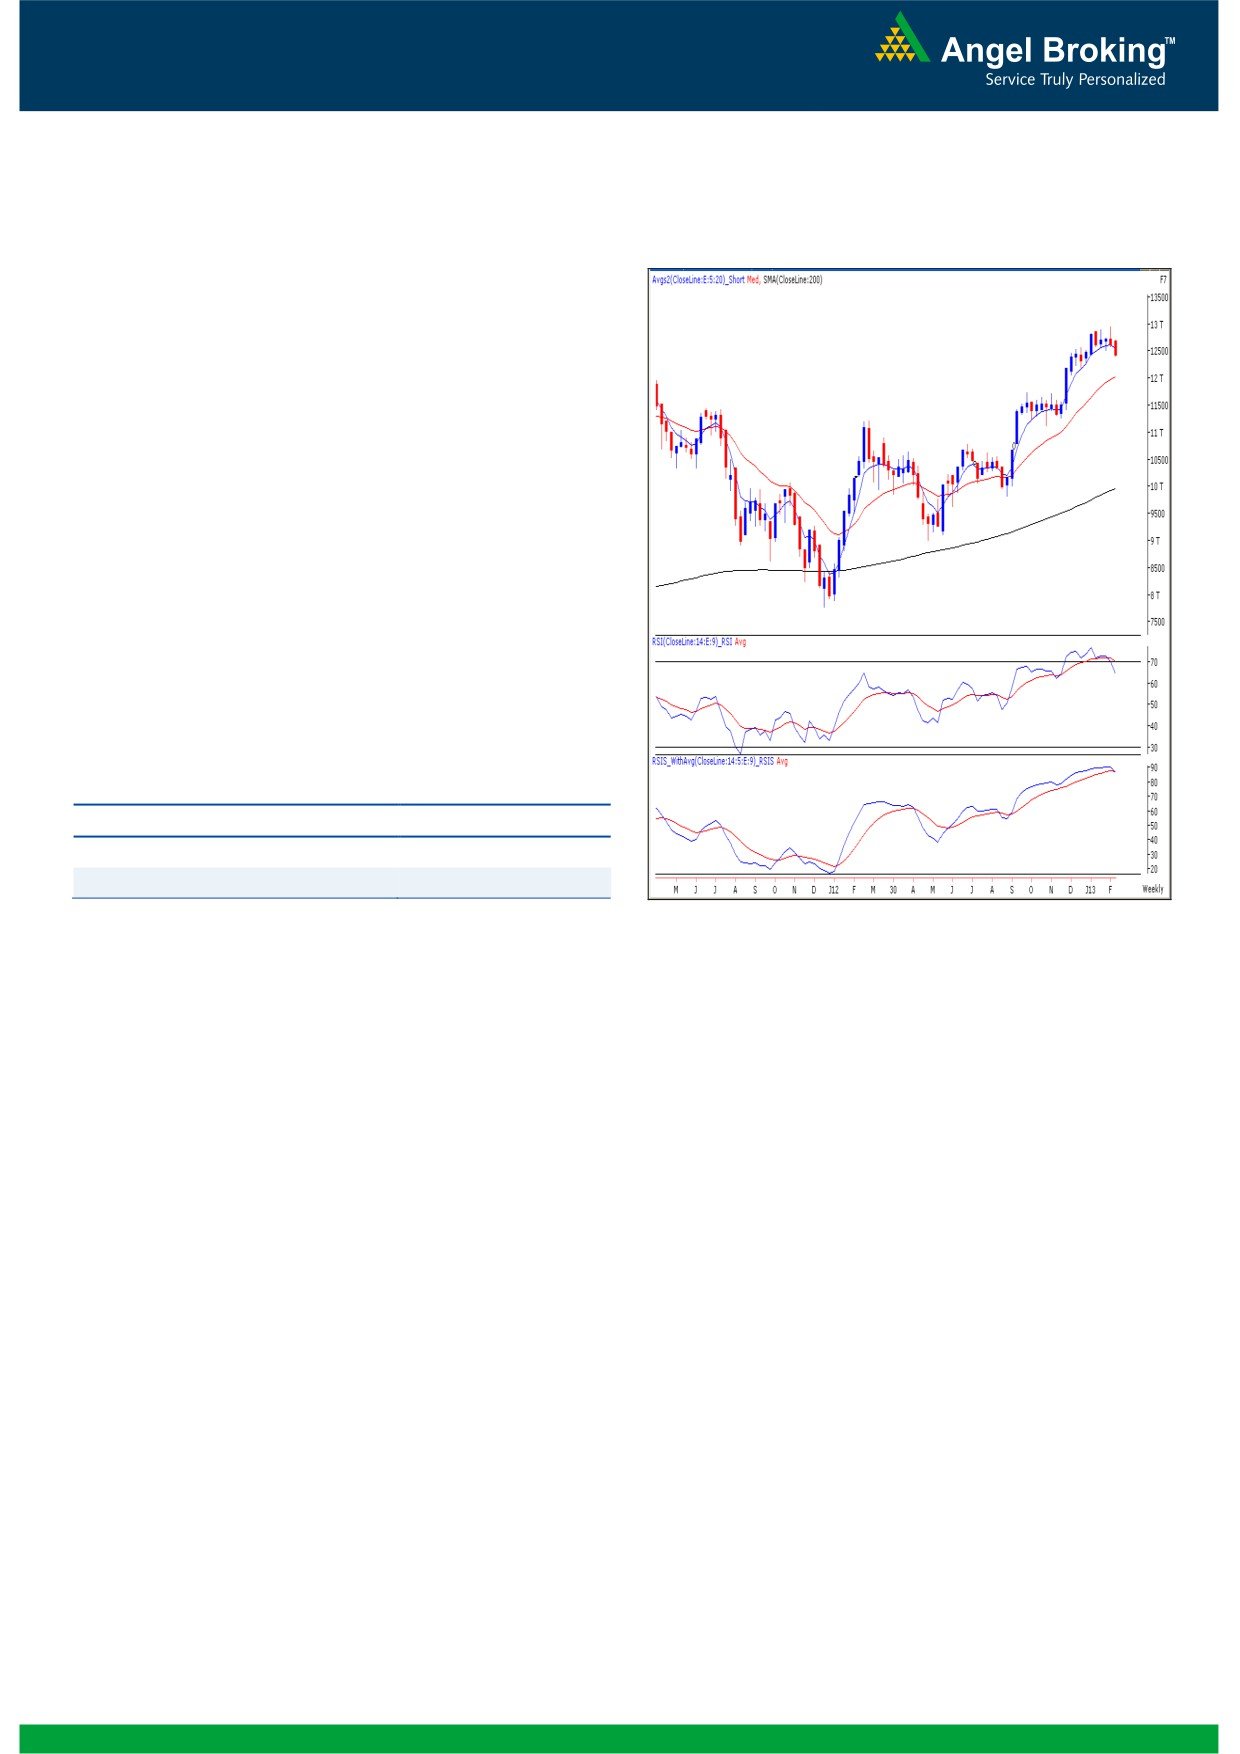
Exhibit 2: Bank Nifty Weekly Chart
Bank Nifty Outlook - (12418)
In line with our benchmark indices, the Bank Nifty too closed
flat near the support level of 12415 during yesterday’s
trading session. Along with the daily chart, the momentum
oscillators (‘RSI’ & ‘RSI-Smoothened’) on the weekly chart too
are signaling negative crossovers and a possibility of further
decline in the index in coming trading sessions. Hence, we
continue to mention that the index may test the lower levels
of
12265
-
12140
-
12000 once it sustains below
yesterday’s low of
12397. However, due to oversold
condition of momentum oscillators on hourly charts, the
possibility of some sideways consolidation or a minor
pullback from current levels cannot be ruled out. On the
upside, 12525 - 12633 levels, are likely to act as resistance
for the day.
Actionable points:
View
Bearish Below 12397
Expected Targets
12265 - 12140 - 12000
Resistance Levels
12525 - 12633
Source: Falcon:
2
Daily Technical Report
February 07, 2013
Research Team Tel: 022 - 30940000
DISCLAIMER
This document is solely for the personal information of the recipient, and must not be singularly used as the basis of any investment
decision. Nothing in this document should be construed as investment or financial advice. Each recipient of this document should make
such investigations as they deem necessary to arrive at an independent evaluation of an investment in the securities of the companies
referred to in this document (including the merits and risks involved), and should consult their own advisors to determine the merits and
risks of such an investment.
Angel Broking Limited, its affiliates, directors, its proprietary trading and investment businesses may, from time to time, make
investment decisions that are inconsistent with or contradictory to the recommendations expressed herein. The views contained in this
document are those of the analyst, and the company may or may not subscribe to all the views expressed within.
Reports based on technical and derivative analysis center on studying charts of a stock's price movement, outstanding positions and
trading volume, as opposed to focusing on a company's fundamentals and, as such, may not match with a report on a company's
fundamentals.
The information in this document has been printed on the basis of publicly available information, internal data and other reliable
sources believed to be true, but we do not represent that it is accurate or complete and it should not be relied on as such, as this
document is for general guidance only. Angel Broking Limited or any of its affiliates/ group companies shall not be in any way
responsible for any loss or damage that may arise to any person from any inadvertent error in the information contained in this report.
Angel Broking Limited has not independently verified all the information contained within this document. Accordingly, we cannot testify,
nor make any representation or warranty, express or implied, to the accuracy, contents or data contained within this document. While
Angel Broking Limited endeavours to update on a reasonable basis the information discussed in this material, there may be regulatory,
compliance, or other reasons that prevent us from doing so.
This document is being supplied to you solely for your information, and its contents, information or data may not be reproduced,
redistributed or passed on, directly or indirectly.
Angel Broking Limited and its affiliates may seek to provide or have engaged in providing corporate finance, investment banking or
other advisory services in a merger or specific transaction to the companies referred to in this report, as on the date of this report or in
the past.
Neither Angel Broking Limited, nor its directors, employees or affiliates shall be liable for any loss or damage that may arise from or in
connection with the use of this information.
Note: Please refer to the important `Stock Holding Disclosure' report on the Angel website (Research Section). Also, please refer to the
latest update on respective stocks for the disclosure status in respect of those stocks. Angel Broking Limited and its affiliates may have
investment positions in the stocks recommended in this report.
Research Team
Shardul Kulkarni
-
Head - Technicals
Sameet Chavan
-
Technical Analyst
Sacchitanand Uttekar
-
Technical Analyst
Mehul Kothari
-
Technical Analyst
Ankur Lakhotia
-
Technical Analyst
Angel Broking Pvt. Ltd.
Registered Office: G-1, Ackruti Trade Centre, Rd. No. 7, MIDC, Andheri (E), Mumbai - 400 093.
Corporate Office: 6th Floor, Ackruti Star, MIDC, Andheri (E), Mumbai - 400 093. Tel: (022) 30940000
Sebi Registration No: INB 010996539
4