Daily Technical Report
January 07, 2013
Sensex (19784) / NIFTY (6016)
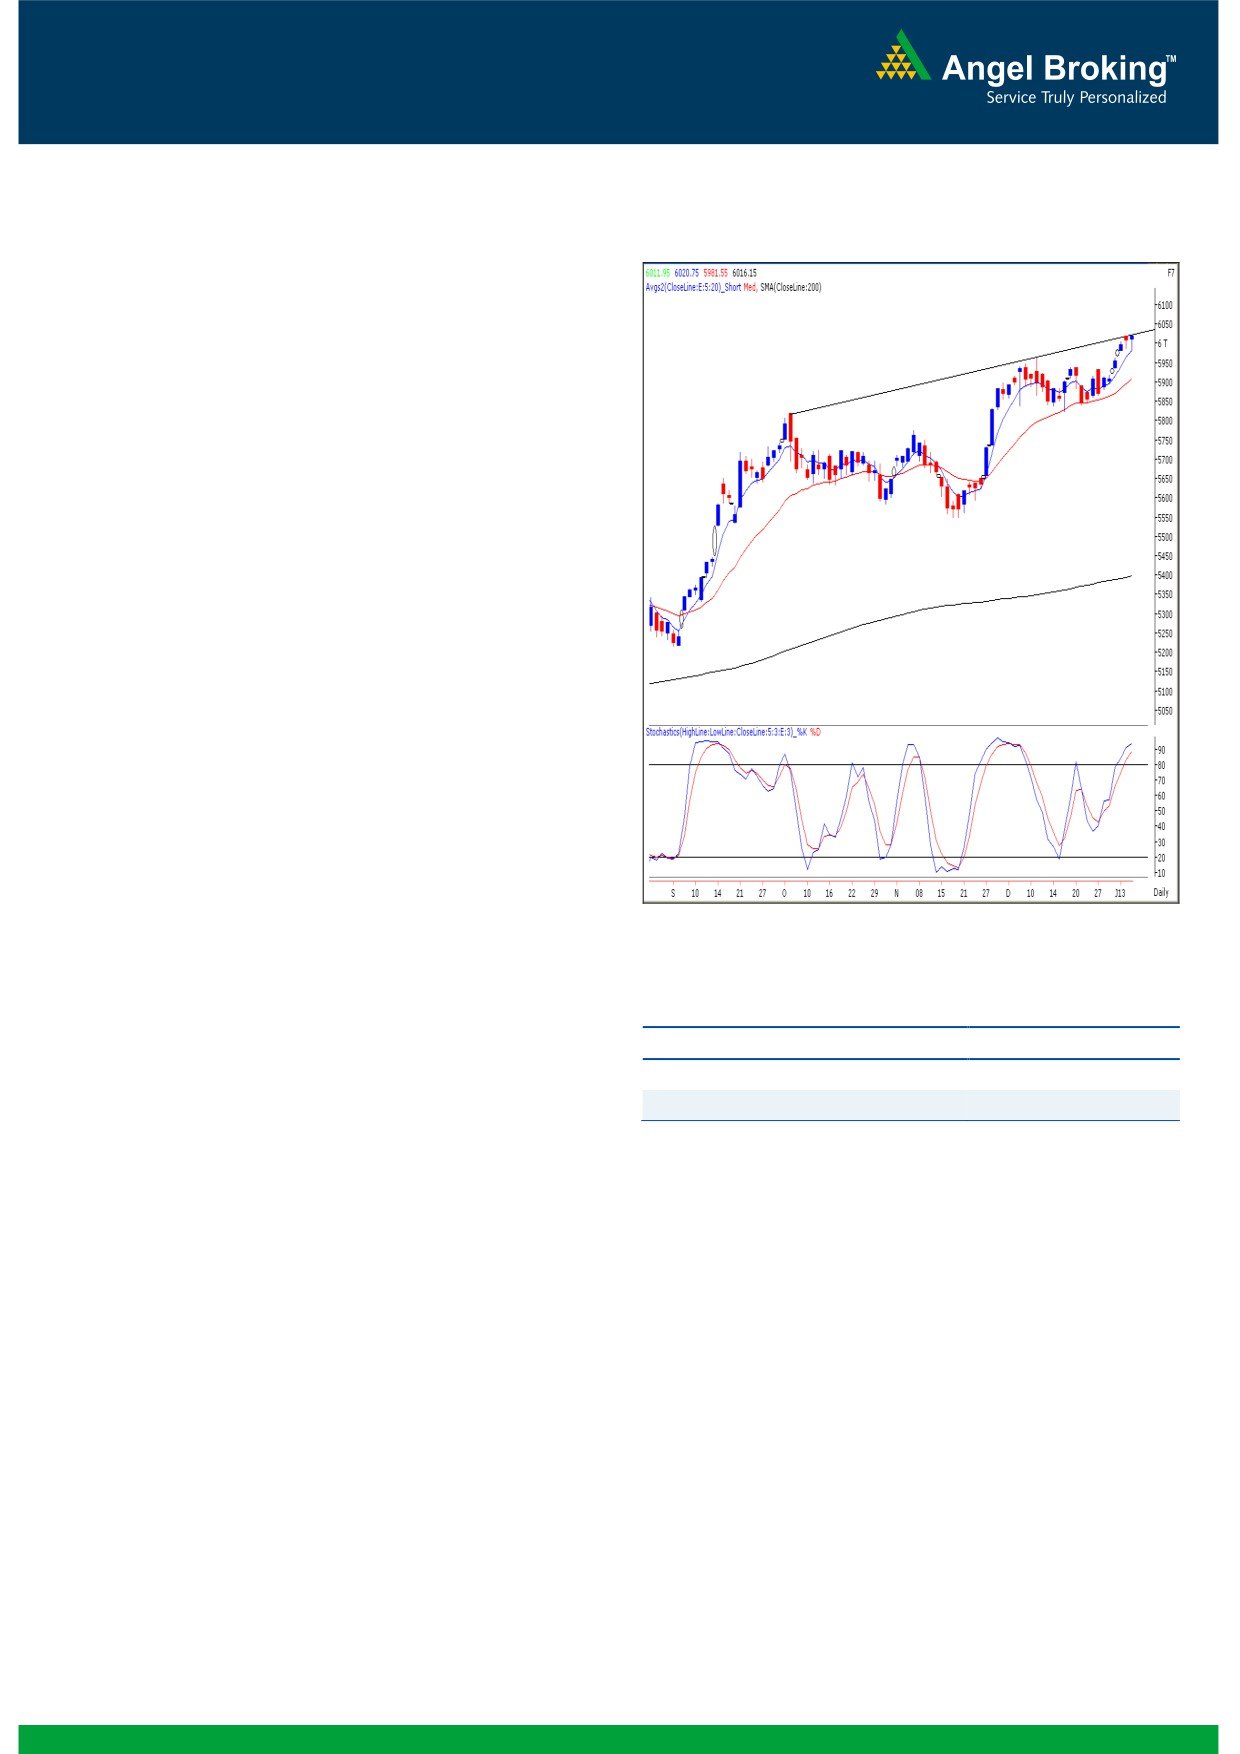
Exhibit 1: Nifty Daily Chart
On Friday, our markets witnessed a flat opening and then
tested the mentioned support level of 19693 / 5986 in the
initial hour of the trading session. However, the Oil and Gas
counters lead from the front in later half as markets closed
near days high, above the 6000 mark. On the other hand
Metal, FMCG and Auto counters remained under pressure.
The advance to decline ratio was marginally in favor of
advancing counters (A=1521 D=1435) (Source
-
Formation
The ’20-day EMA’ and the ’20-week EMA’ are placed at
19423 / 5906 and 18747 / 5696 levels, respectively.
On the daily chart, the benchmark indices are facing
resistance near the ‘Upward Sloping Trend Line’ drawn
by joining the highs of October 5, 2012 and December
11, 2012.
The last two daily candles resemble a ‘Hanging Man’
Japanese candlestick pattern.
Source: Falcon:
Trading strategy:
Actionable points:
Quite similar to last year, this year too, the first week resulted
View
Neutral
in positive gains as the Nifty witnessed a weekly closing
Resistance Levels
6021 - 6070
above the 6000 mark for the first time after December 31,
2010. The benchmark indices have now managed to cross
Support Levels
5981 - 5960 - 5935
their near term hurdles of 19613 (Sensex) and 5965 (Nifty).
At this juncture, we are observing that these are facing a
Any sustainable move beyond 19798 / 6021 would negate
resistance near the ‘Upward Sloping Trend Line’ (drawn by
the pattern and the indices then may rally towards 19950 /
joining the highs of October 5, 2012 and December 11,
6070. Traders should consider reducing long positions and
2012). Also, the daily chart now depicts two consecutive
partial profit booking in individual large cap counters near to
candles which resemble a ‘Hanging Man’. As mentioned in
the 6070 - 6125 mark.
our Friday’s daily report, the said pattern has a negative
implication and needs a confirmation in the form of prices
closing below the low of the pattern. Considering the overall
positive sentiment across the globe and bullish higher degree
charts, we don’t expect a complete reversal of the existing
bull trend, although a minor corrective move cannot be ruled
out. Hence, a closing below 19679 / 5981 would confirm
the ‘Hanging Man’ pattern and indices may slide towards
19624 - 19509 / 5960 - 5935 levels.
1
Daily Technical Report
January 07, 2013
Bank Nifty Outlook - (12787)
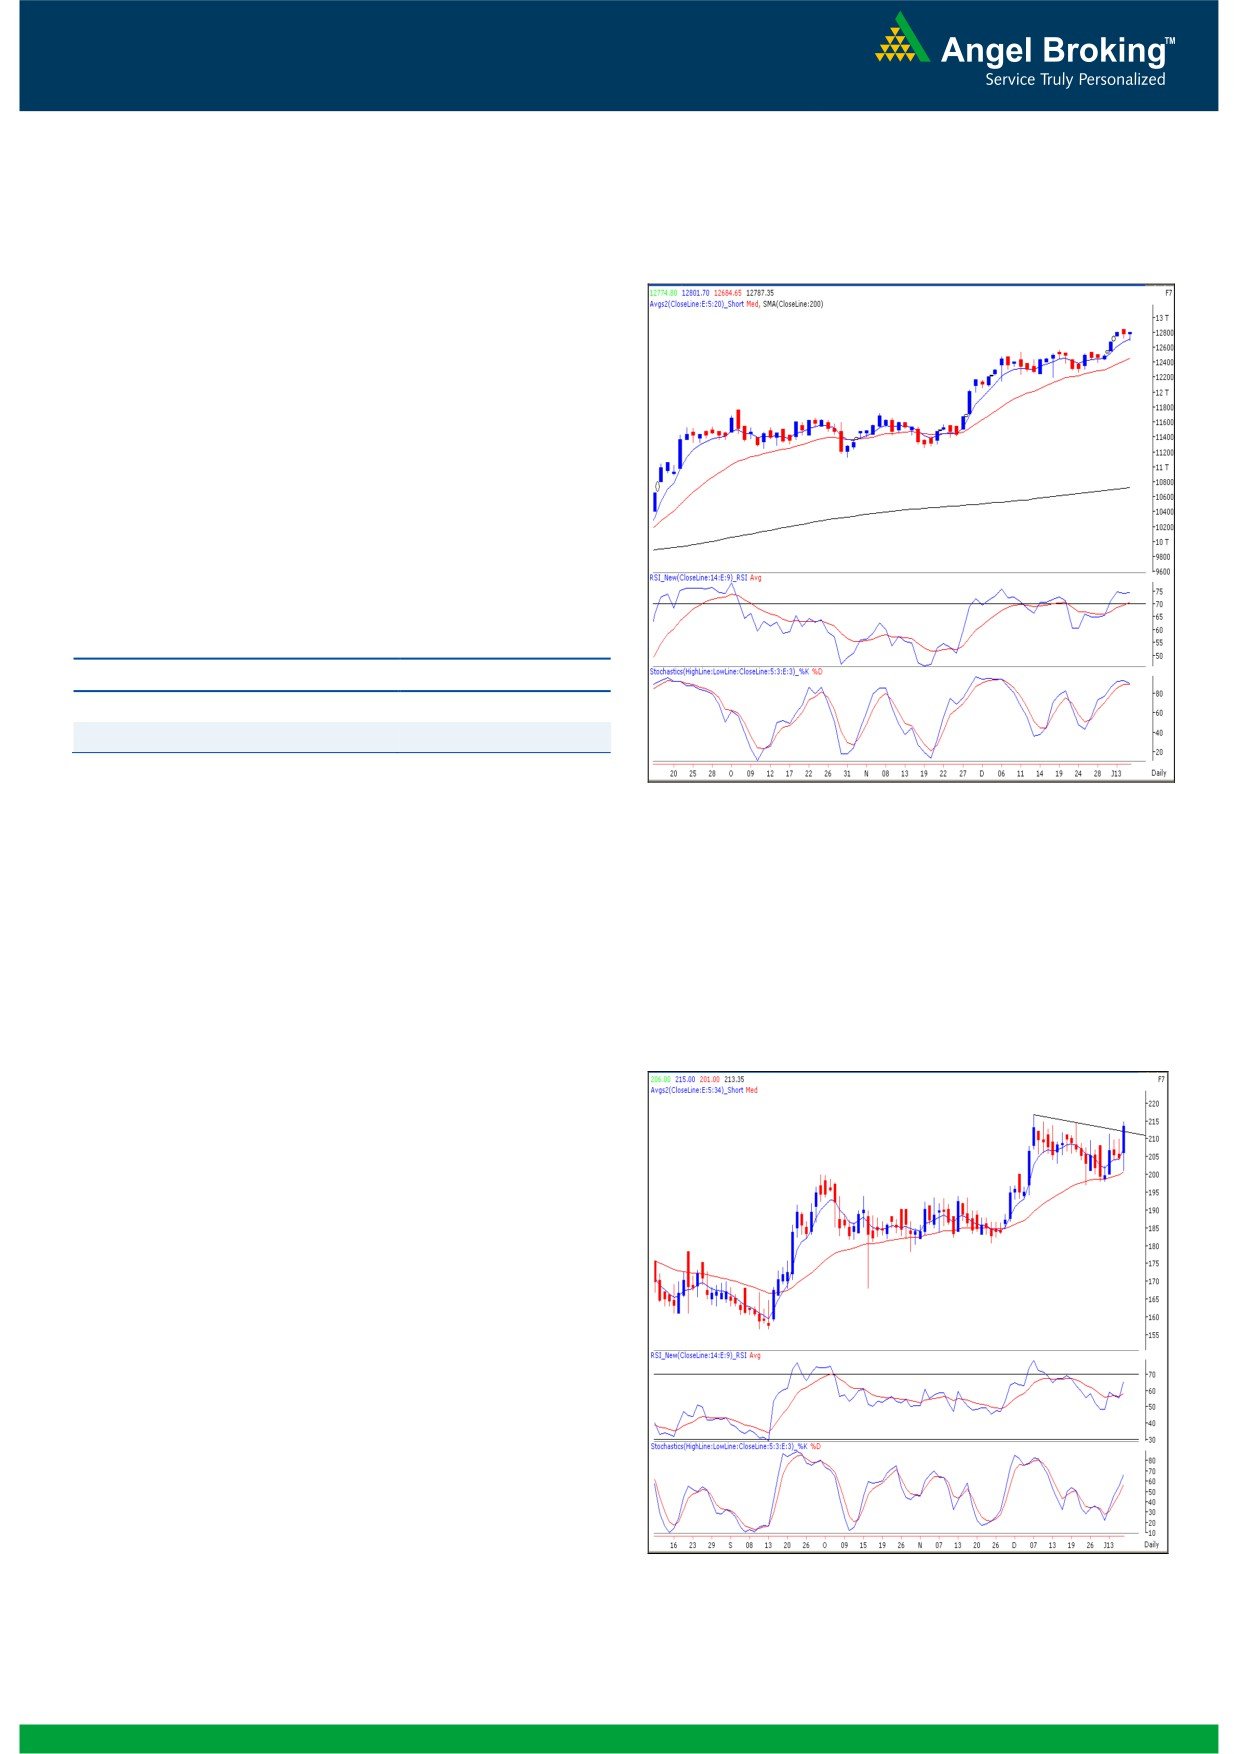
Exhibit 2: Bank Nifty Daily Chart
On Friday, the Bank Nifty once again opened on a flat note
and traded in a narrow range throughout the session.
Considering the placement of the momentum oscillators on
the daily chart we believe that the sideways consolidation in
the range of 12684 to 12838 is likely to continue for the next
few sessions. A close below the 12684 level may result in a
further correction towards 12615 - 12563 levels. The overall
bias for the index remains positive and any downward move
in the index should not be termed as a change in trend.
Actionable points:
View
Neutral
Resistance Levels
12808 - 12838
Support Levels
12684 - 12615
Source: Falcon:
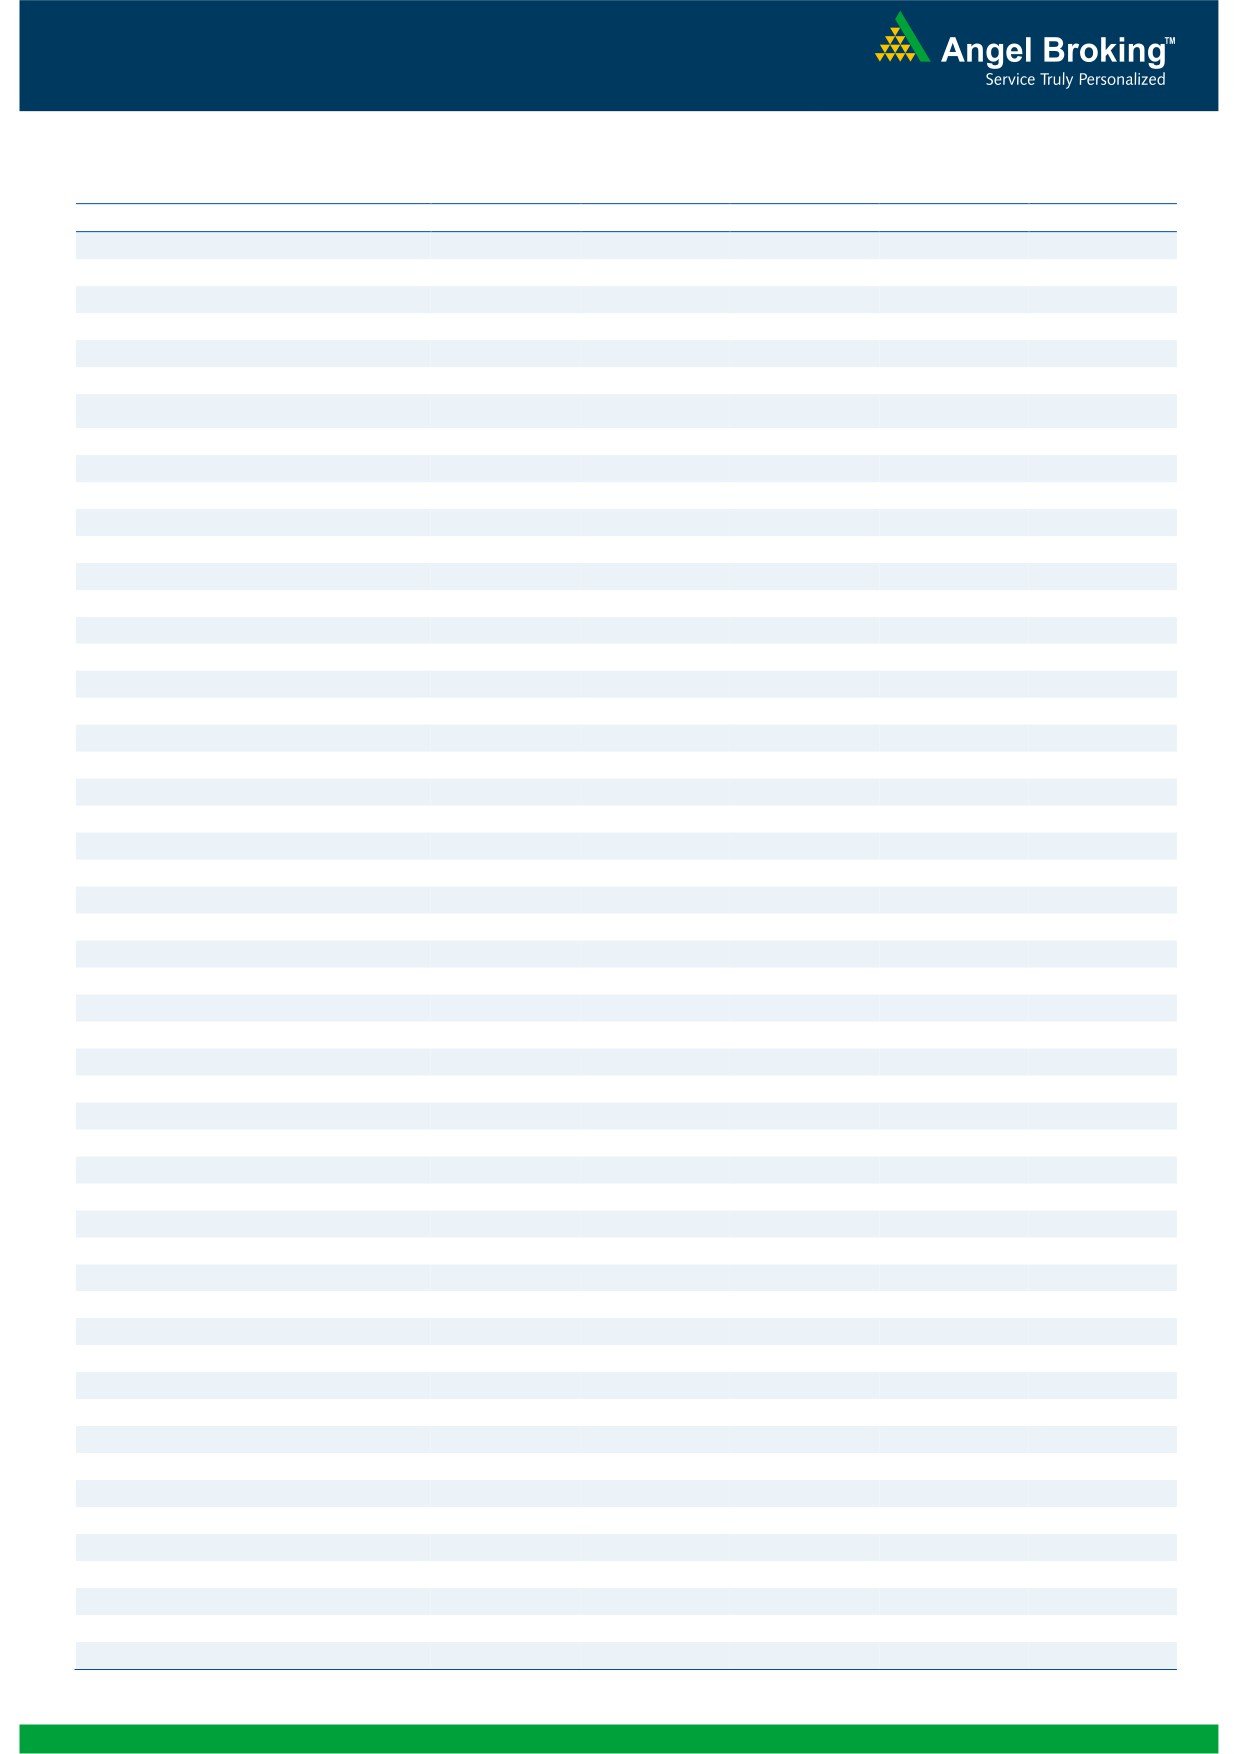
Exhibit 3: IL&FS TRANSPORTATION NETWORK
Stock Recommendation
IL&FS TRANSPORTATION NETWORK
Action
: Buy
Last Close
: ` 213.35
Stop-Loss
: ` 202
Target
: ` 235
JUSTIFICATION - On daily chart the stock has given a
trend line breakout at ` 212 with significant rise in volumes.
In addition the momentum oscillators on the daily and
weekly chart are positively poised. Hence we advise buying
the stock in the range of ` 214 - ` 208 for a target of ` 235
in coming 5 - 7 trading sessions.
Source: Falcon:
2
Daily Technical Report
January 07, 2013
Daily Pivot Levels for Nifty 50 Stocks
SCRIPS
S2
S1
PIVOT
R1
R2
SENSEX
19,636
19,710
19,754
19,828
19,871
NIFTY
5,967
5,992
6,006
6,031
6,045
BANKNIFTY
12,641
12,714
12,758
12,831
12,875
ACC
1,415
1,425
1,436
1,446
1,457
AMBUJACEM
203
204
206
208
210
ASIANPAINT
4,361
4,381
4,401
4,421
4,441
AXISBANK
1,362
1,370
1,379
1,387
1,396
BAJAJ-AUTO
2,181
2,193
2,205
2,217
2,229
BANKBARODA
871
878
885
891
898
BHARTIARTL
323
325
328
329
332
BHEL
234
238
241
245
248
BPCL
358
366
373
381
387
CAIRN
321
329
334
343
348
CIPLA
411
414
418
420
424
COALINDIA
355
360
362
366
369
DLF
232
235
237
240
241
DRREDDY
1,866
1,878
1,886
1,898
1,906
GAIL
350
361
368
378
385
GRASIM
3,120
3,155
3,185
3,219
3,249
HCLTECH
623
629
632
638
642
HDFC
821
829
837
846
854
HDFCBANK
667
673
679
685
691
HEROMOTOCO
1,859
1,874
1,884
1,899
1,909
HINDALCO
129
131
132
134
135
HINDUNILVR
526
530
533
538
541
ICICIBANK
1,158
1,170
1,177
1,190
1,197
IDFC
178
181
183
185
187
INFY
2,323
2,336
2,346
2,359
2,368
ITC
278
280
282
285
287
JINDALSTEL
448
453
459
464
470
JPASSOCIAT
99
100
101
102
103
KOTAKBANK
640
645
652
656
663
LT
1,611
1,619
1,628
1,636
1,645
LUPIN
598
601
606
609
614
M&M
924
933
938
947
952
MARUTI
1,529
1,537
1,548
1,556
1,567
NTPC
157
158
159
160
160
ONGC
274
280
284
289
294
PNB
884
896
903
915
923
POWERGRID
113
114
115
116
116
RANBAXY
508
511
516
519
524
RELIANCE
849
855
860
866
871
RELINFRA
538
542
547
552
557
SBIN
2,434
2,461
2,477
2,503
2,519
SESAGOA
197
199
202
204
206
SIEMENS
680
686
691
697
702
SUNPHARMA
722
729
733
740
744
TATAMOTORS
310
313
316
318
321
TATAPOWER
108
109
110
111
112
TATASTEEL
424
429
435
440
446
TCS
1,274
1,286
1,294
1,307
1,314
ULTRACEMCO
1,984
2,013
2,031
2,060
2,078
WIPRO
395
399
402
406
409
3
Daily Technical Report
January 07, 2013
Research Team Tel: 022 - 39357800
DISCLAIMER
This document is solely for the personal information of the recipient, and must not be singularly used as the basis of any investment
decision. Nothing in this document should be construed as investment or financial advice. Each recipient of this document should make
such investigations as they deem necessary to arrive at an independent evaluation of an investment in the securities of the companies
referred to in this document (including the merits and risks involved), and should consult their own advisors to determine the merits and
risks of such an investment.
Angel Broking Limited, its affiliates, directors, its proprietary trading and investment businesses may, from time to time, make
investment decisions that are inconsistent with or contradictory to the recommendations expressed herein. The views contained in this
document are those of the analyst, and the company may or may not subscribe to all the views expressed within.
Reports based on technical and derivative analysis center on studying charts of a stock's price movement, outstanding positions and
trading volume, as opposed to focusing on a company's fundamentals and, as such, may not match with a report on a company's
fundamentals.
The information in this document has been printed on the basis of publicly available information, internal data and other reliable
sources believed to be true, but we do not represent that it is accurate or complete and it should not be relied on as such, as this
document is for general guidance only. Angel Broking Limited or any of its affiliates/ group companies shall not be in any way
responsible for any loss or damage that may arise to any person from any inadvertent error in the information contained in this report.
Angel Broking Limited has not independently verified all the information contained within this document. Accordingly, we cannot testify,
nor make any representation or warranty, express or implied, to the accuracy, contents or data contained within this document. While
Angel Broking Limited endeavours to update on a reasonable basis the information discussed in this material, there may be regulatory,
compliance, or other reasons that prevent us from doing so.
This document is being supplied to you solely for your information, and its contents, information or data may not be reproduced,
redistributed or passed on, directly or indirectly.
Angel Broking Limited and its affiliates may seek to provide or have engaged in providing corporate finance, investment banking or
other advisory services in a merger or specific transaction to the companies referred to in this report, as on the date of this report or in
the past.
Neither Angel Broking Limited, nor its directors, employees or affiliates shall be liable for any loss or damage that may arise from or in
connection with the use of this information.
Note: Please refer to the important `Stock Holding Disclosure' report on the Angel website (Research Section). Also, please refer to the
latest update on respective stocks for the disclosure status in respect of those stocks. Angel Broking Limited and its affiliates may have
investment positions in the stocks recommended in this report.
Research Team
Shardul Kulkarni
-
Head - Technicals
Sameet Chavan
-
Technical Analyst
Sacchitanand Uttekar
-
Technical Analyst
Mehul Kothari
-
Technical Analyst
Ankur Lakhotia
-
Technical Analyst
Angel Broking Pvt. Ltd.
Registered Office: G-1, Ackruti Trade Centre, Rd. No. 7, MIDC, Andheri (E), Mumbai - 400 093.
Corporate Office: 6th Floor, Ackruti Star, MIDC, Andheri (E), Mumbai - 400 093. Tel: (022) 3952 6600
Sebi Registration No: INB 010996539
4