Daily Technical Report
December 06, 2012
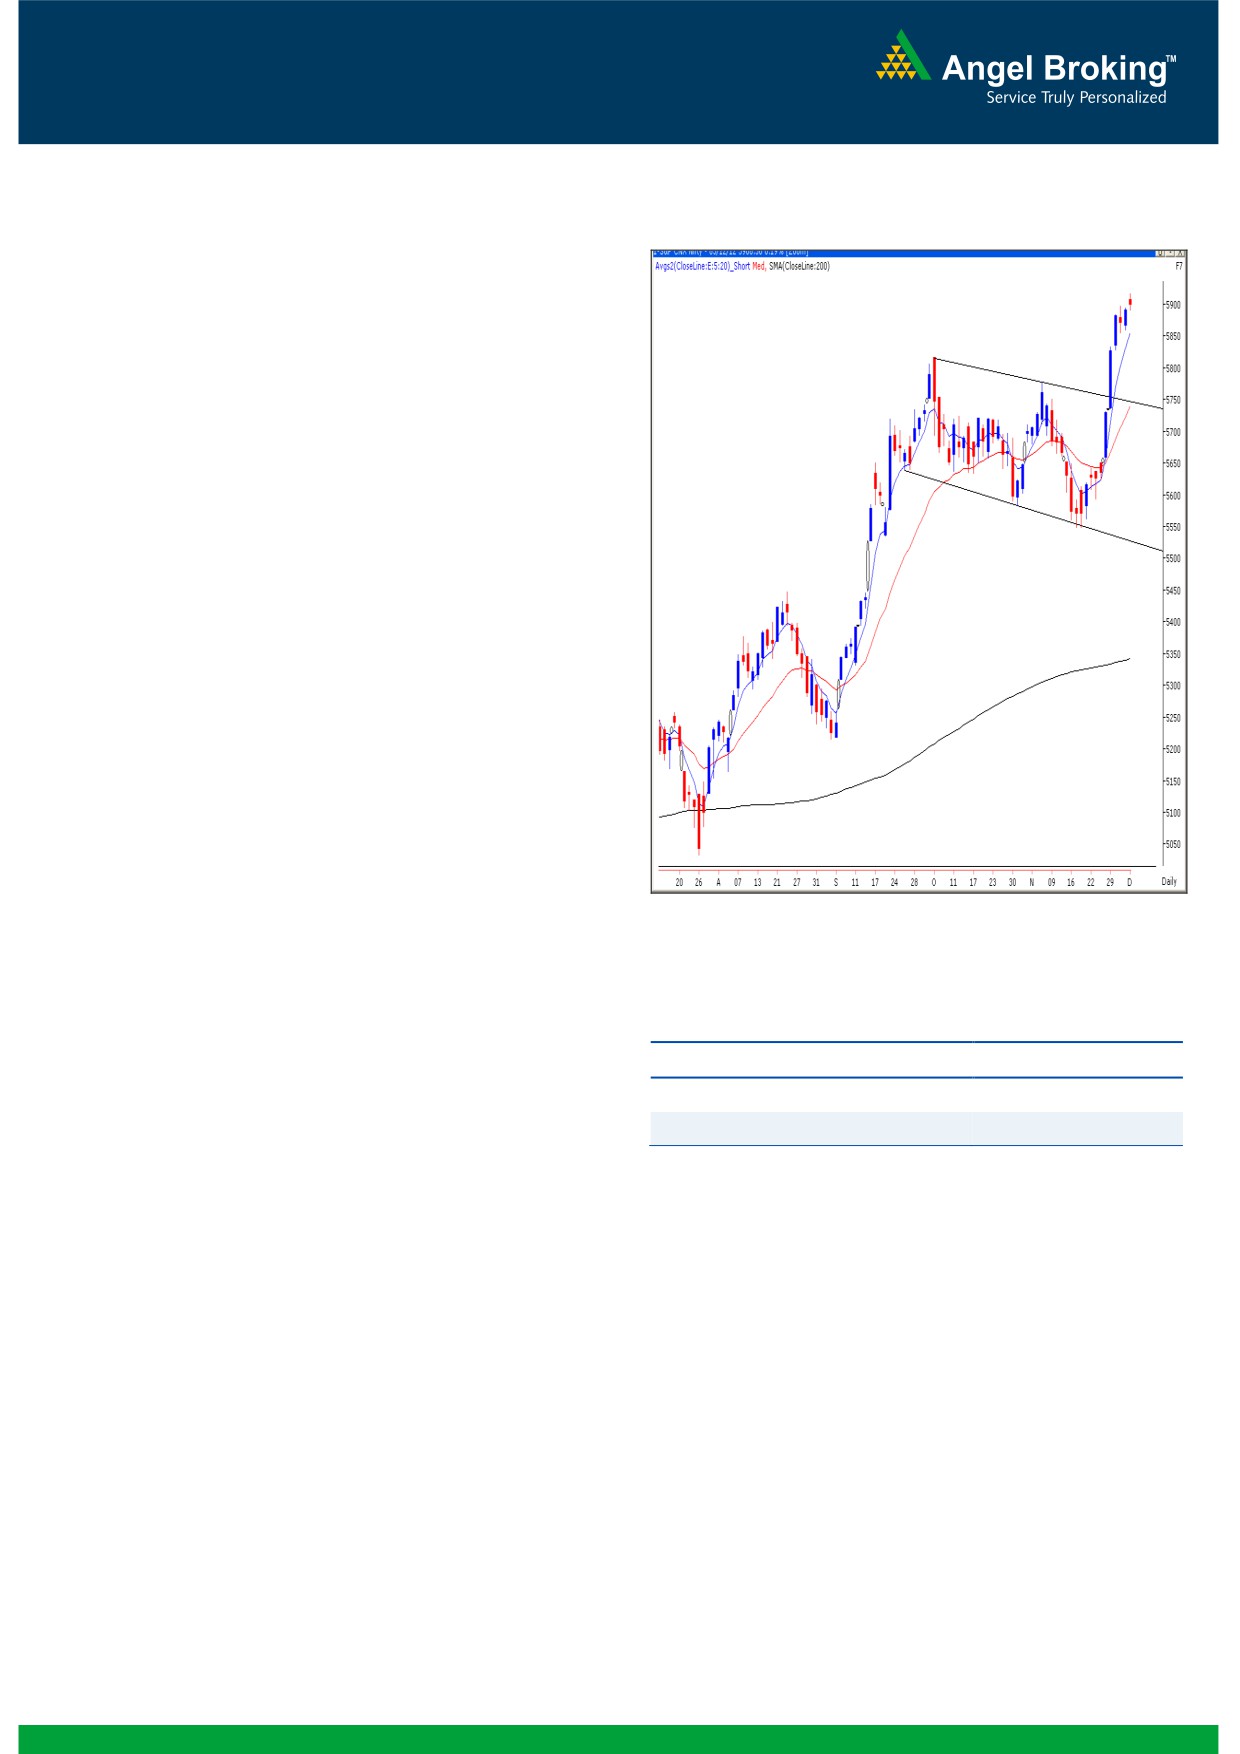
Exhibit 1: Nifty Daily Chart
Sensex (19392) / NIFTY (5901)
Yesterday, our benchmark indices opened marginally higher
in-line with strong cues from other Asian bourses (especially,
Hang Sang and Shanghai Composite). This resulted in the
Nifty edging above 5900 mark during the initial hour of the
session. However, the price action during the day was
lackluster similar to previous couple of trading sessions.
Realty and Metal sectors outperformed in yesterday’s trading
session; whereas the IT and Teck counters kept our market
under pressure. The advance to decline ratio was strongly in
favor of advancing counters (A=1688 D=1227) (Source -
Formation
The ’20-day EMA’ and the ’20-week EMA’ are placed at
18702 / 5687 and 18281/ 5552 levels, respectively.
On the weekly chart, we are witnessing a breakout from
‘Downward Sloping Trend Line’ joining two significant
swing high of 19811 / 5944 (April 2011) and 19137 /
5815 (Oct 2012) at 19050 / 5800 level.
The target of the daily ‘Channel’ pattern breakout comes
around 19500 / 5950 level.
Source: Falcon:
The weekly ‘Stochastic’ and the ‘RSI’ oscillators are now
signaling a positive crossover.
Actionable points:
Trading strategy:
Yesterday, we witnessed yet another session with lackluster
View for the day
Neutral
activity and a narrow trading range. Further, initial gap
Resistance Level
5918 - 5945
opening above the high of ‘Spinning Top’ candle has
Support Levels
5854 - 5800
negated the pattern. However, the daily chart now depicts yet
another ‘Narrow Range Body’ formation. Hence, the
uncertainty among market participants still persists. Going
forward, yesterday’s high of 19464 / 5918 will now act as a
resistance in coming trading session. Only a sustainable
move beyond this level, with strong volumes, may ultimately
push indices to our mentioned level of 19812 / 5945. On
the other hand, a breach of yesterday’s low would trigger
intraday pessimism in the market. In this case, we may see
weakness up to 19257 - 19000 / 5854 - 5800 levels.
1
Daily Technical Report
December 06, 2012
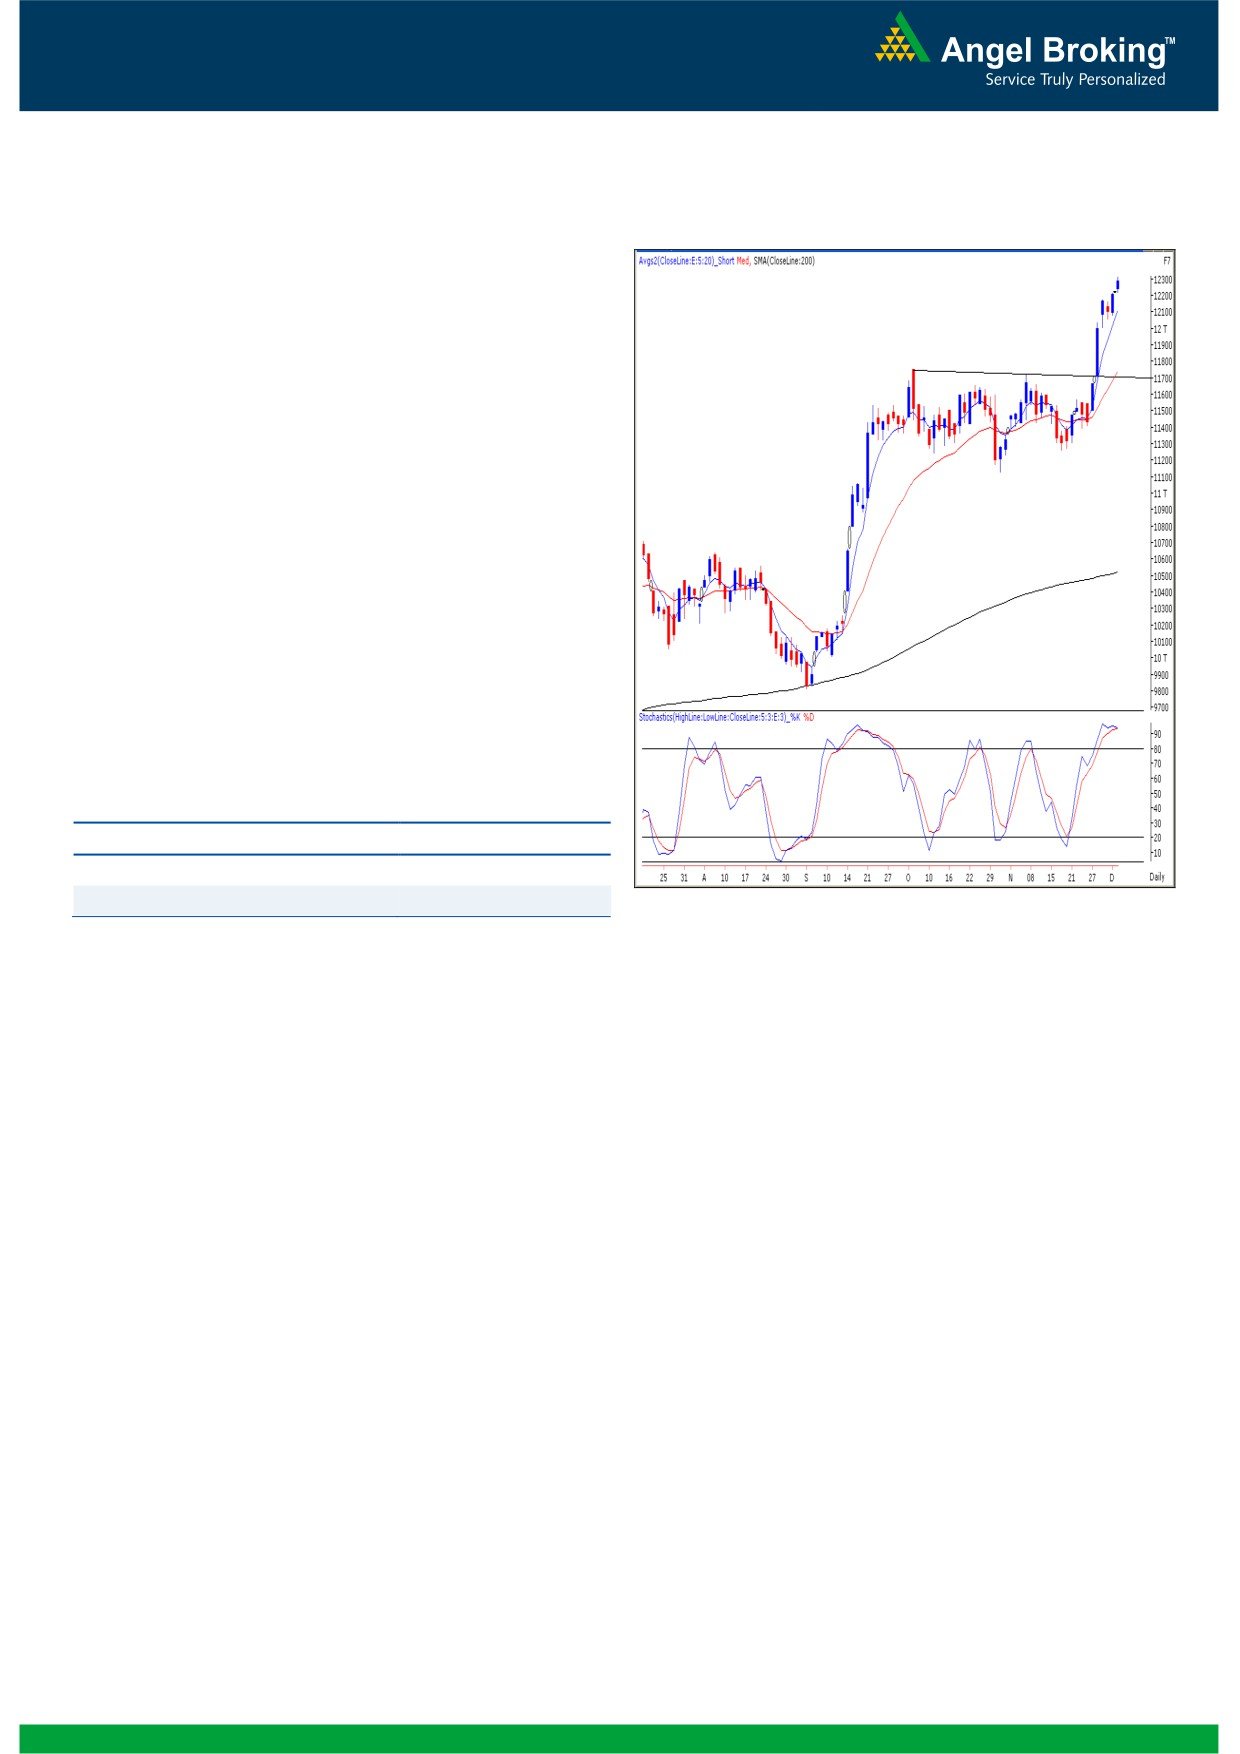
Exhibit 2: Bank Nifty Hourly Chart
Bank Nifty Outlook - (12282)
Yesterday, Bank Nifty opened with an upside gap in line with
our benchmark indices and traded in a narrow range
throughout the session. The negative divergence in “RSI”
momentum oscillator on the hourly chart coupled with
overbought condition on momentum oscillator “Stochastic” on
daily chart mentioned in our previous report is still intact. The
index is now approaching the resistance zone 12335 -
12365, hence we believe that the ongoing consolidation
phase is likely to continue. Any pullback in the index would be
seen only if the index falls below 12053 level. On the upside
12335 - 12365 are likely to act as resistance and 12219 -
12106 levels are likely to act as support for the day. Traders
are advised not to create any fresh long positions in the index
at this point of time.
Actionable points:
View for the day
Neutral
Resistance Levels
12335 - 12365
Support Levels
12219 - 12106
Source: Falcon:
2
Daily Technical Report
December 06, 2012
Research Team Tel: 022 - 39357800
DISCLAIMER
This document is solely for the personal information of the recipient, and must not be singularly used as the basis of any investment
decision. Nothing in this document should be construed as investment or financial advice. Each recipient of this document should make
such investigations as they deem necessary to arrive at an independent evaluation of an investment in the securities of the companies
referred to in this document (including the merits and risks involved), and should consult their own advisors to determine the merits and
risks of such an investment.
Angel Broking Limited, its affiliates, directors, its proprietary trading and investment businesses may, from time to time, make
investment decisions that are inconsistent with or contradictory to the recommendations expressed herein. The views contained in this
document are those of the analyst, and the company may or may not subscribe to all the views expressed within.
Reports based on technical and derivative analysis center on studying charts of a stock's price movement, outstanding positions and
trading volume, as opposed to focusing on a company's fundamentals and, as such, may not match with a report on a company's
fundamentals.
The information in this document has been printed on the basis of publicly available information, internal data and other reliable
sources believed to be true, but we do not represent that it is accurate or complete and it should not be relied on as such, as this
document is for general guidance only. Angel Broking Limited or any of its affiliates/ group companies shall not be in any way
responsible for any loss or damage that may arise to any person from any inadvertent error in the information contained in this report.
Angel Broking Limited has not independently verified all the information contained within this document. Accordingly, we cannot testify,
nor make any representation or warranty, express or implied, to the accuracy, contents or data contained within this document. While
Angel Broking Limited endeavours to update on a reasonable basis the information discussed in this material, there may be regulatory,
compliance, or other reasons that prevent us from doing so.
This document is being supplied to you solely for your information, and its contents, information or data may not be reproduced,
redistributed or passed on, directly or indirectly.
Angel Broking Limited and its affiliates may seek to provide or have engaged in providing corporate finance, investment banking or
other advisory services in a merger or specific transaction to the companies referred to in this report, as on the date of this report or in
the past.
Neither Angel Broking Limited, nor its directors, employees or affiliates shall be liable for any loss or damage that may arise from or in
connection with the use of this information.
Note: Please refer to the important `Stock Holding Disclosure' report on the Angel website (Research Section). Also, please refer to the
latest update on respective stocks for the disclosure status in respect of those stocks. Angel Broking Limited and its affiliates may have
investment positions in the stocks recommended in this report.
Research Team
Shardul Kulkarni
-
Head - Technicals
Sameet Chavan
-
Technical Analyst
Sacchitanand Uttekar
-
Technical Analyst
Mehul Kothari
-
Technical Analyst
Ankur Lakhotia
-
Technical Analyst
Angel Broking Pvt. Ltd.
Registered Office: G-1, Ackruti Trade Centre, Rd. No. 7, MIDC, Andheri (E), Mumbai - 400 093.
Corporate Office: 6th Floor, Ackruti Star, MIDC, Andheri (E), Mumbai - 400 093. Tel: (022) 3952 6600
Sebi Registration No: INB 010996539
4