Daily Technical Report
November 06, 2012
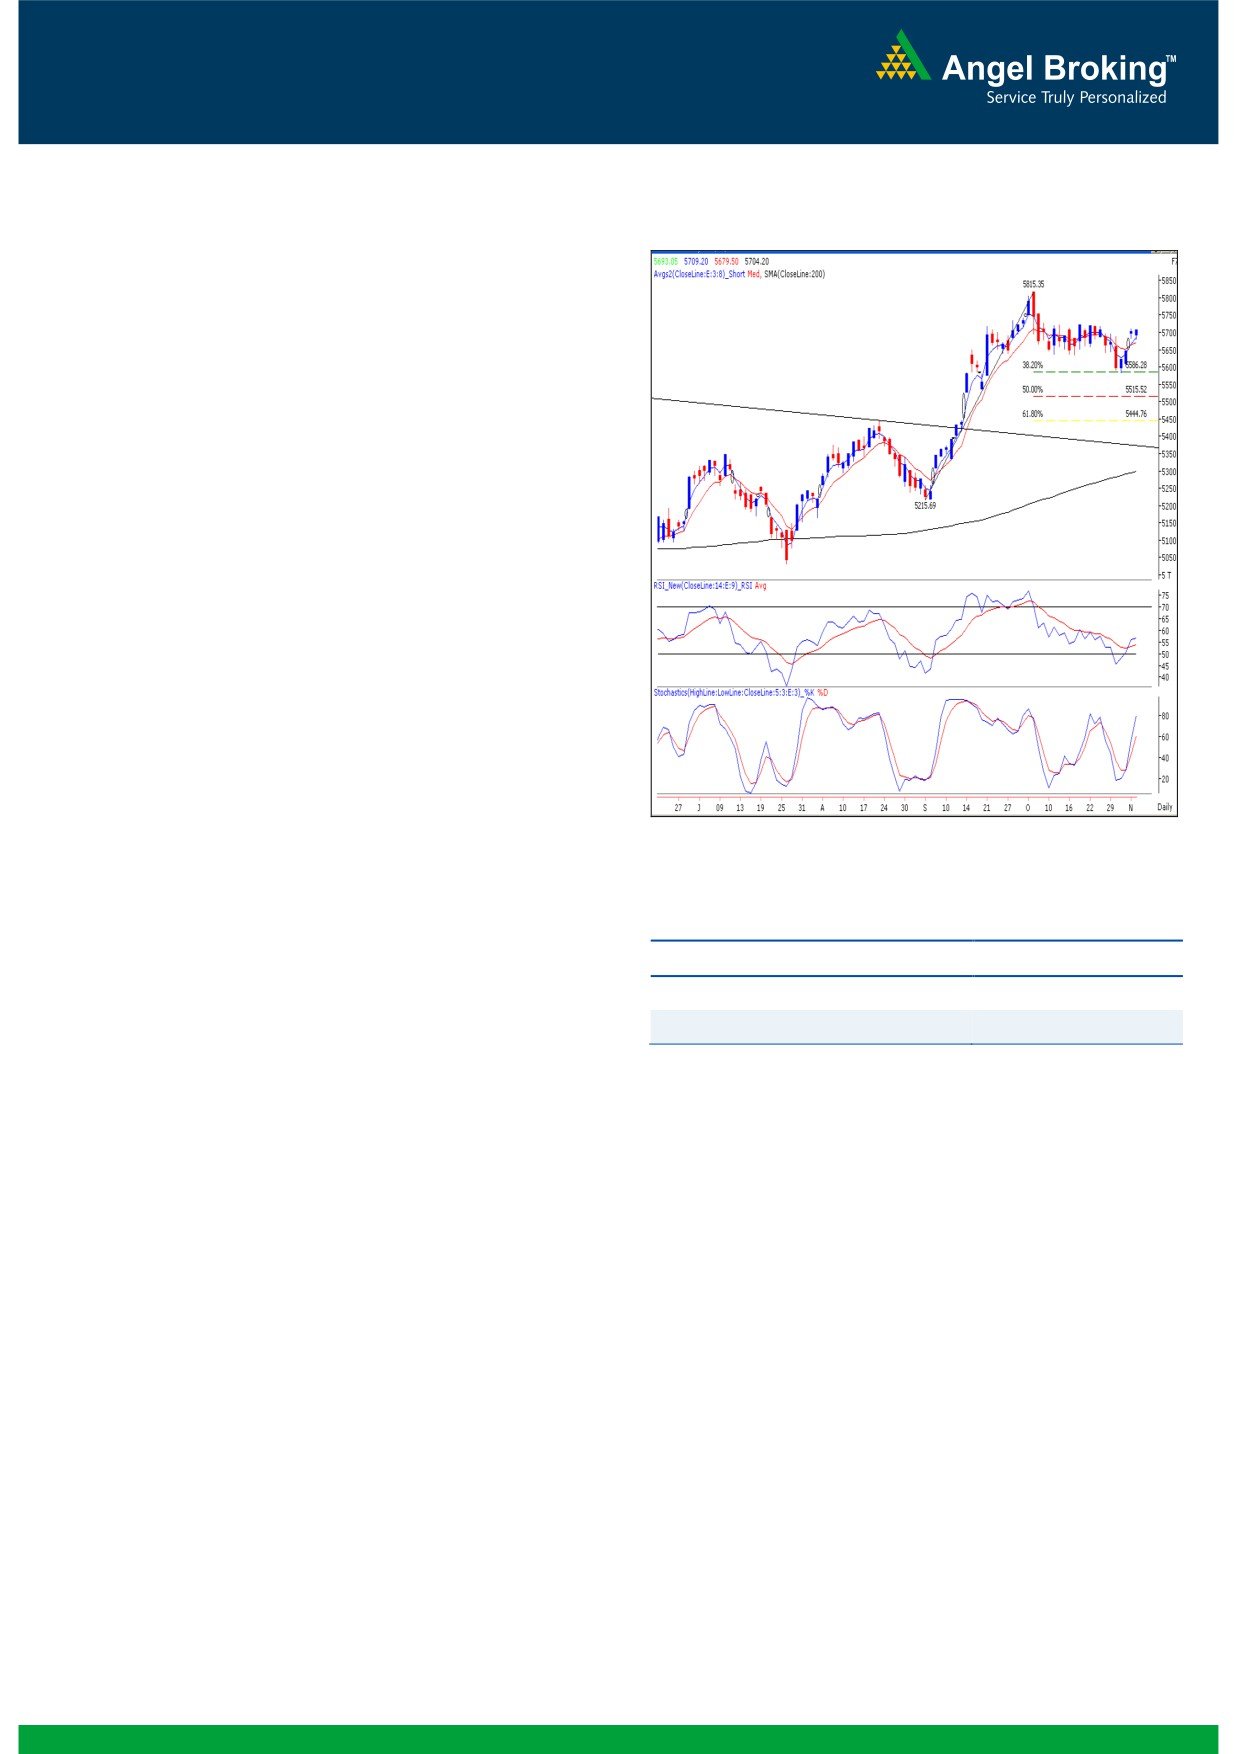
Exhibit 1: Nifty Daily Chart
Sensex (18763) / NIFTY (5704)
Considering most of the Asian indices, yesterday our
benchmark indices too started the week on quiet note.
Subsequently, extremely lackluster movement was seen
throughout the day as indices traded within the half a
percent range to close marginally above the psychological
level of 5700. Yesterday, the defensive sectors like, FMCG
and Heath Care were among the major gainers; whereas
the Power, Metal and Auto sectors were among the major
draggers. The advance to decline ratio was in favor of
declining counters (A=1356 D=1496) (Source
-
Formation
The ’20-day EMA’ and the ’20-week EMA’ are placed at
18625 / 5659 and 18060/ 5478 levels, respectively.
The monthly ‘RSI’ oscillator is moving higher from the 50
mark and the positive in the ADX (9) indicator is intact.
The negative crossover in the weekly ‘Stochastic’
Source: Falcon:
oscillator is still intact.
The daily momentum oscillators and ‘3 & 8 EMA’ are
Actionable points:
now signaling a positive crossover.
The 38.2% and 50% Fibonacci Retracement levels of the
View for the day
Bullish Above 5729
rise from 17250 to 19138 / 5216 to 5815 are placed at
Expected targets
5757 - 5816
18416 / 5586 and 18194 / 5515, respectively.
Support levels
5679- 5650
Trading strategy:
Similar to most of the trading sessions in the month of
October, yesterday’s session too was directionless and
sluggish. During the first half, indices corrected from the
highs and precisely tested the hourly ’20-EMA’ level of
18680 / 5680. The positive crossover of the daily ‘3 & 8
EMA’ and the momentum oscillators are still intact. Going
forward, we reiterate our view that if our benchmark indices
sustain above 18535 / 5729 level, then we are likely to
witness a rally towards 18973 - 19138 / 5757 - 5816. A
move beyond
19138
/
5816 would attract immense
optimism in the market and as a result, the up move may get
extended towards 19542 - 19812 / 5850 - 5945 levels. On
the flip side, yesterday’s low of 18683 / 5679 would act as
an immediate support. A breach of this level may trigger
intraday pessimism in the market.
1
Daily Technical Report
November 06, 2012
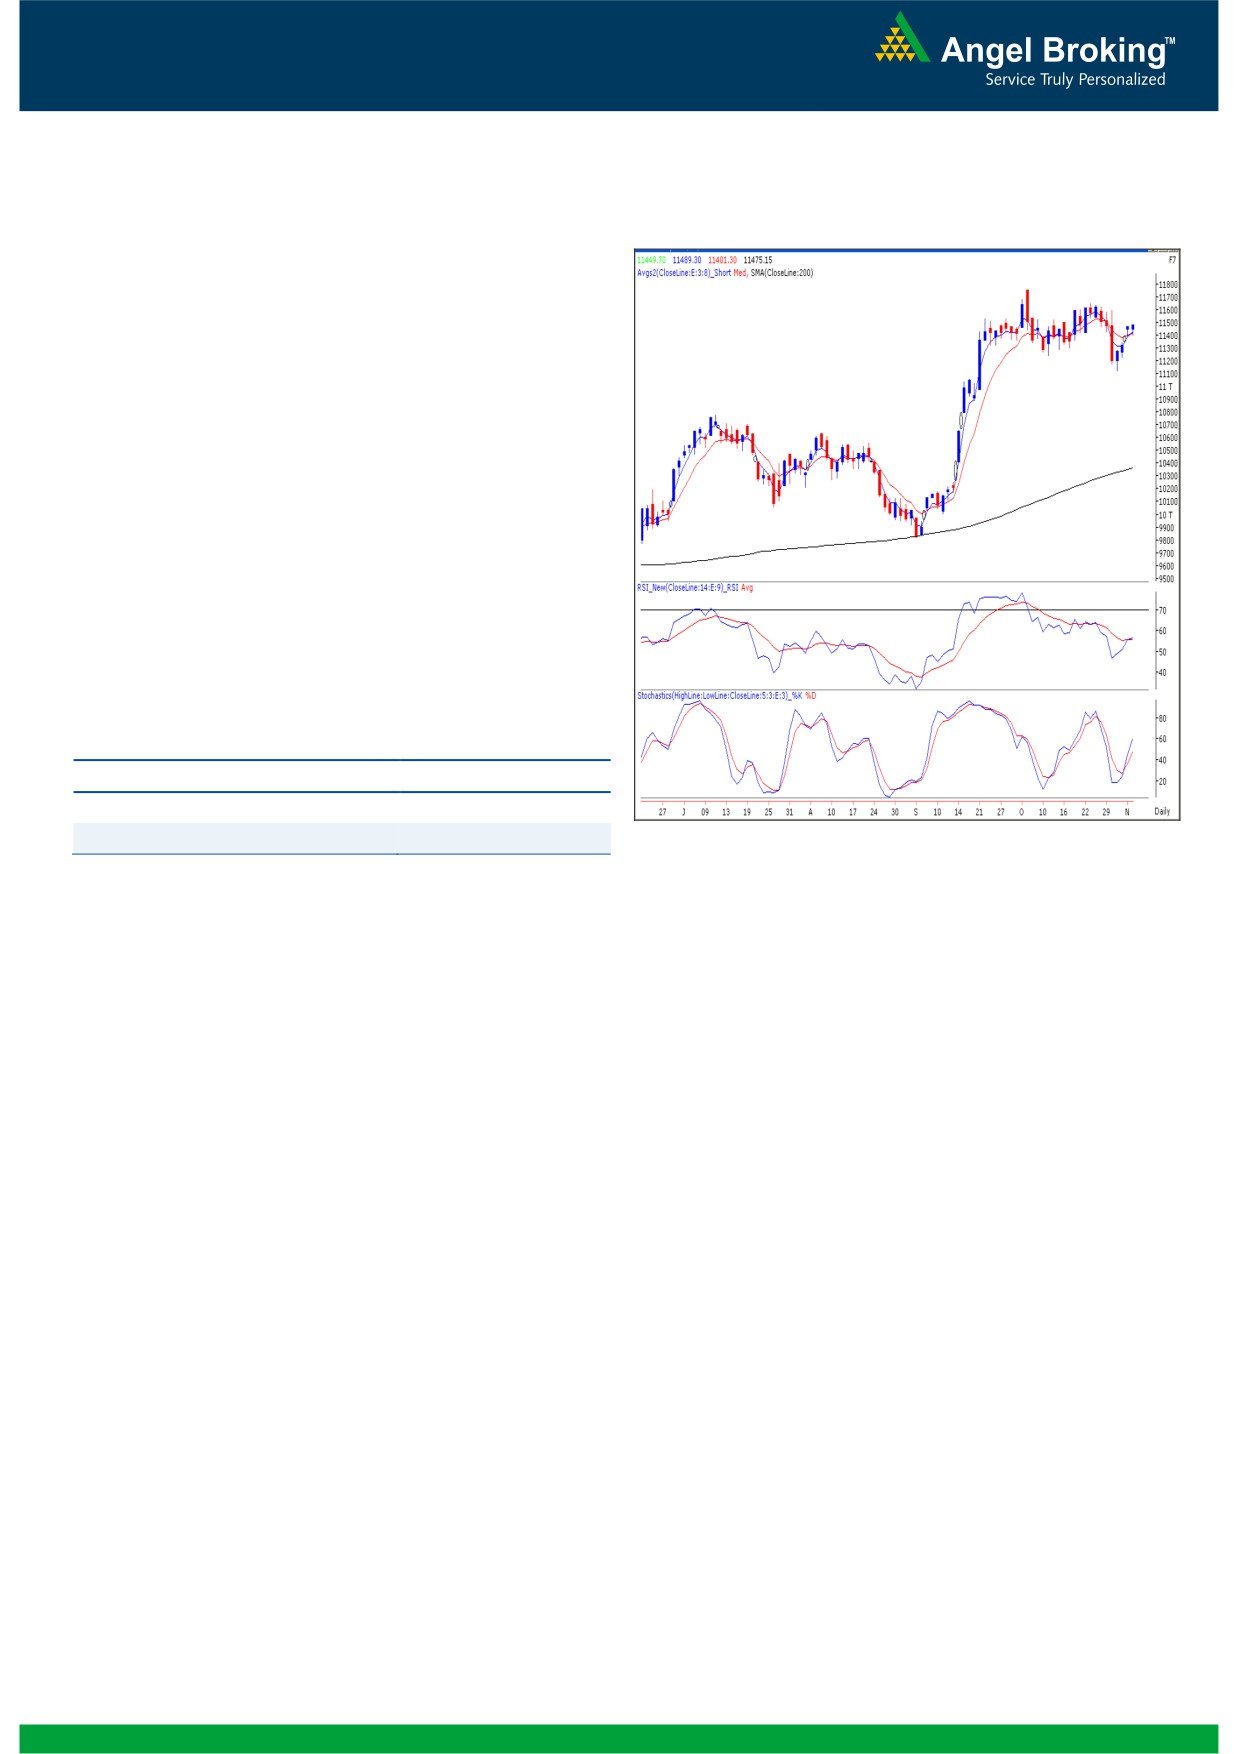
Exhibit 2: Bank Nifty Daily Chart
Bank Nifty Outlook - (11475)
Yesterday, Bank Nifty opened on a flat note and traded in
a narrow range throughout the session to close with a
minimal gain of
0.13%. The momentum oscillator
“Stochastic” on the daily chart continues with a buy signal.
There is no significant change in price structure post
yesterday’s session and we continue to mention that the
index shows a “Falling Three” Candlestick pattern in the
making. However, the pattern requires a confirmation in
the form of a close below the 11174. On the upside
11543 - 11600 levels are likely to act as resistance and
11394 - 11298 levels are likely to act as support in
coming trading session.
Actionable points:
View for the day
Neutral
Resistance Levels
11543 - 11600
Support Levels
11394 - 11298
Source: Falcon:
2
Daily Technical Report
November 06, 2012
Research Team Tel: 022 - 39357800
DISCLAIMER
This document is solely for the personal information of the recipient, and must not be singularly used as the basis of any investment
decision. Nothing in this document should be construed as investment or financial advice. Each recipient of this document should make
such investigations as they deem necessary to arrive at an independent evaluation of an investment in the securities of the companies
referred to in this document (including the merits and risks involved), and should consult their own advisors to determine the merits and
risks of such an investment.
Angel Broking Limited, its affiliates, directors, its proprietary trading and investment businesses may, from time to time, make
investment decisions that are inconsistent with or contradictory to the recommendations expressed herein. The views contained in this
document are those of the analyst, and the company may or may not subscribe to all the views expressed within.
Reports based on technical and derivative analysis center on studying charts of a stock's price movement, outstanding positions and
trading volume, as opposed to focusing on a company's fundamentals and, as such, may not match with a report on a company's
fundamentals.
The information in this document has been printed on the basis of publicly available information, internal data and other reliable
sources believed to be true, but we do not represent that it is accurate or complete and it should not be relied on as such, as this
document is for general guidance only. Angel Broking Limited or any of its affiliates/ group companies shall not be in any way
responsible for any loss or damage that may arise to any person from any inadvertent error in the information contained in this report.
Angel Broking Limited has not independently verified all the information contained within this document. Accordingly, we cannot testify,
nor make any representation or warranty, express or implied, to the accuracy, contents or data contained within this document. While
Angel Broking Limited endeavours to update on a reasonable basis the information discussed in this material, there may be regulatory,
compliance, or other reasons that prevent us from doing so.
This document is being supplied to you solely for your information, and its contents, information or data may not be reproduced,
redistributed or passed on, directly or indirectly.
Angel Broking Limited and its affiliates may seek to provide or have engaged in providing corporate finance, investment banking or
other advisory services in a merger or specific transaction to the companies referred to in this report, as on the date of this report or in
the past.
Neither Angel Broking Limited, nor its directors, employees or affiliates shall be liable for any loss or damage that may arise from or in
connection with the use of this information.
Note: Please refer to the important `Stock Holding Disclosure' report on the Angel website (Research Section). Also, please refer to the
latest update on respective stocks for the disclosure status in respect of those stocks. Angel Broking Limited and its affiliates may have
investment positions in the stocks recommended in this report.
Research Team
Shardul Kulkarni
-
Head - Technicals
Sameet Chavan
-
Technical Analyst
Sacchitanand Uttekar
-
Technical Analyst
Mehul Kothari
-
Technical Analyst
Ankur Lakhotia
-
Technical Analyst
Angel Broking Pvt. Ltd.
Registered Office: G-1, Ackruti Trade Centre, Rd. No. 7, MIDC, Andheri (E), Mumbai - 400 093.
Corporate Office: 6th Floor, Ackruti Star, MIDC, Andheri (E), Mumbai - 400 093. Tel: (022) 3952 6600
Sebi Registration No: INB 010996539
4