Daily Technical Report
September 06, 2012
Sensex (17313) / NIFTY (5226)
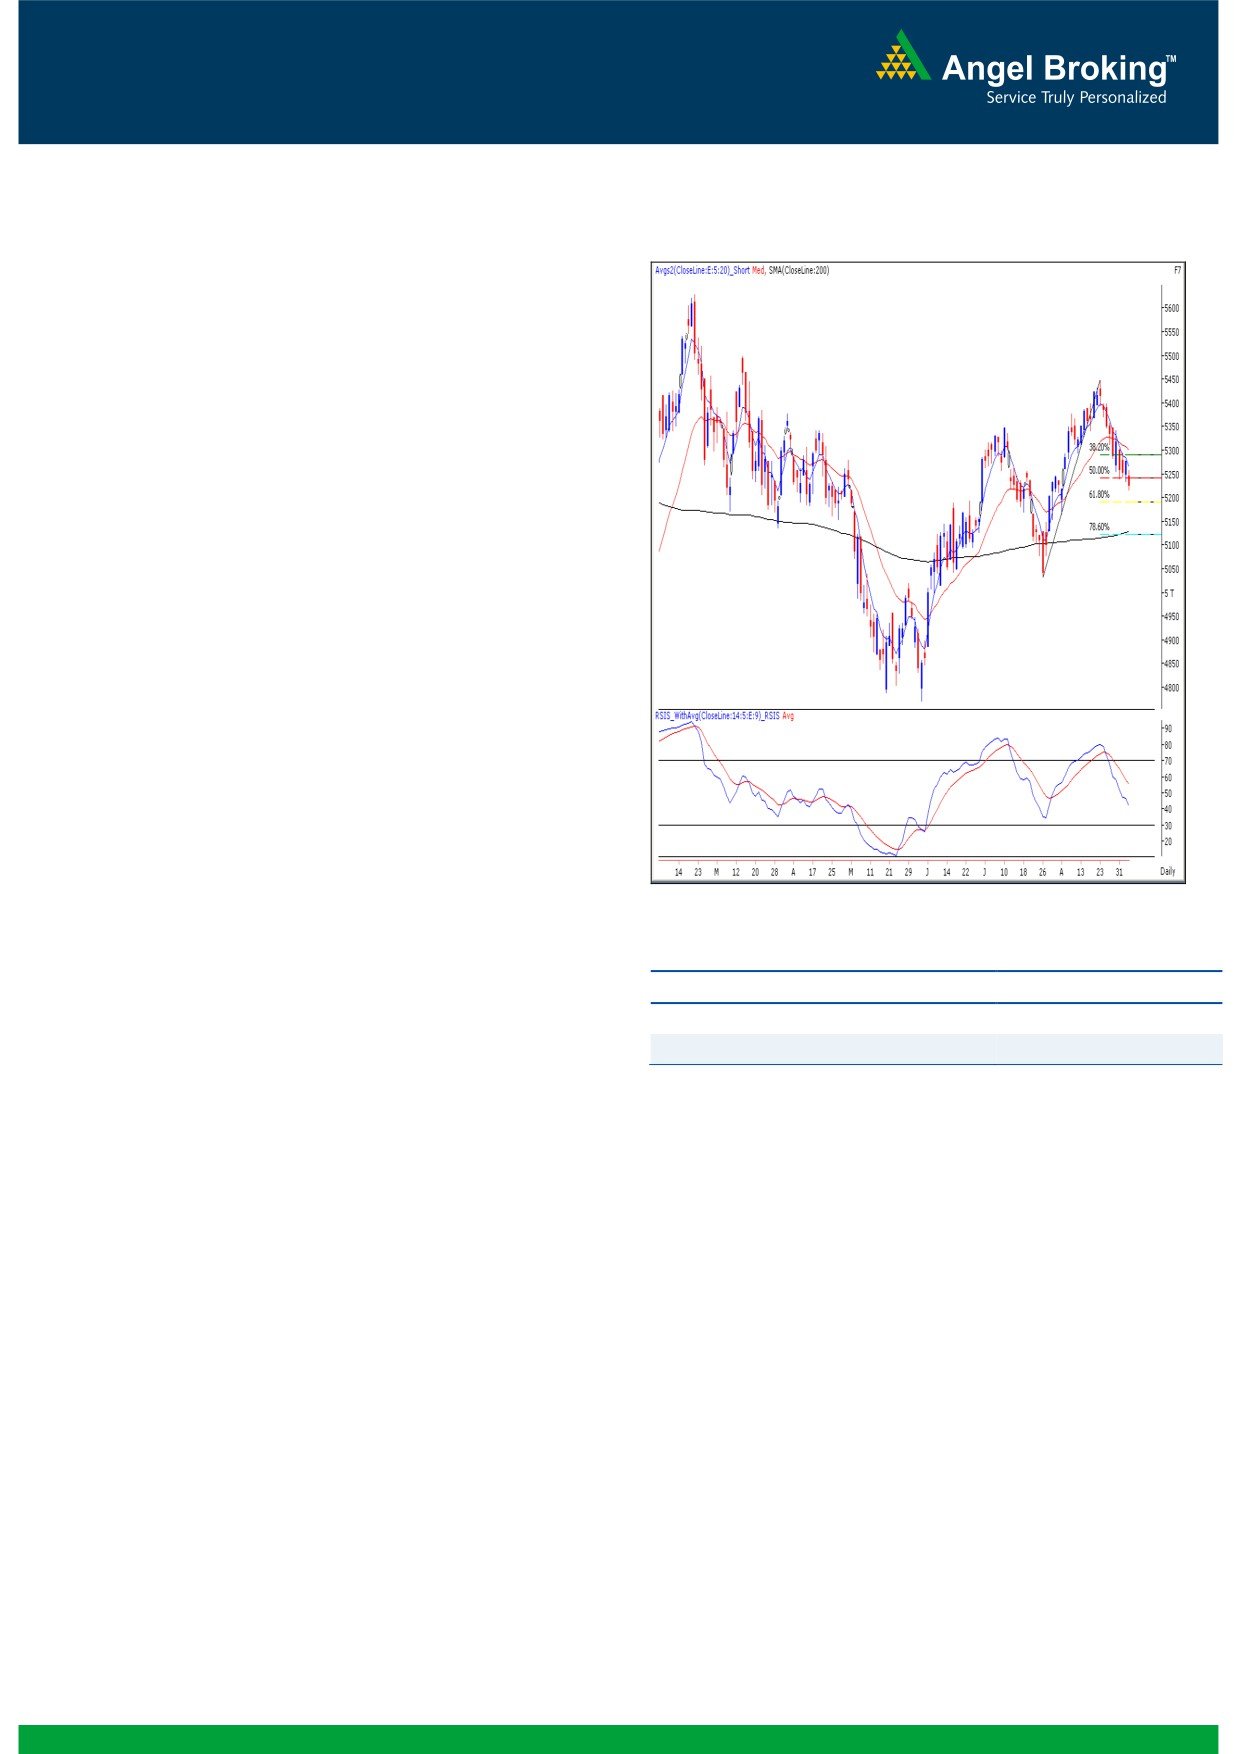
Exhibit 1: Nifty Daily Chart
Yesterday, our benchmark indices opened with a downside
gap in-line with negative Asian bourses (Especially Hang
Seng). After a brief consolidation, indices corrected sharply
during the second half to close marginally above
5200
mark. Once again a strong selling pressure was seen in
Metal, Capital Goods and Banking sectors, whereas FMCG
and Teck ended marginally in the positive territory. The
advance to decline ratio was in favor of declining counters
Formation
The ’20-day EMA’ and the ’200-day SMA’ are placed at
17560 / 5316 and 16920 / 5120 levels, respectively.
Looking at the “Line Chart” it is clear that indices have
now confirmed the ‘Higher Top
- Higher Bottom’
formation on the weekly chart after August 28, 2009.
The weekly momentum oscillators’ viz., the RSI and the
Stochastic are signaling a negative crossover.
Source: Falcon:
Trading strategy:
Actionable points:
View
Neutral
Despite a decently positive closing on Tuesday’s session, our
markets failed to carry forward the same momentum. After a
Resistance Levels
5279 - 5316
gap down opening, indices continued to trade with negative
Support Levels
5215 - 5190
bias post midsession and eventually closed around the ’20-
week EMA’ placed at 17218 / 5215 level. Indices are now
hovering around a strong support zone of 17218 - 17123 /
5215 - 5190. Hence, a closing below 17123 / 5190 level
may augment further selling momentum in the markets. As a
result, indices may then slide towards 16892 / 5120 level.
Conversely, the resistance levels are seen at 17416 - 17560
/ 5279 - 5316 levels. We reiterate that only a sustainable
move above this level is likely to change the underlying
negative sentiment. The broader markets are substantially
negative and which sector will lead the market higher is the
question that remains unanswered.
1
Daily Technical Report
September 06, 2012
Bank Nifty Outlook - (9828)
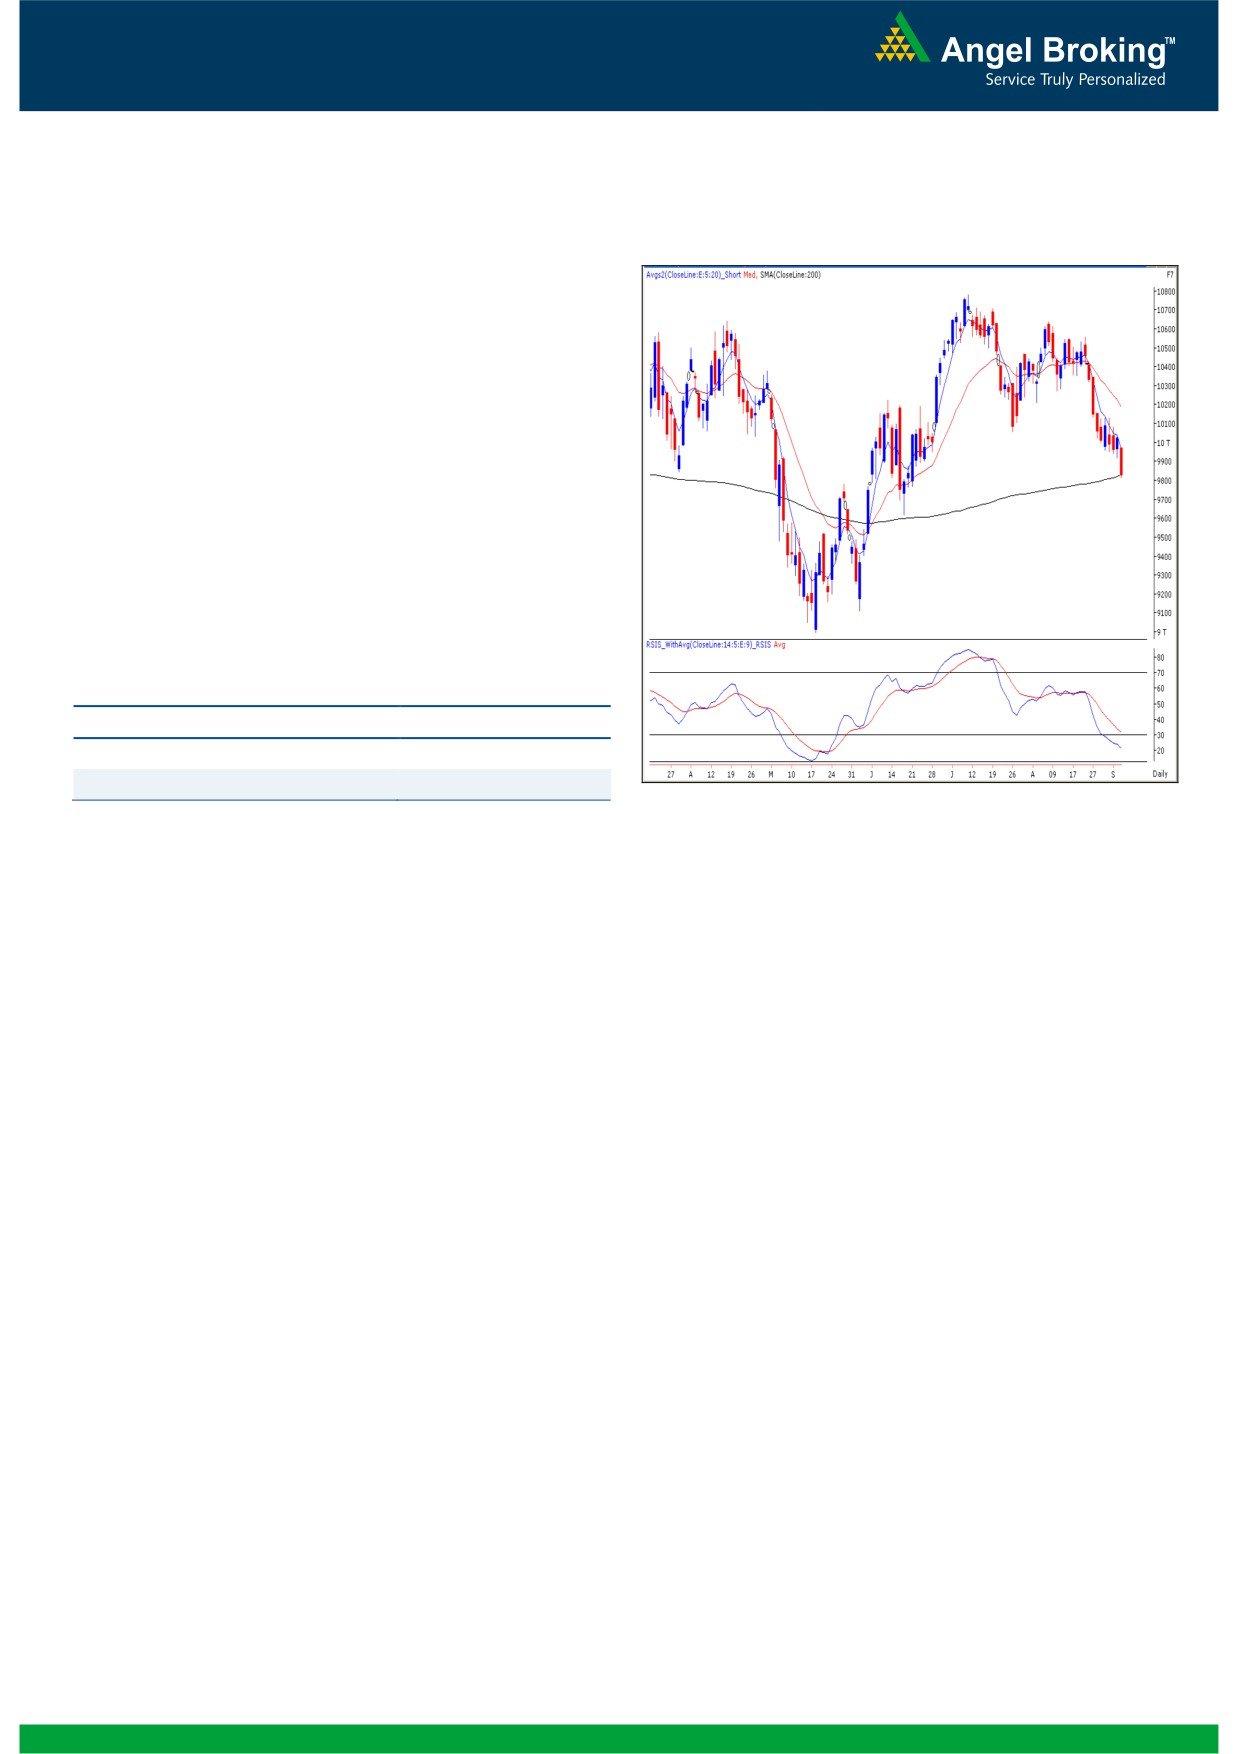
Exhibit 2: Bank Nifty Daily Chart
Yesterday, Bank Nifty opened on a pessimistic note and
selling pressure throughout the day led the index to close
near day’s low. The selling pressure intensified on the breach
of important support level of 9914. The index is currently
hovering around its “200 day SMA” currently at
9826
coupled with positive divergence in “RSI” momentum
oscillator on the hourly chart. Due to the above mentioned
reasons we advise traders to refrain from creating fresh short
positions. On the upside 9914 - 9976 levels are likely to act
as resistance. On the downside if the index sustains below
yesterday’s low of 9814 then it is likely to drift further
towards 9770 - 9718 levels.
Actionable points:
View
Neutral
Resistance Levels
9914 - 9976
Support Levels
9814 - 9770 - 9718
Source: Falcon:
2
Daily Technical Report
September 06, 2012
Research Team Tel: 022 - 39357800
DISCLAIMER
This document is solely for the personal information of the recipient, and must not be singularly used as the basis of any investment
decision. Nothing in this document should be construed as investment or financial advice. Each recipient of this document should make
such investigations as they deem necessary to arrive at an independent evaluation of an investment in the securities of the companies
referred to in this document (including the merits and risks involved), and should consult their own advisors to determine the merits and
risks of such an investment.
Angel Broking Limited, its affiliates, directors, its proprietary trading and investment businesses may, from time to time, make
investment decisions that are inconsistent with or contradictory to the recommendations expressed herein. The views contained in this
document are those of the analyst, and the company may or may not subscribe to all the views expressed within.
Reports based on technical and derivative analysis center on studying charts of a stock's price movement, outstanding positions and
trading volume, as opposed to focusing on a company's fundamentals and, as such, may not match with a report on a company's
fundamentals.
The information in this document has been printed on the basis of publicly available information, internal data and other reliable
sources believed to be true, but we do not represent that it is accurate or complete and it should not be relied on as such, as this
document is for general guidance only. Angel Broking Limited or any of its affiliates/ group companies shall not be in any way
responsible for any loss or damage that may arise to any person from any inadvertent error in the information contained in this report.
Angel Broking Limited has not independently verified all the information contained within this document. Accordingly, we cannot testify,
nor make any representation or warranty, express or implied, to the accuracy, contents or data contained within this document. While
Angel Broking Limited endeavours to update on a reasonable basis the information discussed in this material, there may be regulatory,
compliance, or other reasons that prevent us from doing so.
This document is being supplied to you solely for your information, and its contents, information or data may not be reproduced,
redistributed or passed on, directly or indirectly.
Angel Broking Limited and its affiliates may seek to provide or have engaged in providing corporate finance, investment banking or
other advisory services in a merger or specific transaction to the companies referred to in this report, as on the date of this report or in
the past.
Neither Angel Broking Limited, nor its directors, employees or affiliates shall be liable for any loss or damage that may arise from or in
connection with the use of this information.
Note: Please refer to the important `Stock Holding Disclosure' report on the Angel website (Research Section). Also, please refer to the
latest update on respective stocks for the disclosure status in respect of those stocks. Angel Broking Limited and its affiliates may have
investment positions in the stocks recommended in this report.
Research Team
Shardul Kulkarni
-
Head - Technicals
Sameet Chavan
-
Technical Analyst
Sacchitanand Uttekar
-
Technical Analyst
Mehul Kothari
-
Technical Analyst
Ankur Lakhotia
-
Technical Analyst
Angel Broking Pvt. Ltd.
Registered Office: G-1, Ackruti Trade Centre, Rd. No. 7, MIDC, Andheri (E), Mumbai - 400 093.
Corporate Office: 6th Floor, Ackruti Star, MIDC, Andheri (E), Mumbai - 400 093. Tel: (022) 3952 6600
Sebi Registration No: INB 010996539
4