Daily Technical Report
June 06, 2013
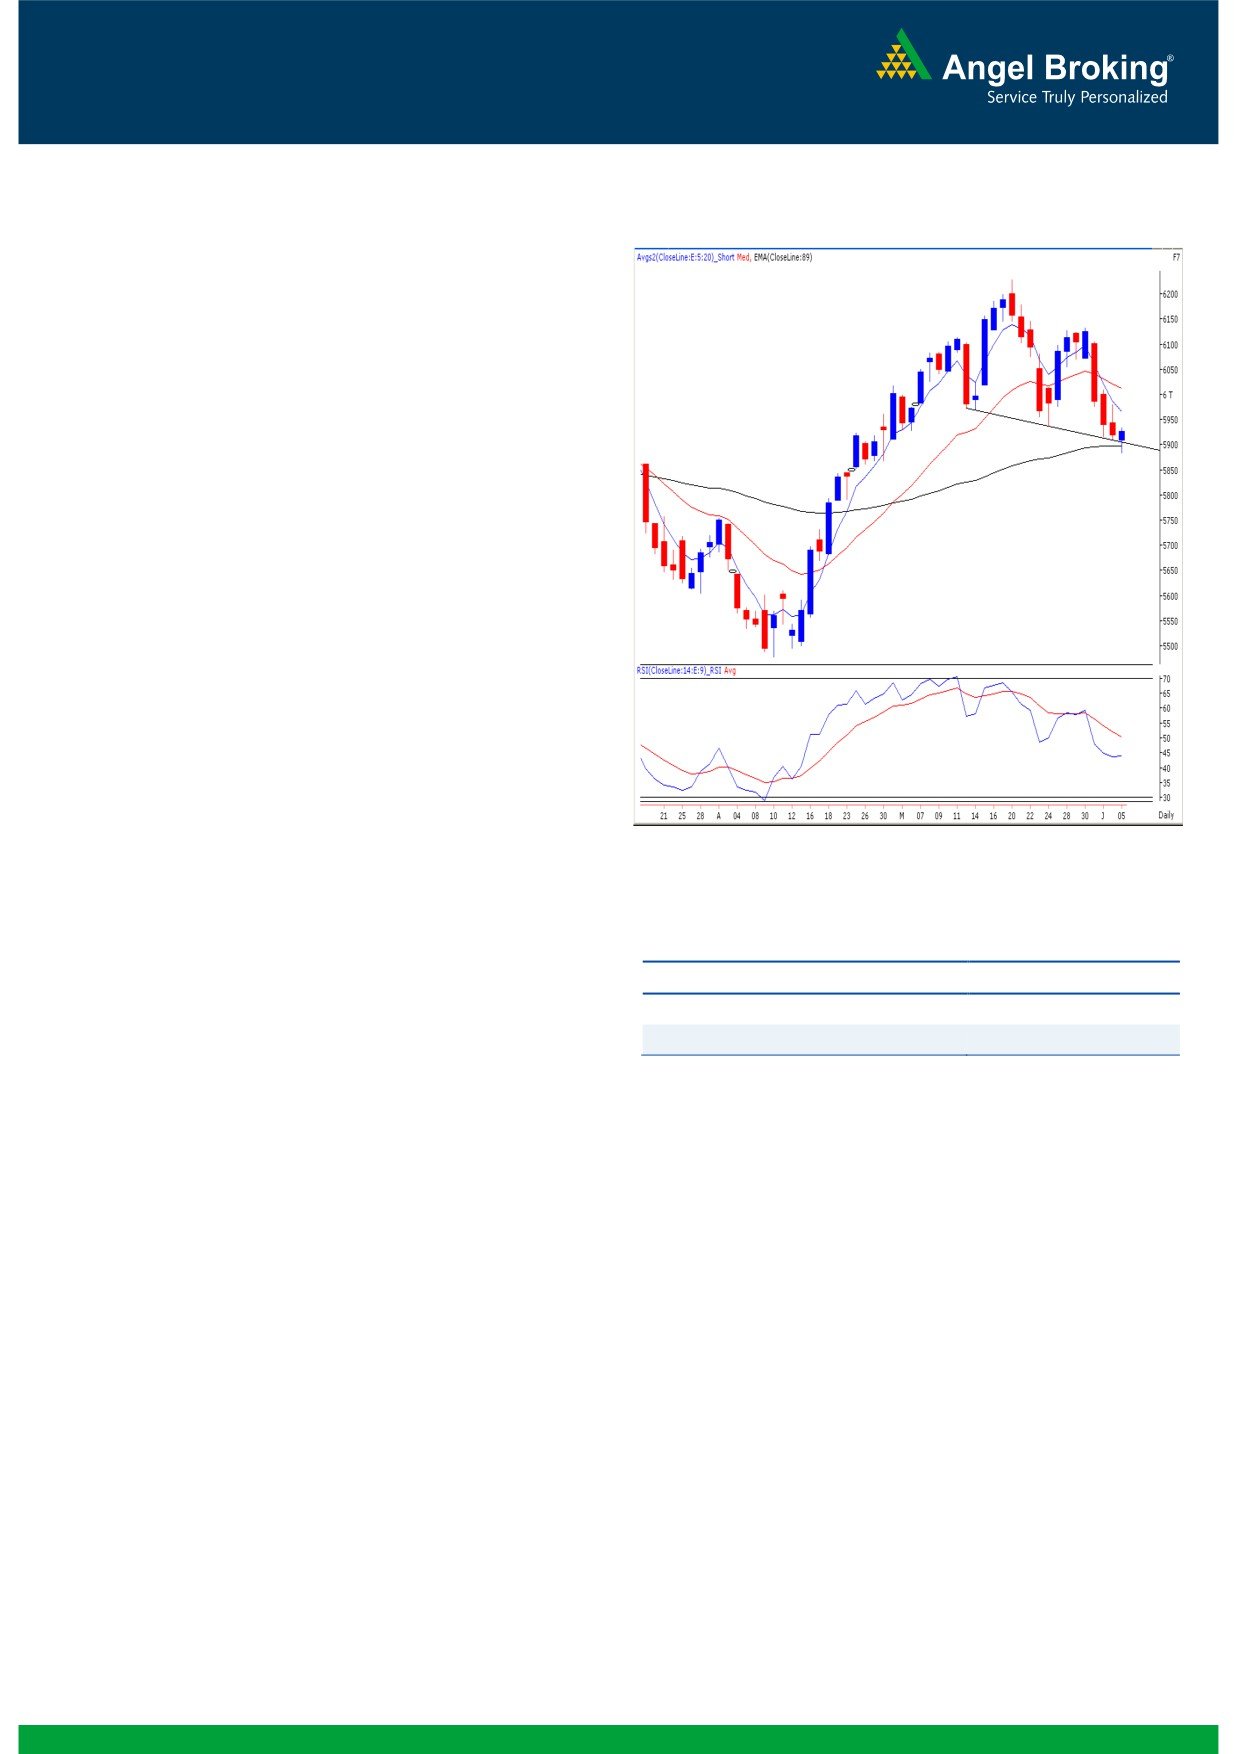
Exhibit 1: Nifty Daily Chart
Sensex (19568) / NIFTY (5924)
Yesterday, once again we witnessed a flat opening but
subsequently the Nifty slipped slightly below the
psychological level of 5900 during the initial hour of the
trade. However, post mid-session indices recovered from the
lows and traded with narrow trading range for rest of the
session. During the session, the Oil & Gas and the Realty
counters defended our benchmark indices; whereas the IT
and the FMCG sectors remained under pressure throughout
the session. The advance to decline ratio was marginally in
favor of declining counters. (A=1083 D=1256)(Source-
Formation
The ’20-week EMA’ and the ’20-day EMA’ are placed at
19410/ 5874 and 19900/ 6041 levels, respectively.
The ’89-day EMA’ and the ‘200-day SMA’ are placed at
19443/ 5895 and 19048 / 5776, respectively.
Source: Falcon:
The weekly ‘RSI’ and ‘Stochastic’ momentum oscillators
are negatively poised.
Actionable points:
The ‘Bearish Engulfing’ Japanese candlestick pattern on
weekly chart is still intact.
View
Bearish Below 5880
The monthly chart now depicts a ‘Shooting Star’
Expected Targets
5850 - 5820
Japanese candlestick pattern.
Resistance level
5935 - 5982
Trading strategy:
In our previous report, we had mentioned a strong support
zone of ‘Downward Sloping Trend Line’ and daily ’89 EMA’
placed at 19443 / 5895. Yesterday, during the initial hour of
the session, Nifty sneaked marginally below
5895 but
immediately bounced back to eventually close half a percent
higher from the day’s low (Sensex bounced from 19451).
Considering yesterday’s price action, we are of the opinion
that any sustainable move beyond yesterday’s high of 19605
/ 5935 may push indices further higher to test 19695 -
19743 / 5965 - 5982 levels. On the downside, we reiterate
our view that a closing below 19443 / 5895 would trigger
strong pessimism in the market. In that case, indices may
slide towards 19360 / 5850 level.
1
Daily Technical Report
June 06, 2013
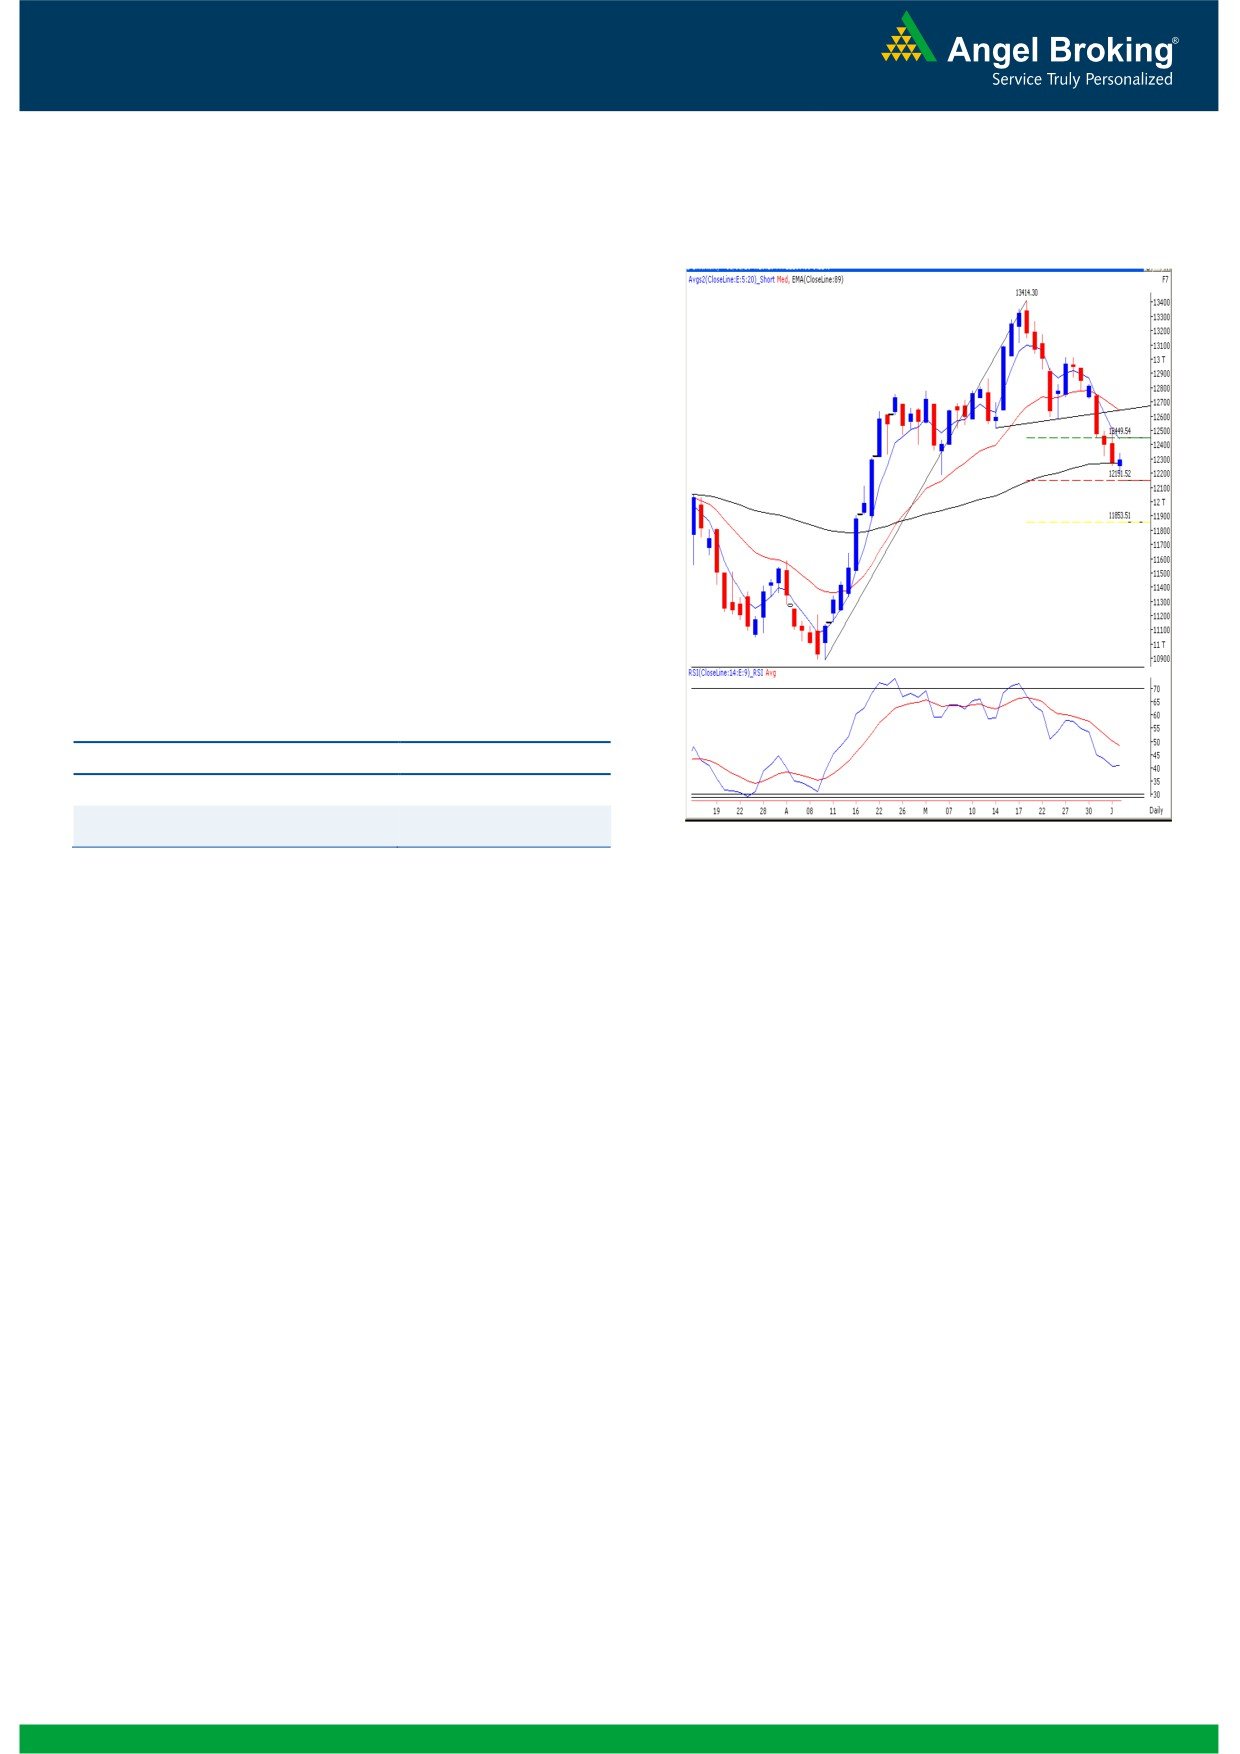
Exhibit 2: Bank Nifty Daily Chart
Bank Nifty Outlook - (12289)
In-line with our benchmark indices, the Bank Nifty too
opened quietly and immediately fell marginally below the
daily ’89 EMA’ support level of 12270. As expected, this
technical indicator provided a decent support for the index
and eventually the index bounced back to close marginally
above the ’89 EMA’. Considering the current daily candle,
and the placement of the momentum oscillators, we can
infer that if the Bank Nifty sustains above yesterday’s high
of 12347, then we may witness an intraday rally towards
12435 - 12521 levels. On the flipside, we continue to
maintain our stance that only a closing below 12188 may
reinforce the negative momentum.
Actionable points:
View
Bearish Below 12188
Expected Targets
12000- 11750
Resistance Level
12347 - 12435
Source: Falcon:
2
Daily Technical Report
June 06, 2013
Research Team Tel: 022 - 30940000
DISCLAIMER
This document is solely for the personal information of the recipient, and must not be singularly used as the basis of any investment
decision. Nothing in this document should be construed as investment or financial advice. Each recipient of this document should make
such investigations as they deem necessary to arrive at an independent evaluation of an investment in the securities of the companies
referred to in this document (including the merits and risks involved), and should consult their own advisors to determine the merits and
risks of such an investment.
Angel Broking Limited, its affiliates, directors, its proprietary trading and investment businesses may, from time to time, make
investment decisions that are inconsistent with or contradictory to the recommendations expressed herein. The views contained in this
document are those of the analyst, and the company may or may not subscribe to all the views expressed within.
Reports based on technical and derivative analysis center on studying charts of a stock's price movement, outstanding positions and
trading volume, as opposed to focusing on a company's fundamentals and, as such, may not match with a report on a company's
fundamentals.
The information in this document has been printed on the basis of publicly available information, internal data and other reliable
sources believed to be true, but we do not represent that it is accurate or complete and it should not be relied on as such, as this
document is for general guidance only. Angel Broking Limited or any of its affiliates/ group companies shall not be in any way
responsible for any loss or damage that may arise to any person from any inadvertent error in the information contained in this report.
Angel Broking Limited has not independently verified all the information contained within this document. Accordingly, we cannot testify,
nor make any representation or warranty, express or implied, to the accuracy, contents or data contained within this document. While
Angel Broking Limited endeavors to update on a reasonable basis the information discussed in this material, there may be regulatory,
compliance, or other reasons that prevent us from doing so.
This document is being supplied to you solely for your information, and its contents, information or data may not be reproduced,
redistributed or passed on, directly or indirectly.
Angel Broking Limited and its affiliates may seek to provide or have engaged in providing corporate finance, investment banking or
other advisory services in a merger or specific transaction to the companies referred to in this report, as on the date of this report or in
the past.
Neither Angel Broking Limited, nor its directors, employees or affiliates shall be liable for any loss or damage that may arise from or in
connection with the use of this information.
Note: Please refer to the important `Stock Holding Disclosure' report on the Angel website (Research Section). Also, please refer to the
latest update on respective stocks for the disclosure status in respect of those stocks. Angel Broking Limited and its affiliates may have
investment positions in the stocks recommended in this report.
Research Team
Shardul Kulkarni
-
Head - Technicals
Sameet Chavan
-
Technical Analyst
Sacchitanand Uttekar
-
Technical Analyst
Angel Broking Pvt. Ltd.
Registered Office: G-1, Ackruti Trade Centre, Rd. No. 7, MIDC, Andheri (E), Mumbai - 400 093.
Corporate Office: 6th Floor, Ackruti Star, MIDC, Andheri (E), Mumbai - 400 093. Tel: (022) 30940000
Sebi Registration No: INB 010996539
4