Daily Technical Report
March 06, 2013
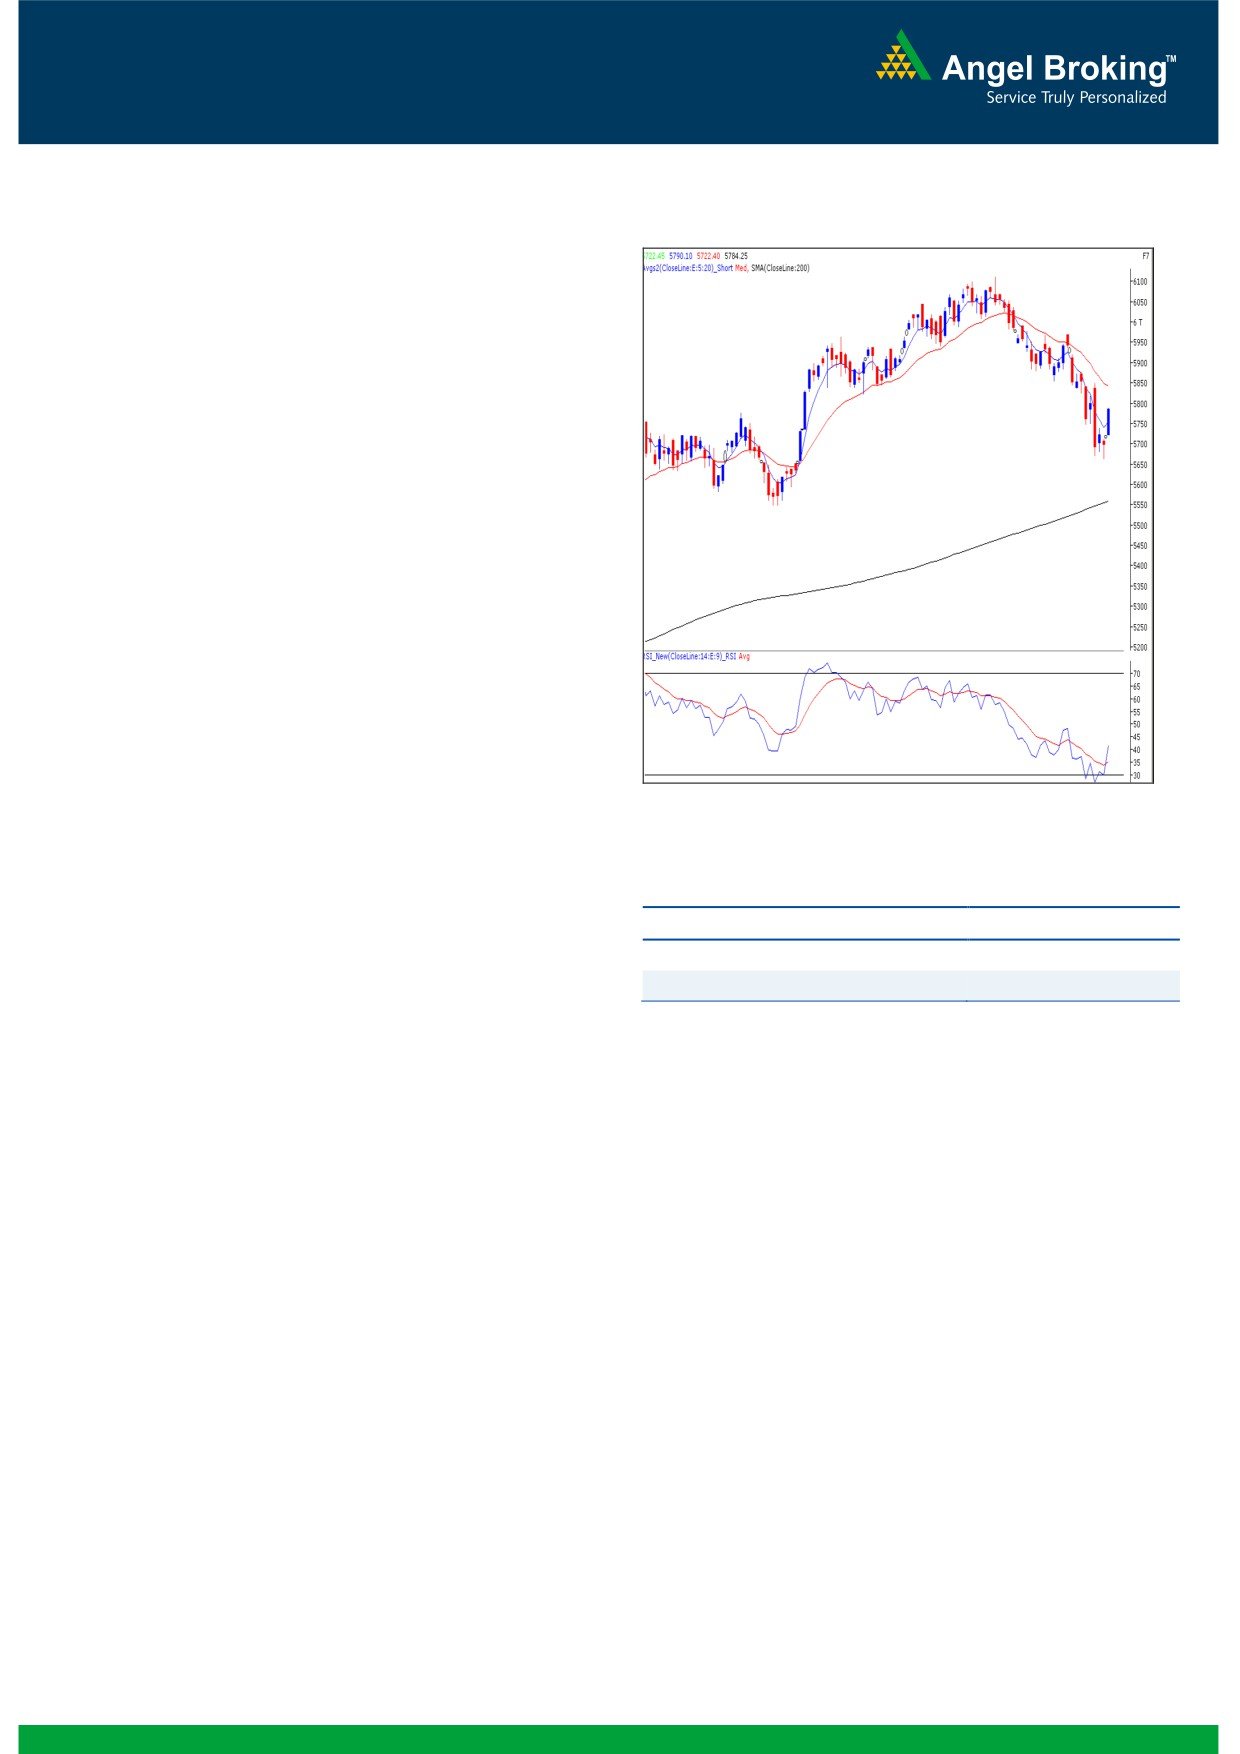
Exhibit 1: Nifty Daily Chart
Sensex (19143) / NIFTY (5784)
Yesterday, indices opened with a decent upside gap as
suggested by the SGX Nifty and continued to gain
momentum as the day progressed. We witnessed a decent
intraday rally of nearly one and half percent and the Nifty
closed marginally below 5800 mark. During the day, all the
sectors ended on a gaining side. The advance to decline
ratio was strongly in favor of advancing counters (A=1679
Formation
The ’20-day EMA’ and the ’20-week EMA’ are placed at
19372 / 5863 and 19175 / 5813 levels, respectively.
The monthly chart exhibits a ‘Bearish Engulfing’ pattern.
The monthly momentum oscillators are signaling a
negative crossover.
Source: Falcon:
The level of the weekly ‘RSI’ momentum oscillator has
now dropped below the 50 mark.
Actionable points:
Indices have closed marginally above the ‘Downward
Sloping Trend Line’, drawn by joining two significant
View
Neutral
highs of 21109 / 6339 (high of November 05, 2010
Support levels
5748 - 5720
weekly candle) and 19137 / 5816 (high of October 05,
Resistance levels
5820 - 5850
2012 weekly candle).
Trading strategy:
Yesterday indices opened higher above Monday's high of
18931 / 5712. As a result, existing short sellers or intraday
buyers rushed in to the market. We now have a confirmation
of the “Bullish Hammer” Japanese candlestick pattern
mentioned in yesterday’s report. Also, the daily 'RSI'
momentum oscillator is now signaling a positive crossover.
Nevertheless, indices are now approaching a strong
resistance zone of 19239 / 5820, which coincides with the
'89 EMA' in daily as well as hourly chart. Also, the market still
remains in a strong lower top lower bottom cycle. Hence,
only a sustainable move beyond 19239 / 5820 may attract
some more buying interest and we may witness an extended
move towards 19322 / 5850 levels. On the flipside, any
weakness around this resistance zone may reinforce the
selling pressure. Indices then may resume their existing down
trend to test 18989 - 18931 / 5740 - 5712 levels.
1
Daily Technical Report
March 06, 2013
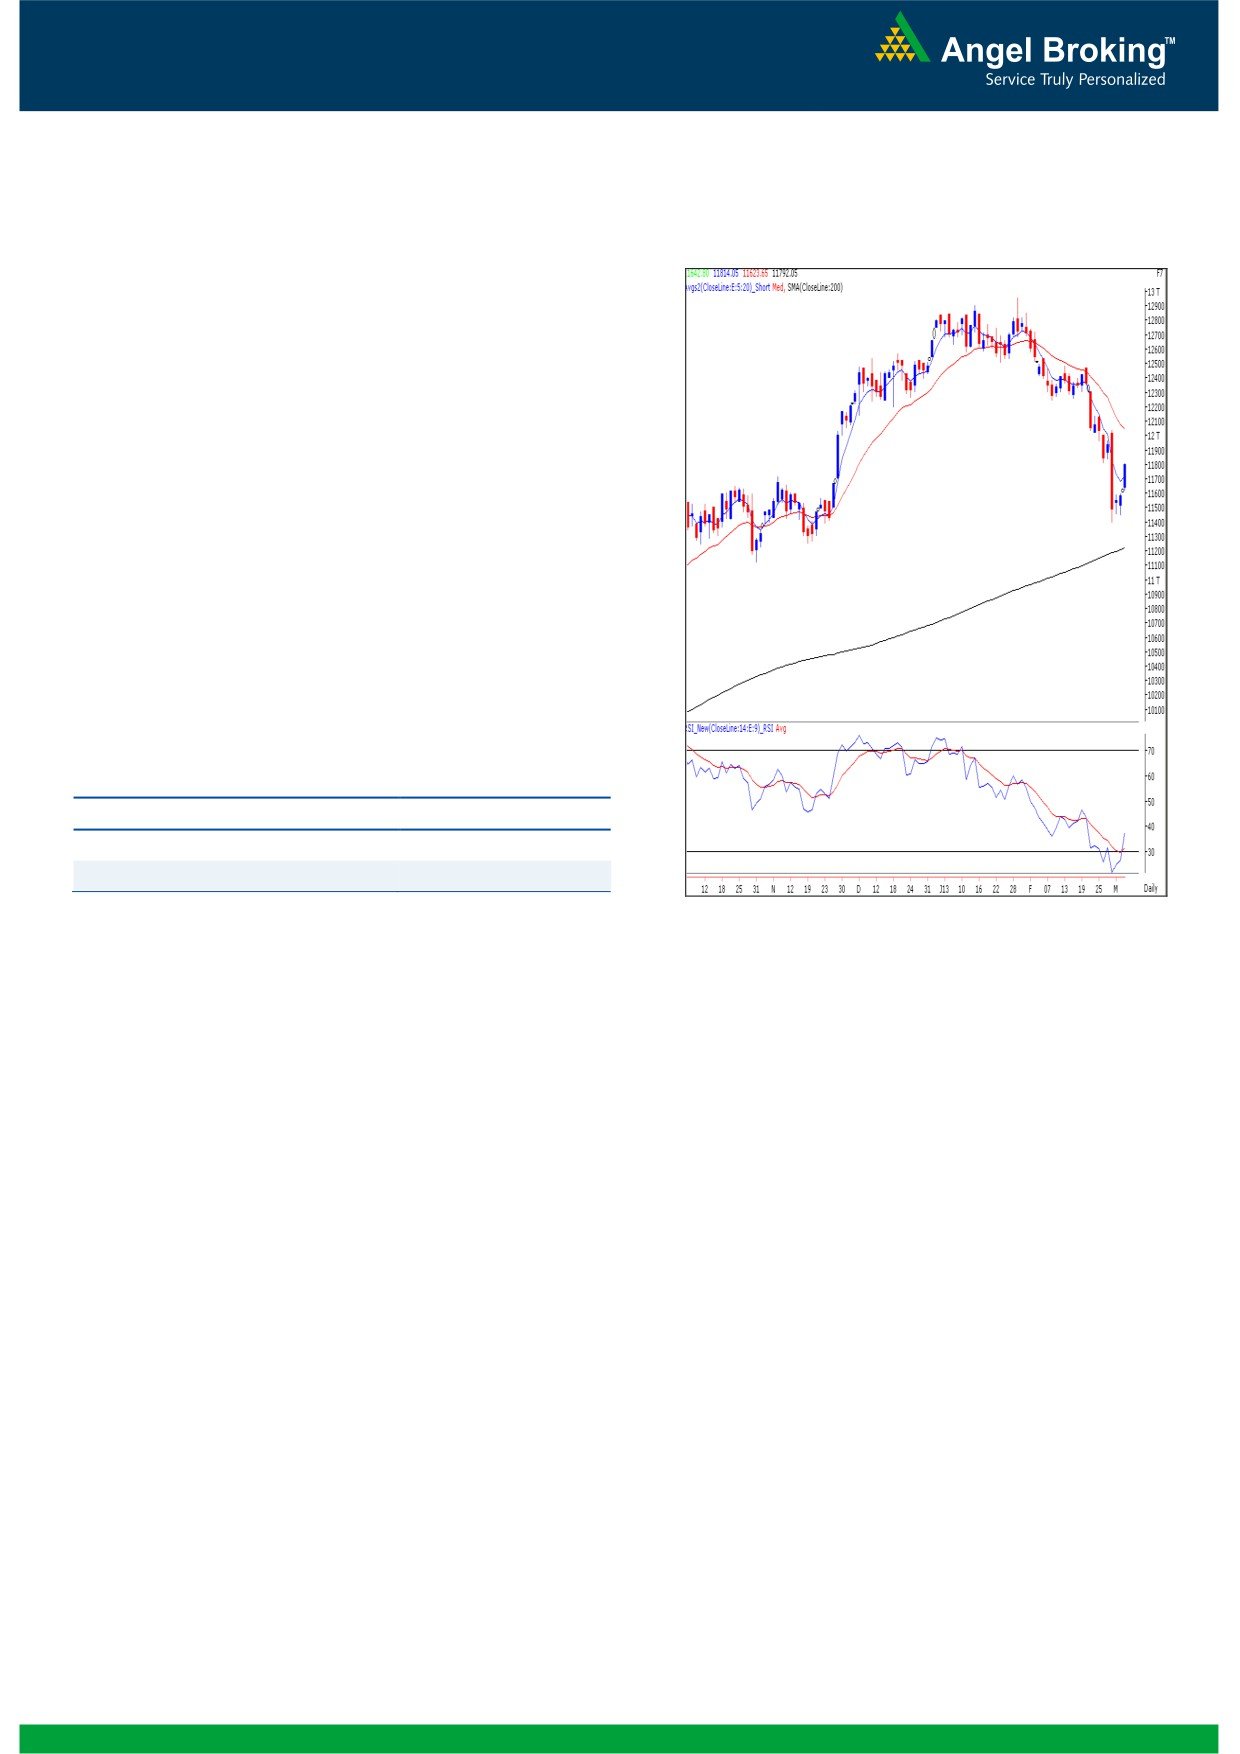
Exhibit 2: Bank Nifty Daily Chart
Bank Nifty Outlook - (11792)
Yesterday, Bank Nifty opened with an upside gap in line
with our benchmark indices and gained strength as the
day progressed to close well inside the positive territory.
We had been mentioning in our previous reports that the
momentum oscillators on the daily chart are placed in
oversold condition and hence creation of fresh short
positions should be avoided. At this juncture we are
witnessing positive crossover in ‘RSI’ momentum oscillator
on the daily chart. The effect of this technical tool would be
seen if the index sustains above the 11814 level. In this
scenario the index is likely to rally towards 11910 - 11940
levels. On the downside 11715 - 11624 levels are likely to
act as support for the day.
Actionable points:
View
Neutral
Resistance Levels
11814 - 11910
Support levels
11715 - 11624
Source: Falcon:
2
Daily Technical Report
March 06, 2013
Research Team Tel: 022 - 30940000
DISCLAIMER
This document is solely for the personal information of the recipient, and must not be singularly used as the basis of any investment
decision. Nothing in this document should be construed as investment or financial advice. Each recipient of this document should make
such investigations as they deem necessary to arrive at an independent evaluation of an investment in the securities of the companies
referred to in this document (including the merits and risks involved), and should consult their own advisors to determine the merits and
risks of such an investment.
Angel Broking Limited, its affiliates, directors, its proprietary trading and investment businesses may, from time to time, make
investment decisions that are inconsistent with or contradictory to the recommendations expressed herein. The views contained in this
document are those of the analyst, and the company may or may not subscribe to all the views expressed within.
Reports based on technical and derivative analysis center on studying charts of a stock's price movement, outstanding positions and
trading volume, as opposed to focusing on a company's fundamentals and, as such, may not match with a report on a company's
fundamentals.
The information in this document has been printed on the basis of publicly available information, internal data and other reliable
sources believed to be true, but we do not represent that it is accurate or complete and it should not be relied on as such, as this
document is for general guidance only. Angel Broking Limited or any of its affiliates/ group companies shall not be in any way
responsible for any loss or damage that may arise to any person from any inadvertent error in the information contained in this report.
Angel Broking Limited has not independently verified all the information contained within this document. Accordingly, we cannot testify,
nor make any representation or warranty, express or implied, to the accuracy, contents or data contained within this document. While
Angel Broking Limited endeavours to update on a reasonable basis the information discussed in this material, there may be regulatory,
compliance, or other reasons that prevent us from doing so.
This document is being supplied to you solely for your information, and its contents, information or data may not be reproduced,
redistributed or passed on, directly or indirectly.
Angel Broking Limited and its affiliates may seek to provide or have engaged in providing corporate finance, investment banking or
other advisory services in a merger or specific transaction to the companies referred to in this report, as on the date of this report or in
the past.
Neither Angel Broking Limited, nor its directors, employees or affiliates shall be liable for any loss or damage that may arise from or in
connection with the use of this information.
Note: Please refer to the important `Stock Holding Disclosure' report on the Angel website (Research Section). Also, please refer to the
latest update on respective stocks for the disclosure status in respect of those stocks. Angel Broking Limited and its affiliates may have
investment positions in the stocks recommended in this report.
Research Team
Shardul Kulkarni
-
Head - Technicals
Sameet Chavan
-
Technical Analyst
Sacchitanand Uttekar
-
Technical Analyst
Ankur Lakhotia
-
Technical Analyst
Angel Broking Pvt. Ltd.
Registered Office: G-1, Ackruti Trade Centre, Rd. No. 7, MIDC, Andheri (E), Mumbai - 400 093.
Corporate Office: 6th Floor, Ackruti Star, MIDC, Andheri (E), Mumbai - 400 093. Tel: (022) 30940000
Sebi Registration No: INB 010996539
4