Daily Technical Report
October 05, 2012
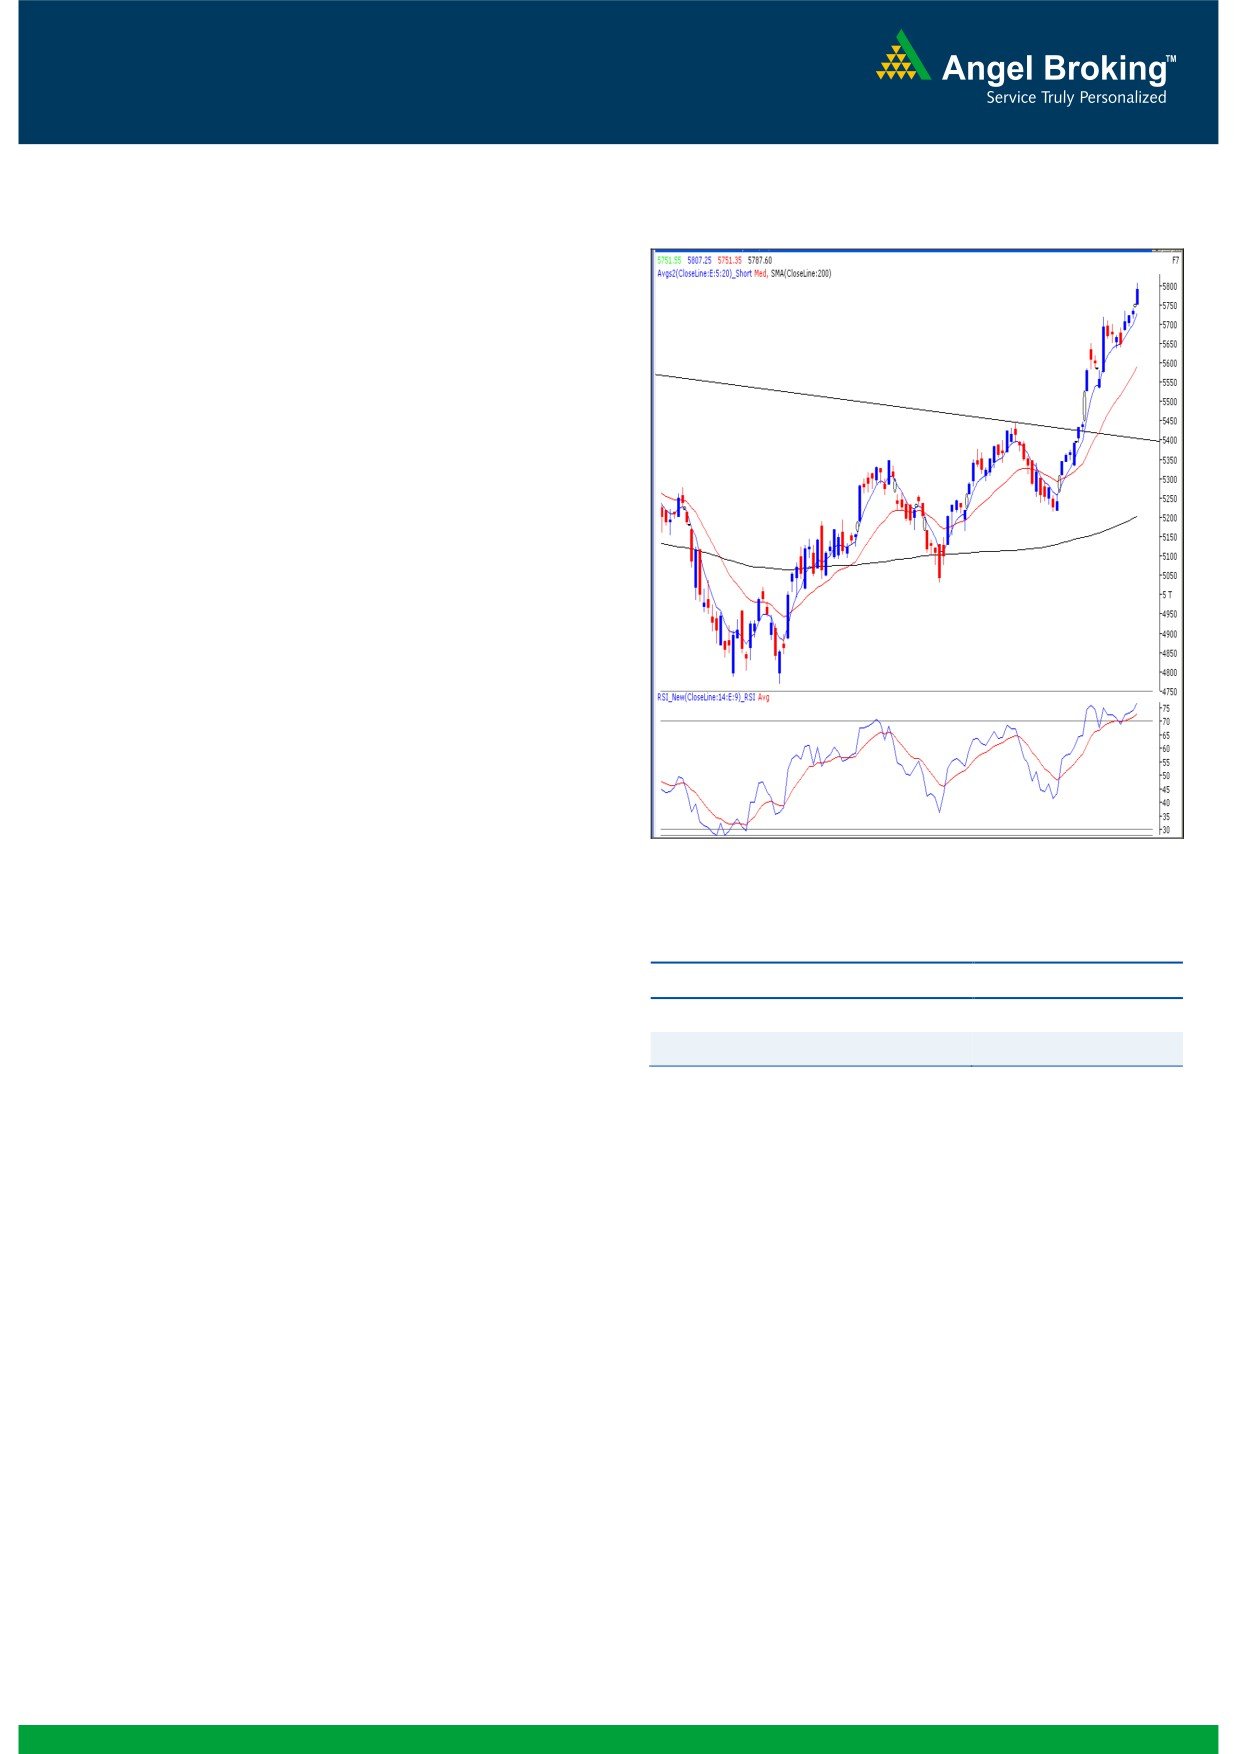
Exhibit 1: Nifty Daily Chart
Sensex (19058) / NIFTY (5788)
Yesterday’s session began on a cheerful note in-line with
positive cues from other Asian bourses. This positive
momentum stayed for the whole trading session, which led
to a convincing close well above the mentioned resistance
level of 5741. This up move was mainly led by huge intraday
rally in Realty sector along with Consumer Durables, Banking
and Capital Goods; whereas the Health Care, IT and Auto
counters remained under pressure throughout the day. The
advance to decline ratio was strongly in favor of advancing
Formation
The ’20-day EMA’ and the ’20-week EMA’ are placed at
18265 / 5535 and 17625 / 5340 levels, respectively.
The monthly ‘RSI’ oscillator is moving higher from the 50
mark and the ADX (9) indicator is now signaling a
positive crossover.
Source: Falcon:
Trading strategy:
Actionable points:
Finally, we have witnessed the much awaited closing above
the stiff resistance level of 5741. Moreover, Nifty managed
View
Bullish Above 5807
to cross the psychological level of 5800 during the session.
Expected Target
5850
As mentioned in our previous reports we now expect the
Support Levels
5741 - 5715
markets to move higher and test 19542 - 19812 / 5850 -
5945 levels. Conversely, 5741 - 5715 would act as decent
support for the market. We are witnessing fresh breakout in
index heavyweights such as ICICI Bank, Reliance, SBI and
HDFC Bank. Considering the charts of these constituents,
coupled with reforms passed by the government, we expect
the bulls to dominate in the next few sessions.
1
Daily Technical Report
October 05, 2012
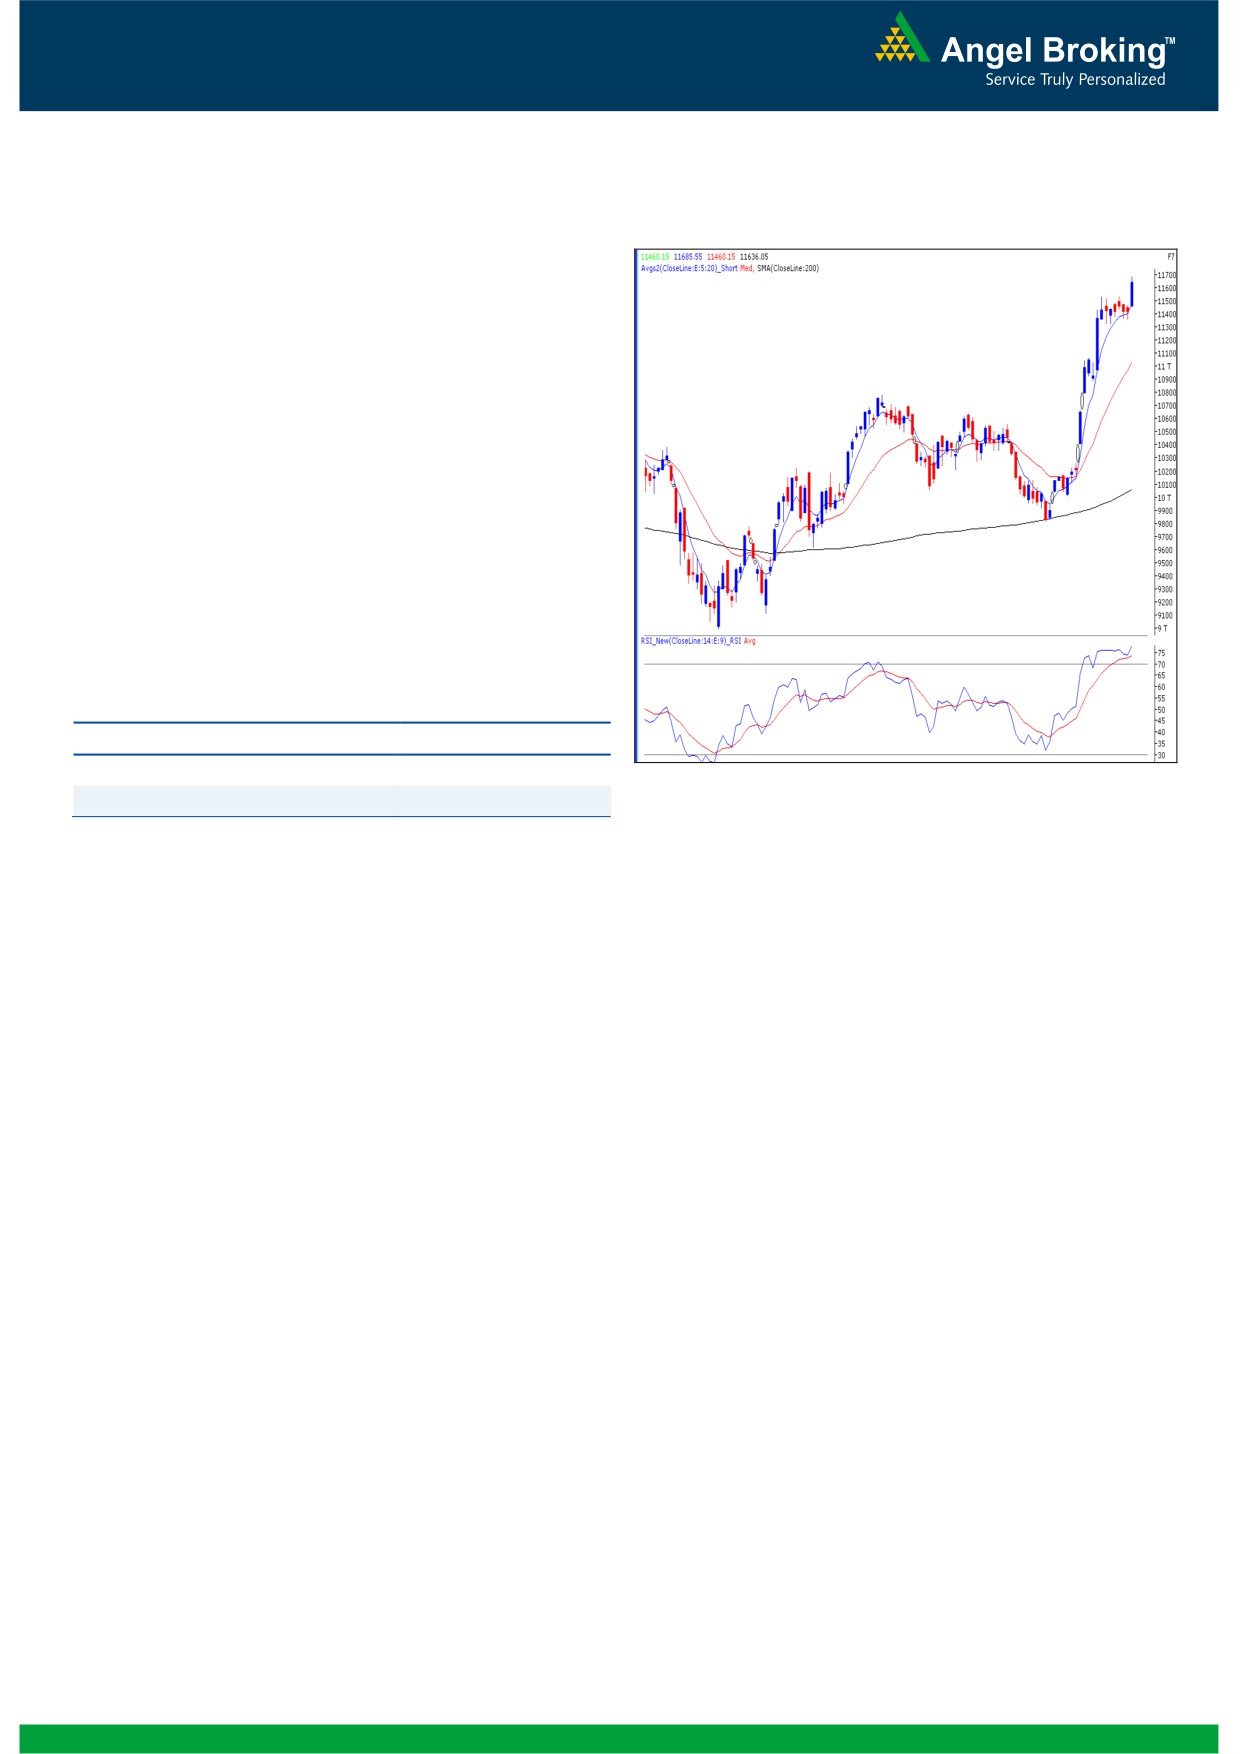
Exhibit 2: Bank Nifty Daily Chart
Bank Nifty Outlook - (11636)
Yesterday, Bank Nifty opened on a positive note and
surged higher during the initial hour of trade. However,
during the rest of the session the index consolidated in a
narrow range and closed with a gain of nearly 2%. After
consolidating in the range of 11320 - 11537 for five
consecutive sessions the index has finally given a breakout
on the upside. This breakout can be construed as a
“Bullish Flag” breakout and has potentional target near to
the 12000 mark. Traders are advised to use every decline
towards 11537 to buy in the banknifty. The stoploss for the
trade should be placed at 11320 levels.
Actionable points:
View
Bullish
Expected Target
12100
Source: Falcon:
Support Levels
11360 - 11320
2
Daily Technical Report
October 05, 2012
Research Team Tel: 022 - 39357800
DISCLAIMER
This document is solely for the personal information of the recipient, and must not be singularly used as the basis of any investment
decision. Nothing in this document should be construed as investment or financial advice. Each recipient of this document should make
such investigations as they deem necessary to arrive at an independent evaluation of an investment in the securities of the companies
referred to in this document (including the merits and risks involved), and should consult their own advisors to determine the merits and
risks of such an investment.
Angel Broking Limited, its affiliates, directors, its proprietary trading and investment businesses may, from time to time, make
investment decisions that are inconsistent with or contradictory to the recommendations expressed herein. The views contained in this
document are those of the analyst, and the company may or may not subscribe to all the views expressed within.
Reports based on technical and derivative analysis center on studying charts of a stock's price movement, outstanding positions and
trading volume, as opposed to focusing on a company's fundamentals and, as such, may not match with a report on a company's
fundamentals.
The information in this document has been printed on the basis of publicly available information, internal data and other reliable
sources believed to be true, but we do not represent that it is accurate or complete and it should not be relied on as such, as this
document is for general guidance only. Angel Broking Limited or any of its affiliates/ group companies shall not be in any way
responsible for any loss or damage that may arise to any person from any inadvertent error in the information contained in this report.
Angel Broking Limited has not independently verified all the information contained within this document. Accordingly, we cannot testify,
nor make any representation or warranty, express or implied, to the accuracy, contents or data contained within this document. While
Angel Broking Limited endeavours to update on a reasonable basis the information discussed in this material, there may be regulatory,
compliance, or other reasons that prevent us from doing so.
This document is being supplied to you solely for your information, and its contents, information or data may not be reproduced,
redistributed or passed on, directly or indirectly.
Angel Broking Limited and its affiliates may seek to provide or have engaged in providing corporate finance, investment banking or
other advisory services in a merger or specific transaction to the companies referred to in this report, as on the date of this report or in
the past.
Neither Angel Broking Limited, nor its directors, employees or affiliates shall be liable for any loss or damage that may arise from or in
connection with the use of this information.
Note: Please refer to the important `Stock Holding Disclosure' report on the Angel website (Research Section). Also, please refer to the
latest update on respective stocks for the disclosure status in respect of those stocks. Angel Broking Limited and its affiliates may have
investment positions in the stocks recommended in this report.
Research Team
Shardul Kulkarni
-
Head - Technicals
Sameet Chavan
-
Technical Analyst
Sacchitanand Uttekar
-
Technical Analyst
Mehul Kothari
-
Technical Analyst
Ankur Lakhotia
-
Technical Analyst
Angel Broking Pvt. Ltd.
Registered Office: G-1, Ackruti Trade Centre, Rd. No. 7, MIDC, Andheri (E), Mumbai - 400 093.
Corporate Office: 6th Floor, Ackruti Star, MIDC, Andheri (E), Mumbai - 400 093. Tel: (022) 3952 6600
Sebi Registration No: INB 010996539
4