Daily Technical Report
April 05, 2013
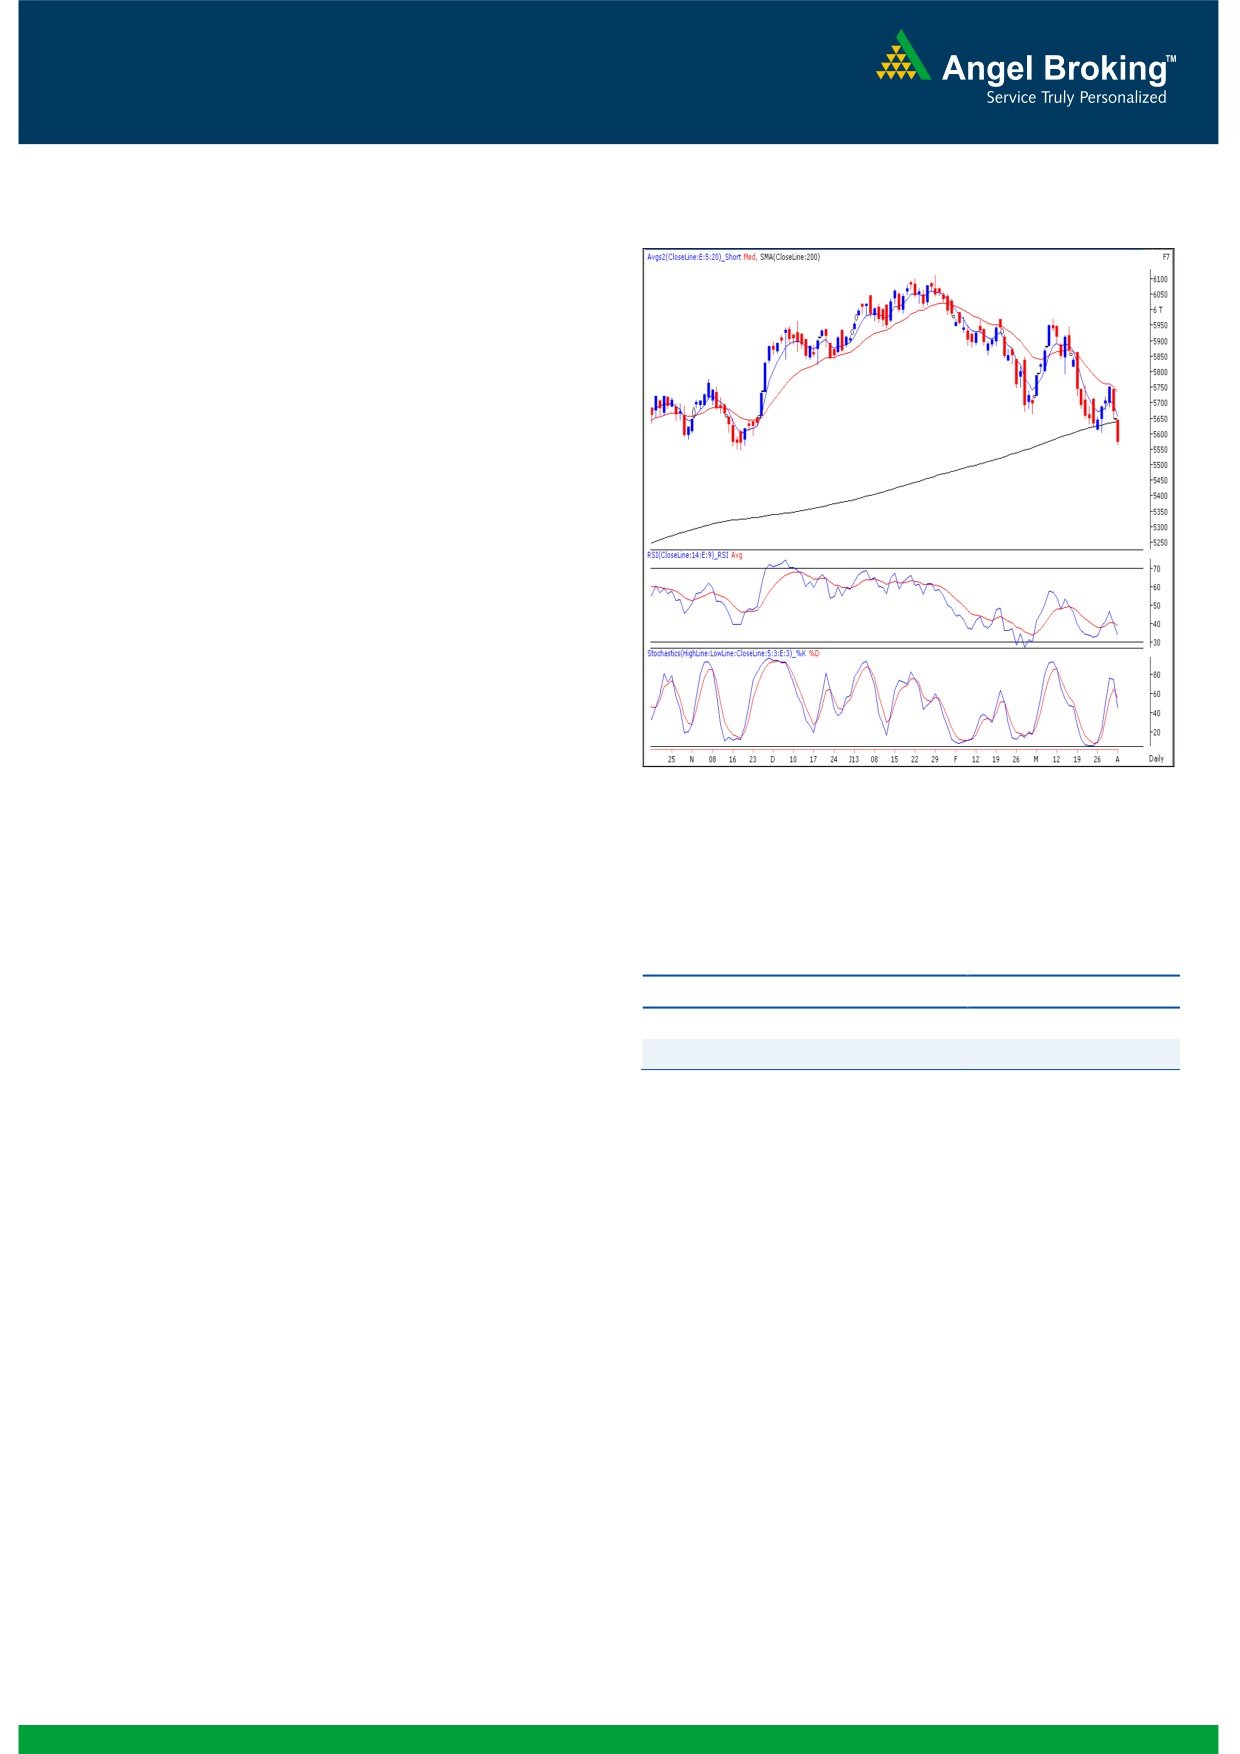
Exhibit 1: Nifty Daily Chart
Sensex (18510) / NIFTY (5575)
Yesterday, indices opened with half a percent downside gap
as indicated by the SGX Nifty. Indices slipped lower during
the initial hour of the trade and oscillated within a narrow
trading range. However, post midsession, selling pressure
intensified and markets ended the session with nearly a 2%
loss. All the sectors ended on a losing side among which
Realty, IT and Teck counters were among the major losers.
The advance to decline ratio was strongly in favor of
declining
counters
(A=907 D=1850) (Source-
Formation
The ’20-day EMA’ and the ’20-week EMA’ are placed at
18992 / 5734 and 19098 / 5779 levels, respectively.
The ‘200 Day SMA’ is placed at 18556 / 5627.
Source: Falcon:
The momentum oscillators viz, ‘RSI’ and ‘Stochastic’ are
now signaling a negative crossover.
Actionable points:
Trading strategy:
Wednesday’s weak closing was followed by a gap down
View
Neutral
opening in our benchmark indices. During the first half the
Resistance levels
5644
bulls made a valiant effort to move upwards but failed to do
Support levels
5548 - 5500
so as indices plunged sharply from the day’s high
immediately post midsession. Selling pressure remained
unabated as indices could not hold on to their strong support
levels of 18525 / 5600 and eventually closed well below it.
Going forward, indices may slide towards the immediate
support level of 18255 / 5548. Any move below this level
may trigger extreme pessimism in the market. In this
scenario, indices may slide further to test 18200 / 5500
level. On the flipside, yesterday’s high of 18734 / 5645
would act as a strong resistance in coming trading session.
1
Daily Technical Report
April 05, 2013
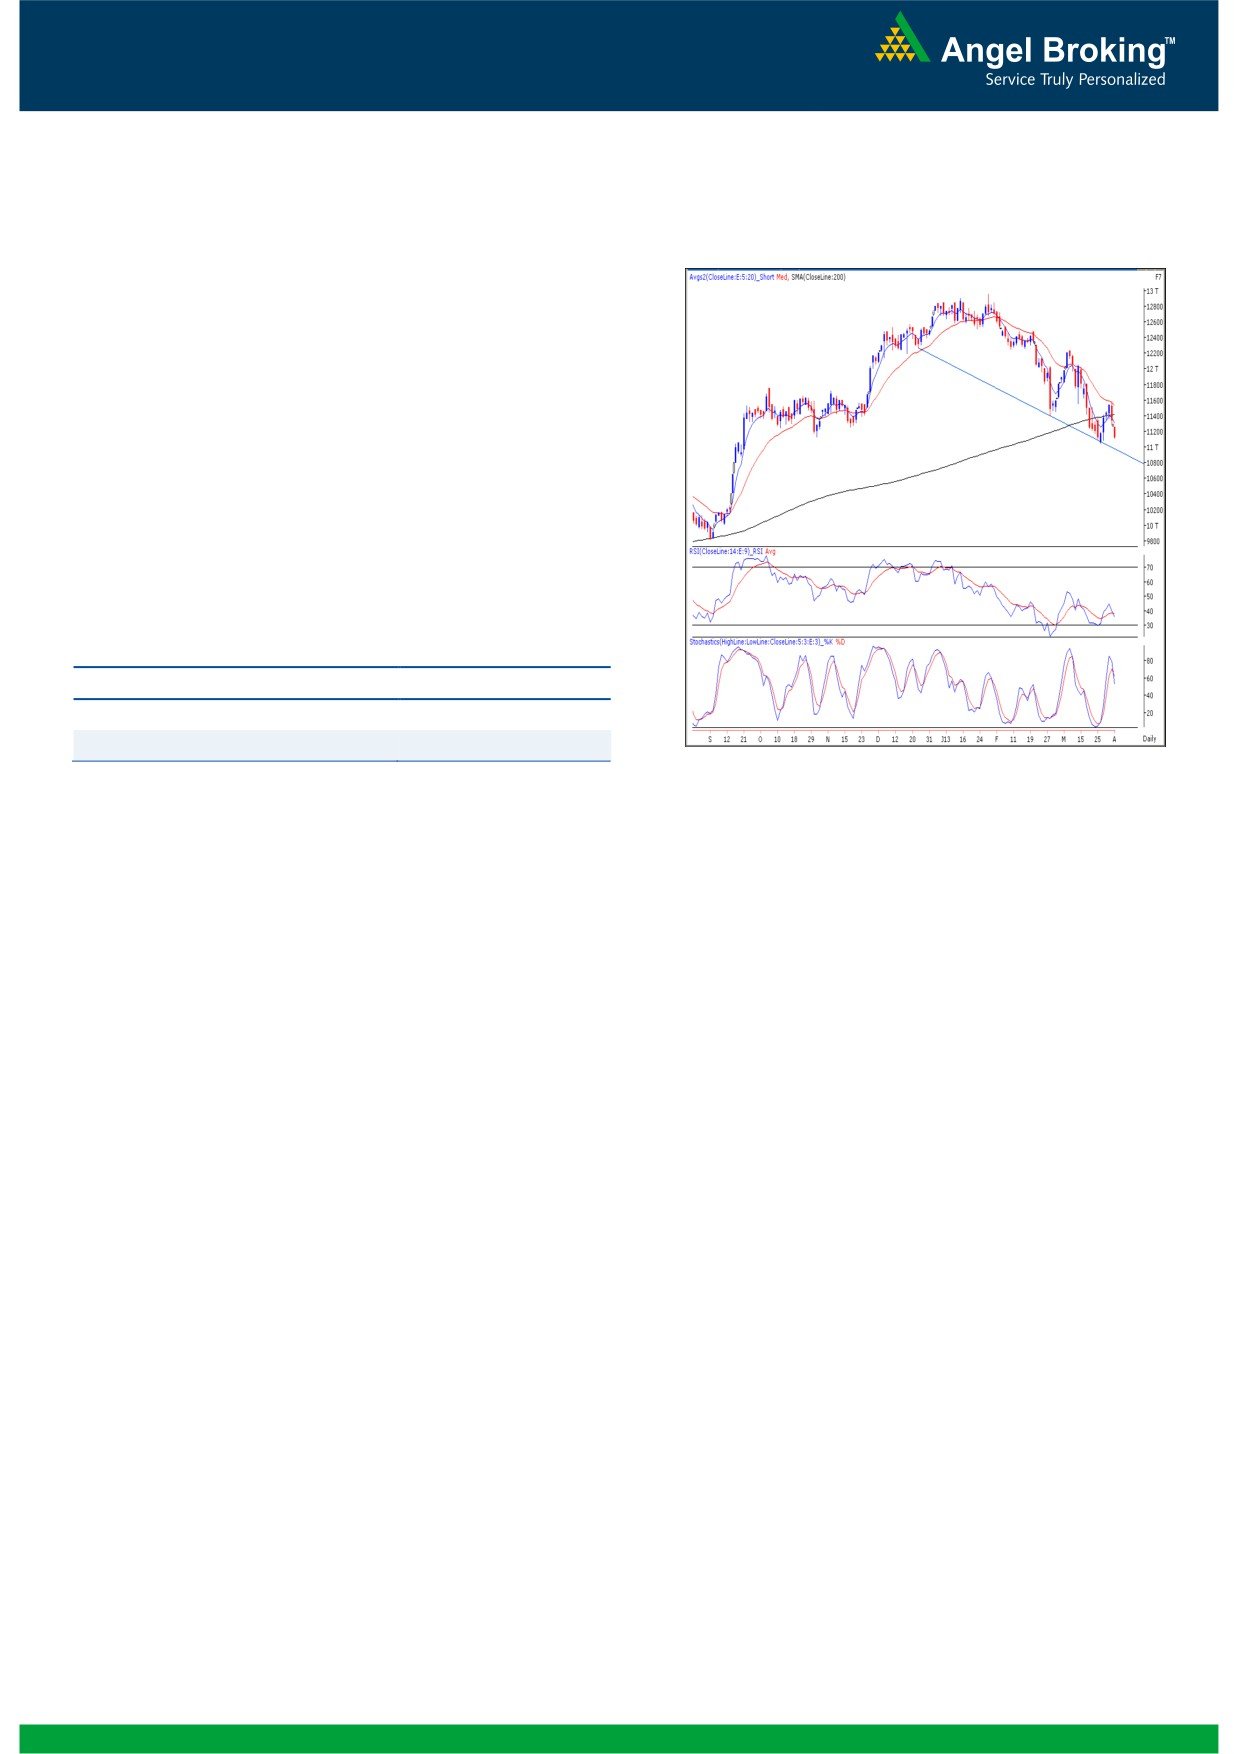
Exhibit 2: Bank Nifty Daily Chart
Bank Nifty Outlook - (11126)
Yesterday, Bank Nifty opened with a downside gap in line
with our benchmark indices and selling pressure
throughout the day led the index to close well inside the
negative territory. The momentum oscillators on the daily
chart have turned negative. Indices are now approaching
the recent swing low of 11048. A breach of this support
will intensify selling pressure in the index. In this scenario
the index is further likely to drift lower towards 10970 -
10887 levels. On the upside 11300 - 11330 levels are
likely to act as resistance for the day.
Actionable points:
View
Neutral
Resistance Levels
11300 - 11330
Support Levels
11048 - 10970
Source: Falcon:
2
Daily Technical Report
April 05, 2013
Research Team Tel: 022 - 30940000
DISCLAIMER
This document is solely for the personal information of the recipient, and must not be singularly used as the basis of any investment
decision. Nothing in this document should be construed as investment or financial advice. Each recipient of this document should make
such investigations as they deem necessary to arrive at an independent evaluation of an investment in the securities of the companies
referred to in this document (including the merits and risks involved), and should consult their own advisors to determine the merits and
risks of such an investment.
Angel Broking Limited, its affiliates, directors, its proprietary trading and investment businesses may, from time to time, make
investment decisions that are inconsistent with or contradictory to the recommendations expressed herein. The views contained in this
document are those of the analyst, and the company may or may not subscribe to all the views expressed within.
Reports based on technical and derivative analysis center on studying charts of a stock's price movement, outstanding positions and
trading volume, as opposed to focusing on a company's fundamentals and, as such, may not match with a report on a company's
fundamentals.
The information in this document has been printed on the basis of publicly available information, internal data and other reliable
sources believed to be true, but we do not represent that it is accurate or complete and it should not be relied on as such, as this
document is for general guidance only. Angel Broking Limited or any of its affiliates/ group companies shall not be in any way
responsible for any loss or damage that may arise to any person from any inadvertent error in the information contained in this report.
Angel Broking Limited has not independently verified all the information contained within this document. Accordingly, we cannot testify,
nor make any representation or warranty, express or implied, to the accuracy, contents or data contained within this document. While
Angel Broking Limited endeavors to update on a reasonable basis the information discussed in this material, there may be regulatory,
compliance, or other reasons that prevent us from doing so.
This document is being supplied to you solely for your information, and its contents, information or data may not be reproduced,
redistributed or passed on, directly or indirectly.
Angel Broking Limited and its affiliates may seek to provide or have engaged in providing corporate finance, investment banking or
other advisory services in a merger or specific transaction to the companies referred to in this report, as on the date of this report or in
the past.
Neither Angel Broking Limited, nor its directors, employees or affiliates shall be liable for any loss or damage that may arise from or in
connection with the use of this information.
Note: Please refer to the important `Stock Holding Disclosure' report on the Angel website (Research Section). Also, please refer to the
latest update on respective stocks for the disclosure status in respect of those stocks. Angel Broking Limited and its affiliates may have
investment positions in the stocks recommended in this report.
Research Team
Shardul Kulkarni
-
Head - Technicals
Sameet Chavan
-
Technical Analyst
Sacchitanand Uttekar
-
Technical Analyst
Ankur Lakhotia
-
Technical Analyst
Angel Broking Pvt. Ltd.
Registered Office: G-1, Ackruti Trade Centre, Rd. No. 7, MIDC, Andheri (E), Mumbai - 400 093.
Corporate Office: 6th Floor, Ackruti Star, MIDC, Andheri (E), Mumbai - 400 093. Tel: (022) 30940000
Sebi Registration No: INB 010996539
4