Daily Technical Report
December 04, 2012
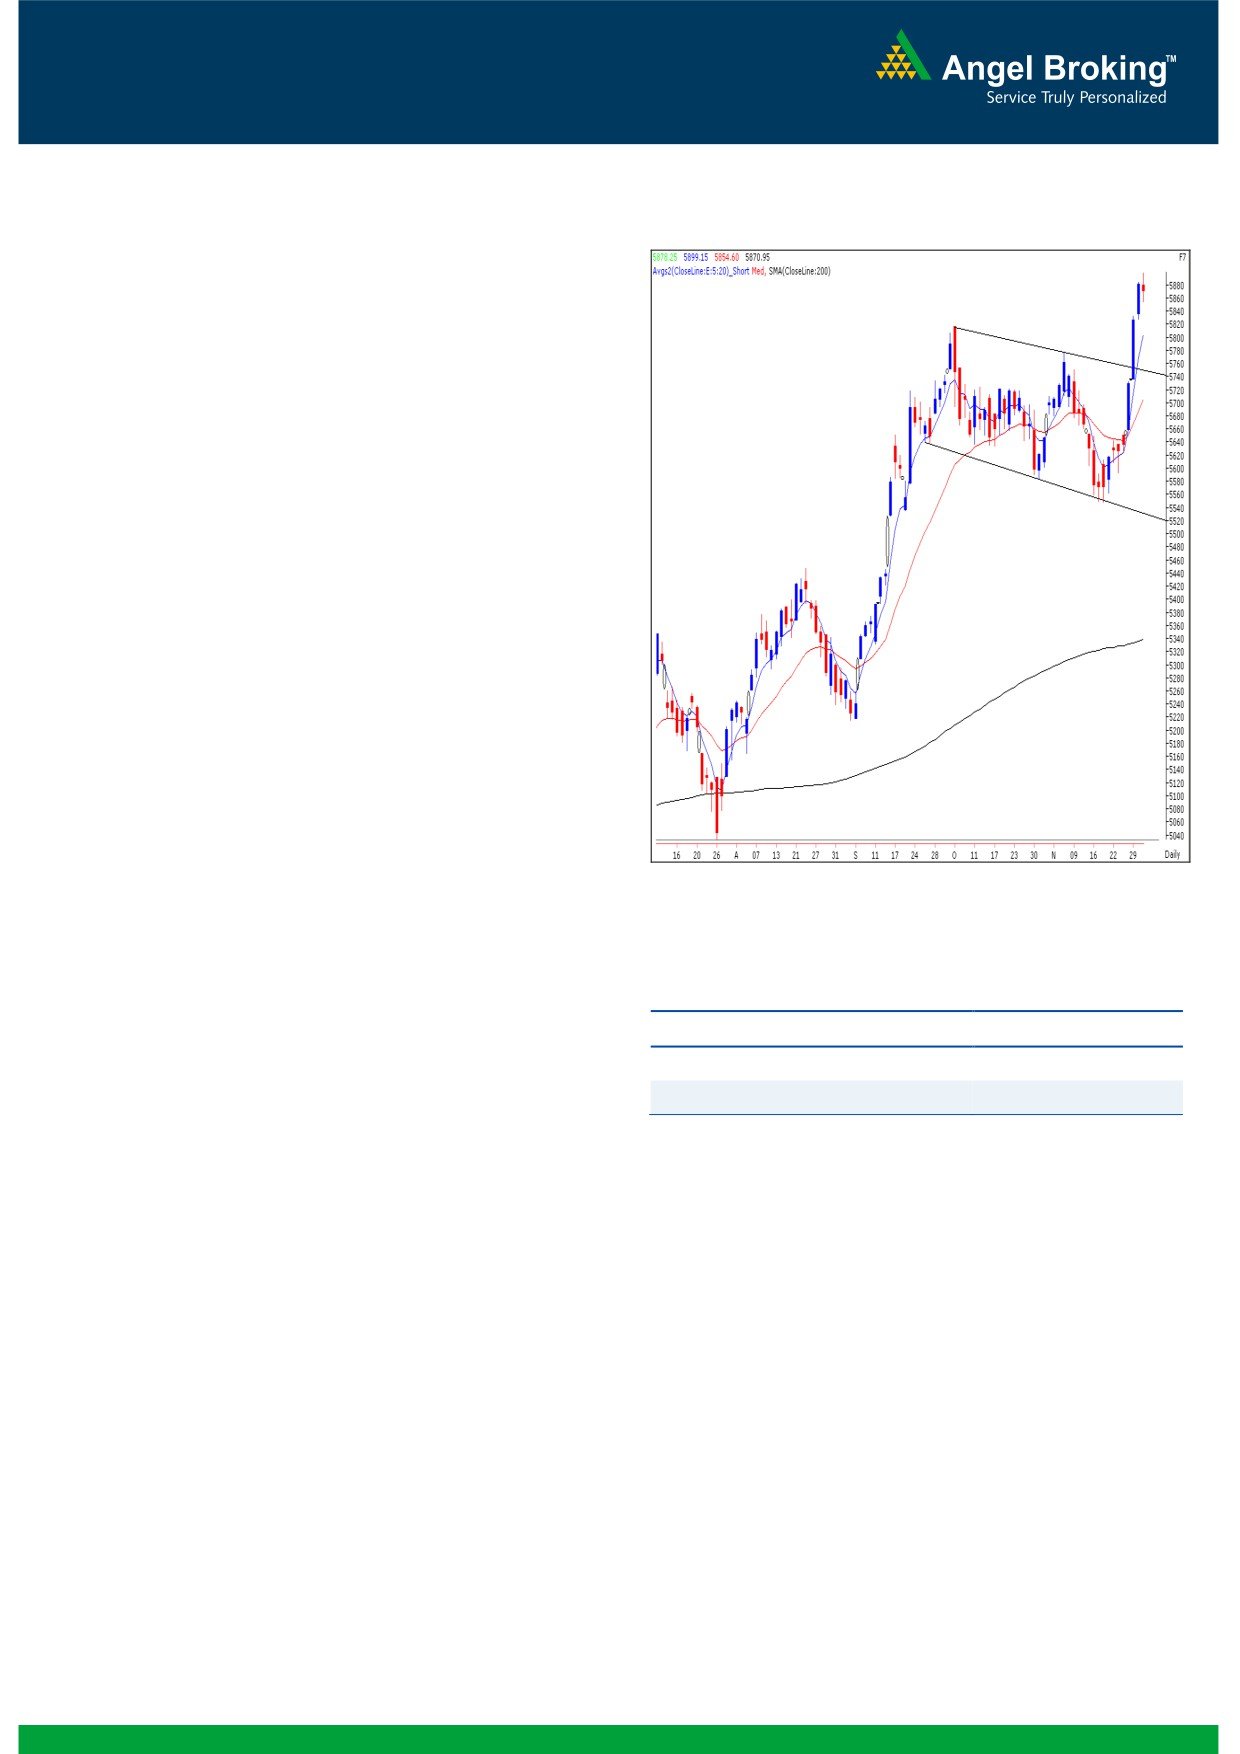
Exhibit 1: Nifty Daily Chart
Sensex (19305) / NIFTY (5871)
Yesterday, the week began on a quite note post the strong
rally in the previous few sessions. Markets opening flat and
traded in a narrow range throughtout the day. During
yesterday’s session, the Realty, Metal and Power sectors
traded in the green whereas Banking, FMCG and Teck
counters remained slightly under pressure. The advance to
decline ratio was strongly in favor of advancing counters
Formation
The ’20-day EMA’ and the ’20-week EMA’ are placed at
18702 / 5687 and 18281/ 5552 levels, respectively.
On the weekly chart, we are witnessing a breakout from
‘Downward Sloping Trend Line’ joining two significant
swing high of 19811 / 5944 (April 2011) and 19137 /
5815 (Oct 2012) at 19050 / 5800 level.
The target of the daily ‘Channel’ pattern breakout comes
around 19500 / 5950 level.
The weekly ‘Stochastic’ and the ‘RSI’ oscillators are now
Source: Falcon:
signaling a positive crossover.
Trading strategy:
Actionable points:
Friday’s strong closing was followed by a quiet session in our
market. It was quiet evident to have such a sideways
View for the day
Neutral
movement in prices after a sharp rally of nearly 4.50% in
three consecutive sessions. However, individual mid—cap
Resistance Level
5920
counters continued to outperform the benchmark indices.
Support Levels
5854 - 5800
During the day, the Nifty was unable to traverse the
psychological level of 5900 and eventually closed well below
The underlying trend remains positive and we advise traders to
that level. Going forward, a sustainable move beyond
adopt stock specific approach (especially mid-cap counters),
19417 / 5900 mark would push the indices higher to test
which may fetch good returns in coming trading sessions.
immediate resistance level of 19812 / 5945. On the flipside,
the daily chart now depicts a price pattern which resembles a
‘Spinning Top’. An occurrence of this pattern after a decent
up move indicates a short term breather, in the form of a
consolidation or minor corrective move. However, this
pattern requires a confirmation in the form of closing below
the low of the candle, which is at 19257 / 5854. Thus, in this
scenario, we may witness a minor correction in the prices
towards the support level of 19000 / 5800.
1
Daily Technical Report
December 04, 2012
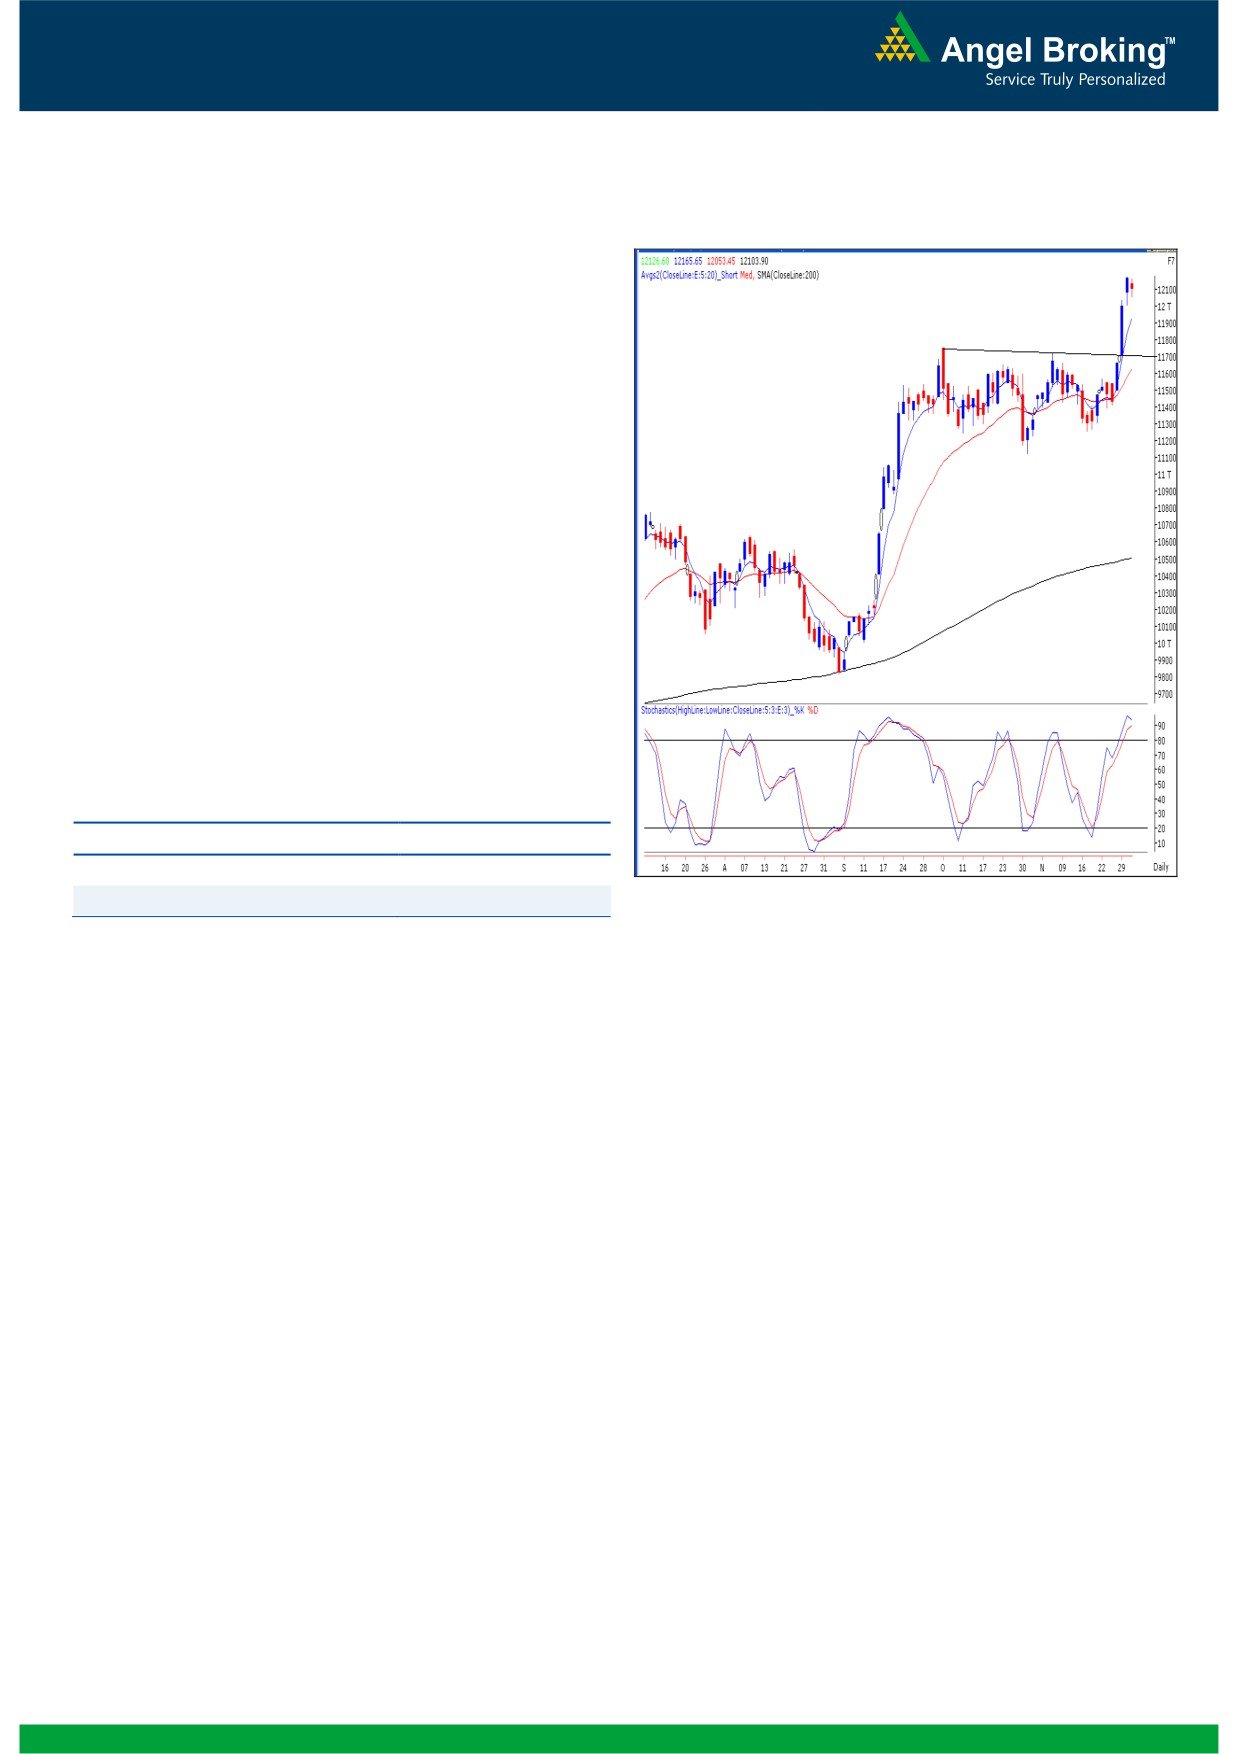
Exhibit 2: Bank Nifty Hourly Chart
Bank Nifty Outlook - (12104)
Yesterday, Bank Nifty opened on a flat note and traded in a
narrow range throughout the session. We have been
mentioning in our previous reports that the momentum
oscillators are placed in overbought zone and a minor
pullback or consolidation in the index cannot be ruled out. At
this juncture, we are witnessing a “Bearish Harami”
candlestick pattern on the daily chart. The mentioned pattern
is a reversal pattern but requires confirmation in the form of a
close below 12053 level. However, considering the overall
trend we reiterate our view that any pullback / correction in
the index should not be termed as a change of trend and
must be used to create fresh long positions. On the upside
12175 - 12335 are likely to act as resistance and 12053 -
11957 are likely to act as support for the day.
Actionable points:
View for the day
Neutral
Resistance Levels
12175 - 12335
Source: Falcon:
Support Levels
12053 - 11957
2
Daily Technical Report
December 04, 2012
Daily Pivot Levels for Nifty 50 Stocks
SCRIPS
S2
S1
PIVOT
R1
R2
SENSEX
19,167
19,236
19,326
19,395
19,486
NIFTY
5,830
5,851
5,875
5,895
5,919
BANKNIFTY
11,995
12,050
12,108
12,162
12,220
ACC
1,360
1,398
1,423
1,461
1,485
AMBUJACEM
204
207
209
212
215
ASIANPAINT
4,267
4,307
4,345
4,385
4,423
AXISBANK
1,297
1,309
1,317
1,330
1,337
BAJAJ-AUTO
1,901
1,914
1,934
1,947
1,966
BANKBARODA
747
753
761
766
774
BHARTIARTL
324
328
334
337
343
BHEL
229
233
236
241
244
BPCL
338
341
344
347
350
CAIRN
328
330
332
334
336
CIPLA
405
409
413
417
421
COALINDIA
356
361
368
373
380
DLF
208
209
211
212
213
DRREDDY
1,807
1,819
1,834
1,846
1,861
GAIL
341
345
351
355
360
GRASIM
3,252
3,287
3,346
3,381
3,440
HCLTECH
641
644
650
654
660
HDFC
823
830
837
844
852
HDFCBANK
674
680
691
697
708
HEROMOTOCO
1,790
1,806
1,818
1,833
1,845
HINDALCO
114
116
117
119
120
HINDUNILVR
531
534
538
541
545
ICICIBANK
1,083
1,092
1,103
1,113
1,124
IDFC
166
167
170
172
175
INFY
2,410
2,425
2,439
2,453
2,467
ITC
292
294
296
298
300
JINDALSTEL
395
400
407
412
419
JPASSOCIAT
94
96
97
99
101
KOTAKBANK
653
659
665
671
677
LT
1,635
1,651
1,668
1,684
1,701
LUPIN
573
579
589
595
605
M&M
941
949
957
966
974
MARUTI
1,466
1,478
1,491
1,503
1,516
NTPC
157
159
161
162
164
ONGC
259
261
263
265
267
PNB
769
776
784
791
799
POWERGRID
117
118
119
120
120
RANBAXY
492
496
502
507
513
RELIANCE
783
794
800
811
818
RELINFRA
479
484
488
493
496
SBIN
2,159
2,182
2,196
2,218
2,232
SESAGOA
179
181
183
185
187
SIEMENS
665
670
676
681
687
SUNPHARMA
693
699
705
711
718
TATAMOTORS
268
270
273
276
279
TATAPOWER
105
106
107
109
110
TATASTEEL
384
387
390
394
397
TCS
1,298
1,307
1,315
1,324
1,331
ULTRACEMCO
1,970
1,985
2,001
2,016
2,032
WIPRO
391
393
395
397
399
3
Daily Technical Report
December 04, 2012
Research Team Tel: 022 - 39357800
DISCLAIMER
This document is solely for the personal information of the recipient, and must not be singularly used as the basis of any investment
decision. Nothing in this document should be construed as investment or financial advice. Each recipient of this document should make
such investigations as they deem necessary to arrive at an independent evaluation of an investment in the securities of the companies
referred to in this document (including the merits and risks involved), and should consult their own advisors to determine the merits and
risks of such an investment.
Angel Broking Limited, its affiliates, directors, its proprietary trading and investment businesses may, from time to time, make
investment decisions that are inconsistent with or contradictory to the recommendations expressed herein. The views contained in this
document are those of the analyst, and the company may or may not subscribe to all the views expressed within.
Reports based on technical and derivative analysis center on studying charts of a stock's price movement, outstanding positions and
trading volume, as opposed to focusing on a company's fundamentals and, as such, may not match with a report on a company's
fundamentals.
The information in this document has been printed on the basis of publicly available information, internal data and other reliable
sources believed to be true, but we do not represent that it is accurate or complete and it should not be relied on as such, as this
document is for general guidance only. Angel Broking Limited or any of its affiliates/ group companies shall not be in any way
responsible for any loss or damage that may arise to any person from any inadvertent error in the information contained in this report.
Angel Broking Limited has not independently verified all the information contained within this document. Accordingly, we cannot testify,
nor make any representation or warranty, express or implied, to the accuracy, contents or data contained within this document. While
Angel Broking Limited endeavours to update on a reasonable basis the information discussed in this material, there may be regulatory,
compliance, or other reasons that prevent us from doing so.
This document is being supplied to you solely for your information, and its contents, information or data may not be reproduced,
redistributed or passed on, directly or indirectly.
Angel Broking Limited and its affiliates may seek to provide or have engaged in providing corporate finance, investment banking or
other advisory services in a merger or specific transaction to the companies referred to in this report, as on the date of this report or in
the past.
Neither Angel Broking Limited, nor its directors, employees or affiliates shall be liable for any loss or damage that may arise from or in
connection with the use of this information.
Note: Please refer to the important `Stock Holding Disclosure' report on the Angel website (Research Section). Also, please refer to the
latest update on respective stocks for the disclosure status in respect of those stocks. Angel Broking Limited and its affiliates may have
investment positions in the stocks recommended in this report.
Research Team
Shardul Kulkarni
-
Head - Technicals
Sameet Chavan
-
Technical Analyst
Sacchitanand Uttekar
-
Technical Analyst
Mehul Kothari
-
Technical Analyst
Ankur Lakhotia
-
Technical Analyst
Angel Broking Pvt. Ltd.
Registered Office: G-1, Ackruti Trade Centre, Rd. No. 7, MIDC, Andheri (E), Mumbai - 400 093.
Corporate Office: 6th Floor, Ackruti Star, MIDC, Andheri (E), Mumbai - 400 093. Tel: (022) 3952 6600
Sebi Registration No: INB 010996539
4