Daily Technical Report
March 04, 2013
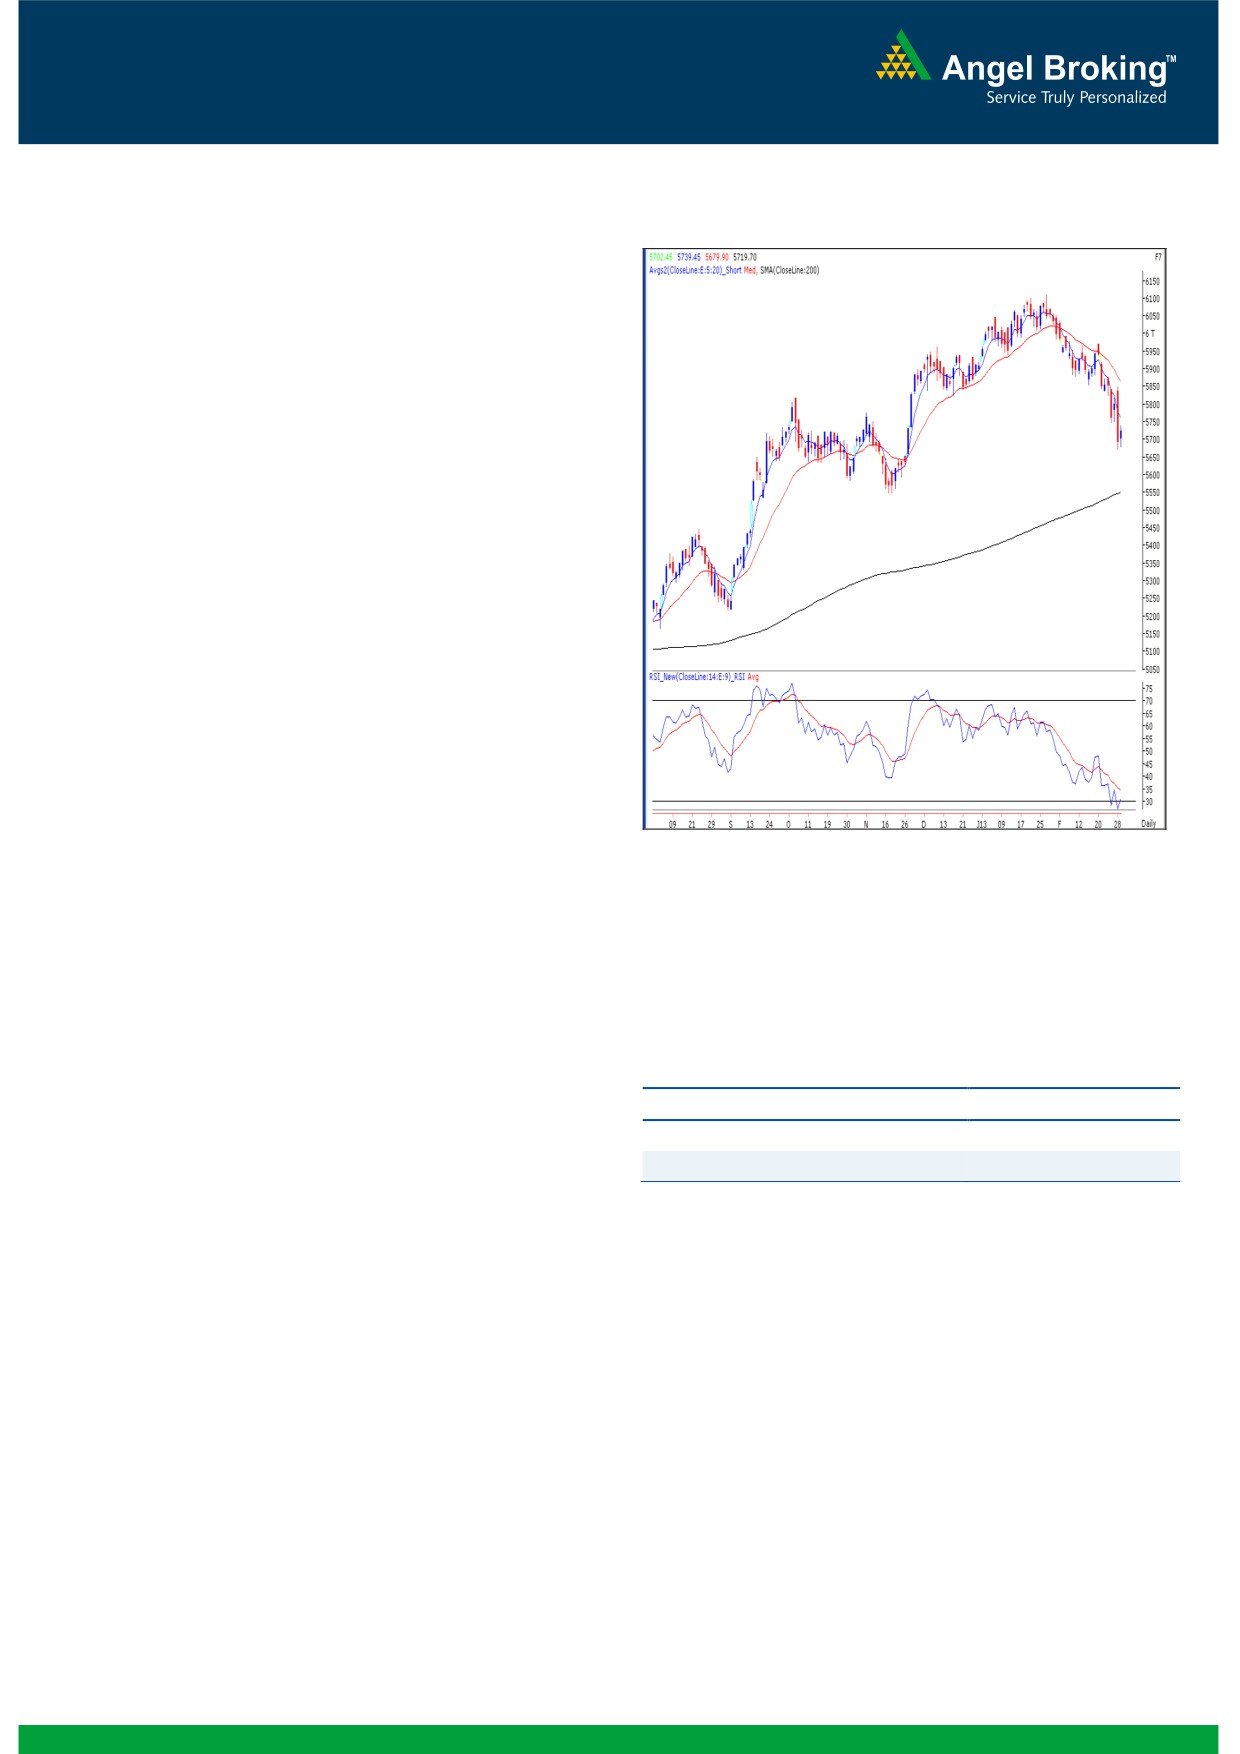
Exhibit 1: Nifty Daily Chart
Sensex (18919) / NIFTY (5720)
On Friday, our benchmark indices opened on a flat note and
traded in a narrow range to close marginally above the
5700 mark. During the day, Consumer Durables, capital
Goods and Auto counters ended on a winning streak
whereas Realty ended on the losing side. The advance to
decline ratio was strongly in favor of declining counters
Formation
The ’20-day EMA’ and the ’20-week EMA’ are placed at
19372 / 5863 and 19175 / 5813 levels, respectively.
The monthly chart exhibits a ‘Bearish Engulfing’ pattern.
The monthly momentum oscillators are signaling a
negative crossover.
The level of the weekly ‘RSI’ momentum oscillator has
now dropped below the 50 mark.
Source: Falcon:
Indices have closed marginally above the ‘Downward
Sloping Trend Line’, drawn by joining two significant
highs of 21109 / 6339 (high of November 05, 2010
weekly candle) and 19137 / 5816 (high of October 05,
2012 weekly candle).
Actionable points:
Trading strategy:
View
SELL BELOW 5672
For the sixth consecutive week, our benchmark indices have
Expected target
5600
closed in the negative territory. As mentioned in our January
Resistance levels
5740 - 5766
25, 2013 weekly report, the bearish impact of the ‘Hanging
Man’ (at market top) Japanese candlestick pattern is now
clearly seen. Indices have now finally broken down below
On the contrary, indices have now precisely closed above the
the 19149 / 5823 mark, which has been acting as a crucial
support level of the ‘Downward Sloping Trend Line’ (please
support level. This level also coincides with the ’89-day EMA’
refer exhibit
1). Hence, the impact of all the above
and the ’20-week EMA’. Since the February month is over,
mentioned negative technical evidences would be seen once
the monthly chart now depicts a ‘Bearish Engulfing’ pattern.
indices sustain below this week’s low of 18793 / 5671. In
This pattern has a bearish implication but needs a
this scenario, indices are likely to fall towards 18450 -
confirmation. In addition, the monthly momentum oscillators
18255 / 5600 - 5548 levels. On the flipside, this week’s
are signaling a negative crossover. Also, the weekly ‘RSI’
high of 19412 / 5879 would now act as a crucial resistance
momentum oscillator has now sneaked below the 50 mark.
in the coming week. Only a move beyond this level may
RSI level dropping below 50 from the upside is an additional
nullify the impact of negative technical evidences. With such
sign of caution for the bulls.
a move the markets may rally towards 19768 - 19865 /
5991 - 6025 levels.
1
Daily Technical Report
March 04, 2013
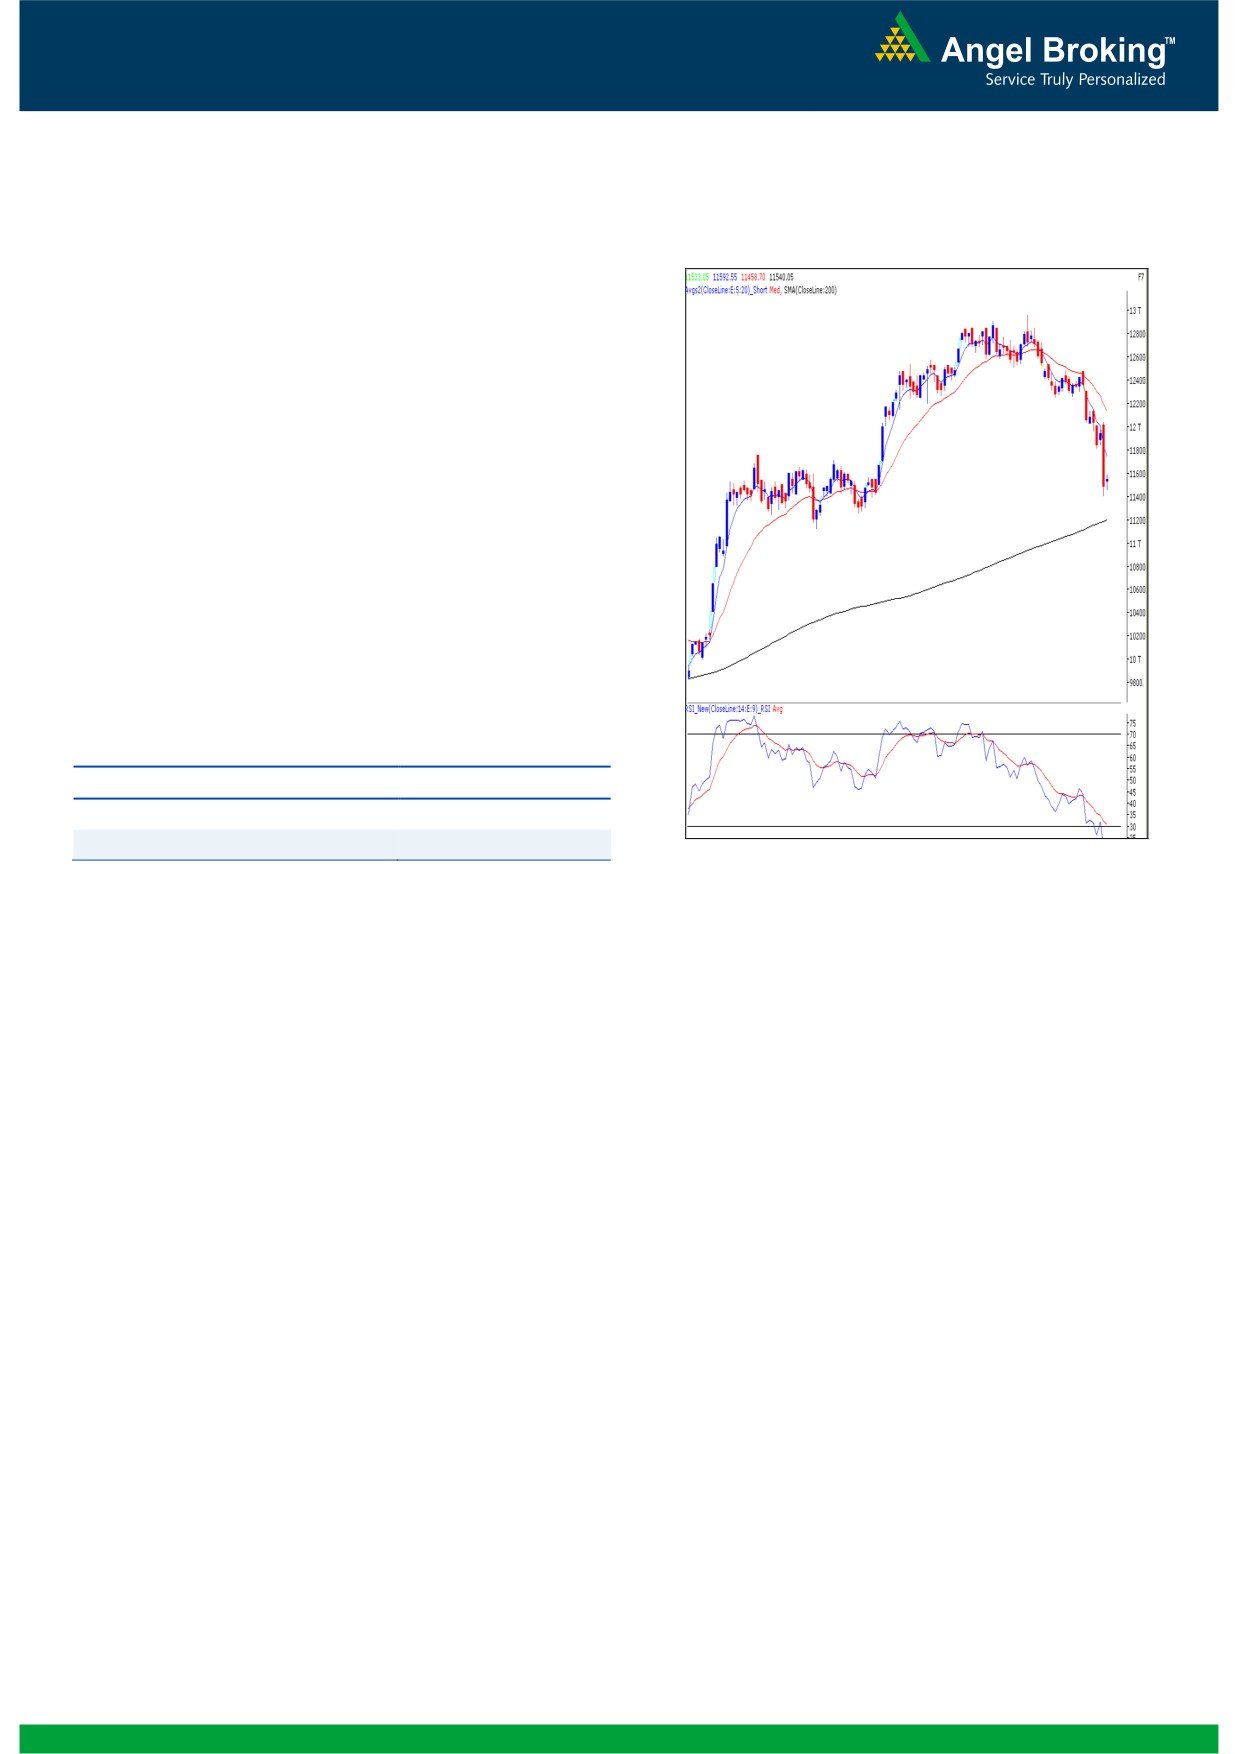
Exhibit 2: Bank Nifty Daily Chart
Bank Nifty Outlook - (11540)
On Friday, Bank Nifty opened on a flat note and traded in
a narrow range throughout the session to close near the
initial opening level. As there is no major change in the
chart structure we reiterate our view that creation of fresh
short positions at current level is not advisable. The
momentum oscillators on the daily chart continue to be
oversold territory and hence further consolidation or a
relief rally in the index cannot be ruled out. For the day
11593 - 11810 levels are likely to act as resistance and
11392 - 11256 levels are likely to act as support. Traders
holding short position in the index should maintain a stop
loss of 11810.
Actionable points:
View
Neutral
Resistance Levels
11593 - 11810
Support levels
11392 - 11256
Source: Falcon:
2
Daily Technical Report
March 04, 2013
Daily Pivot Levels for Nifty 50 Stocks
SCRIPS
S2
S1
PIVOT
R1
R2
SENSEX
18,741
18,830
18,909
18,998
19,077
NIFTY
5,653
5,687
5,713
5,746
5,773
BANKNIFTY
11,397
11,468
11,530
11,602
11,664
ACC
1,234
1,251
1,265
1,282
1,297
AMBUJACEM
187
190
192
195
197
ASIANPAINT
4,223
4,291
4,338
4,406
4,453
AXISBANK
1,294
1,329
1,354
1,388
1,413
BAJAJ-AUTO
1,911
1,969
2,006
2,065
2,101
BANKBARODA
676
692
707
724
739
BHARTIARTL
297
304
315
322
334
BHEL
196
199
201
203
206
BPCL
367
376
382
392
398
CAIRN
288
290
293
295
298
CIPLA
347
359
365
377
383
COALINDIA
306
310
315
319
323
DLF
245
252
265
272
285
DRREDDY
1,693
1,718
1,745
1,769
1,796
GAIL
325
328
331
335
338
GRASIM
2,861
2,918
2,962
3,019
3,064
HCLTECH
709
716
723
729
736
HDFC
746
762
772
788
799
HDFCBANK
610
616
623
629
636
HEROMOTOCO
1,590
1,619
1,643
1,671
1,696
HINDALCO
97
98
99
100
101
HINDUNILVR
433
443
450
460
466
ICICIBANK
1,037
1,047
1,057
1,066
1,076
IDFC
139
143
146
150
153
INFY
2,853
2,883
2,922
2,953
2,992
ITC
284
288
293
296
301
JINDALSTEL
342
350
359
367
375
JPASSOCIAT
67
70
71
74
75
KOTAKBANK
646
650
655
659
664
LT
1,351
1,376
1,393
1,418
1,435
LUPIN
557
576
587
606
617
M&M
851
869
881
899
911
MARUTI
1,334
1,379
1,408
1,453
1,482
NTPC
146
148
149
152
153
ONGC
300
307
313
321
327
PNB
768
778
792
802
815
POWERGRID
102
105
107
110
112
RANBAXY
365
375
381
391
396
RELIANCE
798
804
811
817
824
RELINFRA
407
420
431
444
455
SBIN
2,045
2,066
2,088
2,109
2,130
SESAGOA
150
152
155
157
160
SIEMENS
483
489
500
507
518
SUNPHARMA
776
788
797
809
819
TATAMOTORS
276
282
288
294
299
TATAPOWER
91
94
96
99
102
TATASTEEL
335
338
343
346
350
TCS
1,487
1,495
1,505
1,513
1,523
ULTRACEMCO
1,836
1,861
1,890
1,915
1,944
WIPRO
415
418
422
425
429
3
Daily Technical Report
March 04, 2013
Research Team Tel: 022 - 30940000
DISCLAIMER
This document is solely for the personal information of the recipient, and must not be singularly used as the basis of any investment
decision. Nothing in this document should be construed as investment or financial advice. Each recipient of this document should make
such investigations as they deem necessary to arrive at an independent evaluation of an investment in the securities of the companies
referred to in this document (including the merits and risks involved), and should consult their own advisors to determine the merits and
risks of such an investment.
Angel Broking Limited, its affiliates, directors, its proprietary trading and investment businesses may, from time to time, make
investment decisions that are inconsistent with or contradictory to the recommendations expressed herein. The views contained in this
document are those of the analyst, and the company may or may not subscribe to all the views expressed within.
Reports based on technical and derivative analysis center on studying charts of a stock's price movement, outstanding positions and
trading volume, as opposed to focusing on a company's fundamentals and, as such, may not match with a report on a company's
fundamentals.
The information in this document has been printed on the basis of publicly available information, internal data and other reliable
sources believed to be true, but we do not represent that it is accurate or complete and it should not be relied on as such, as this
document is for general guidance only. Angel Broking Limited or any of its affiliates/ group companies shall not be in any way
responsible for any loss or damage that may arise to any person from any inadvertent error in the information contained in this report.
Angel Broking Limited has not independently verified all the information contained within this document. Accordingly, we cannot testify,
nor make any representation or warranty, express or implied, to the accuracy, contents or data contained within this document. While
Angel Broking Limited endeavours to update on a reasonable basis the information discussed in this material, there may be regulatory,
compliance, or other reasons that prevent us from doing so.
This document is being supplied to you solely for your information, and its contents, information or data may not be reproduced,
redistributed or passed on, directly or indirectly.
Angel Broking Limited and its affiliates may seek to provide or have engaged in providing corporate finance, investment banking or
other advisory services in a merger or specific transaction to the companies referred to in this report, as on the date of this report or in
the past.
Neither Angel Broking Limited, nor its directors, employees or affiliates shall be liable for any loss or damage that may arise from or in
connection with the use of this information.
Note: Please refer to the important `Stock Holding Disclosure' report on the Angel website (Research Section). Also, please refer to the
latest update on respective stocks for the disclosure status in respect of those stocks. Angel Broking Limited and its affiliates may have
investment positions in the stocks recommended in this report.
Research Team
Shardul Kulkarni
-
Head - Technicals
Sameet Chavan
-
Technical Analyst
Sacchitanand Uttekar
-
Technical Analyst
Ankur Lakhotia
-
Technical Analyst
Angel Broking Pvt. Ltd.
Registered Office: G-1, Ackruti Trade Centre, Rd. No. 7, MIDC, Andheri (E), Mumbai - 400 093.
Corporate Office: 6th Floor, Ackruti Star, MIDC, Andheri (E), Mumbai - 400 093. Tel: (022) 30940000
Sebi Registration No: INB 010996539
4