Daily Technical Report
February 04, 2013
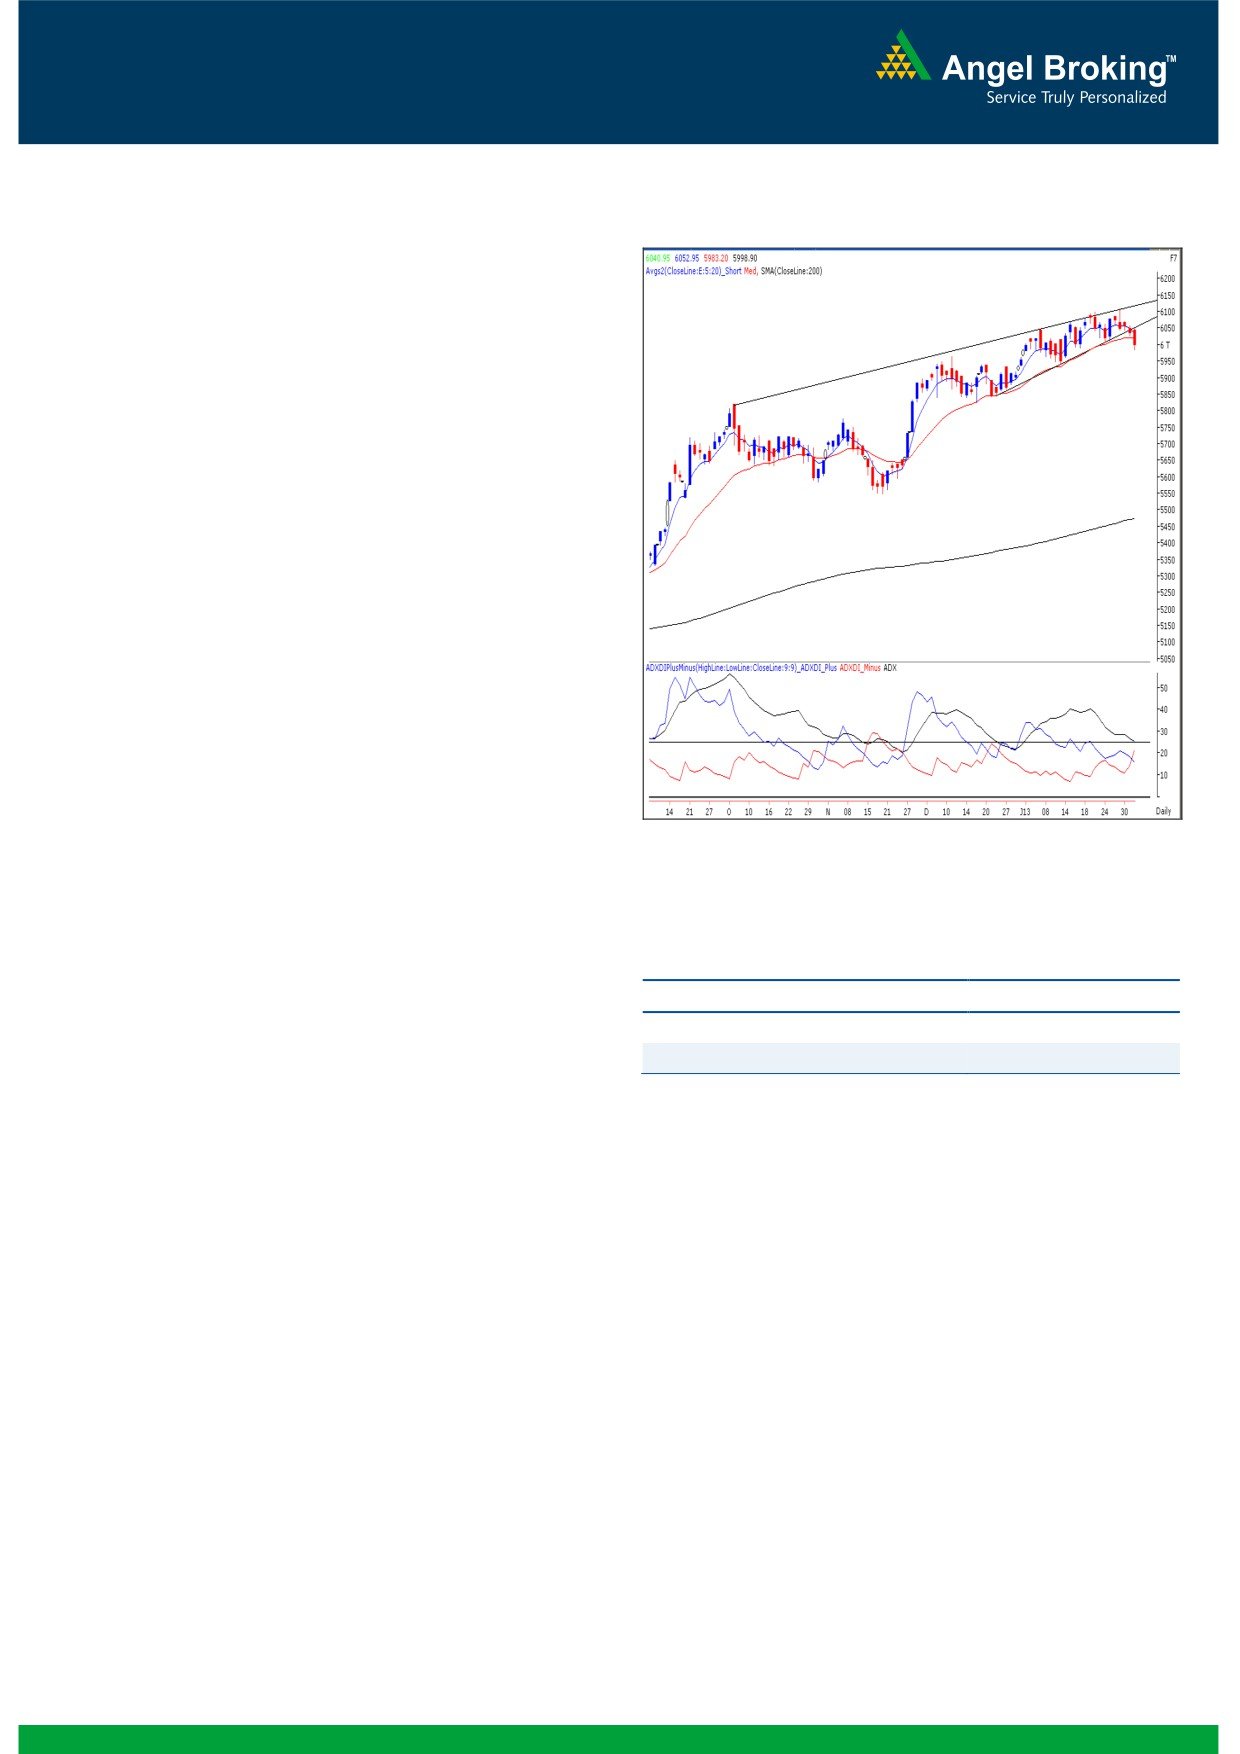
Exhibit 1: Nifty Daily Chart
Sensex (19781) / NIFTY (5999)
On Friday, the benchmark indices initially moved upwards
towards the resistance levels of 20050 / 6070. This move
can be termed as a pullback of the ‘Trend line Breakdown’
mentioned in Thursday’s report. As expected, indices faced
selling pressure at higher levels and the pace of the fall
picked up in the late afternoon trade which led the indices
(Nifty) to close below the psychological level of 6000. During
the session, the Realty, Auto and Banking counters were the
biggest losers; whereas the Consumer Durables, Healthcare
and FMCG sectors outperformed the market. The advance to
decline ratio was strongly in favor of declining counters
Formation
The ’20-day EMA’ and the ’20-week EMA’ are placed at
19870 / 6019 and 19128 / 5804 levels, respectively.
On the daily chart, the benchmark indices are facing
resistance near the ‘Upward Sloping Trend Line’ drawn
Source: Falcon:
by joining the highs of October 5, 2012 and January
18, 2012.
Actionable points:
The weekly ‘RSI’ momentum oscillator as well as the
Daily ‘ADX (9)’ indicator are now signaling a negative
View
Bearish below 5983
crossover.
Expected Targets
5940 - 5897
The ‘Hanging Man’ Japanese Candlestick pattern on the
Resistance Levels
6053 - 6112
weekly chart has been confirmed.
Trading strategy:
Last week, despite a favorable outcome from the RBI’s
In this scenario, indices are likely to slide towards their next
Monetary Policy, indices struggled to sustain at higher levels.
support levels of
19596
-
19406
/
5940
-
5897.
Strong selling pressure near the week’s high ultimately
Conversely, this week’s high of 20204 / 6112 would now act
dragged indices lower to close marginally below last week’s
as resistance in the coming trading session. Only a
low
19884
/
6007. This has confirmed the bearish
sustainable move above this level would negate the bearish
implication of the ‘Hanging Man’ Japanese candlestick
implication of the ‘Hanging Man’ pattern.
pattern mentioned in our previous report. Also, our
We advise traders to trade with strict stop losses and any
benchmark indices have also managed to close below the
intraweek bounce can be used as exit opportunity for existing
’20-day EMA’ for the first time after November 26, 2012.
long positions.
This is also a sign of weakness. In addition there is a
negative crossover in weekly ‘RSI’ momentum oscillators and
the daily ‘ADX (9)’ indicator. Considering all the negative
technical evidences, we expect continuation of the negative
momentum in the coming week as well.
1
Daily Technical Report
February 04, 2013
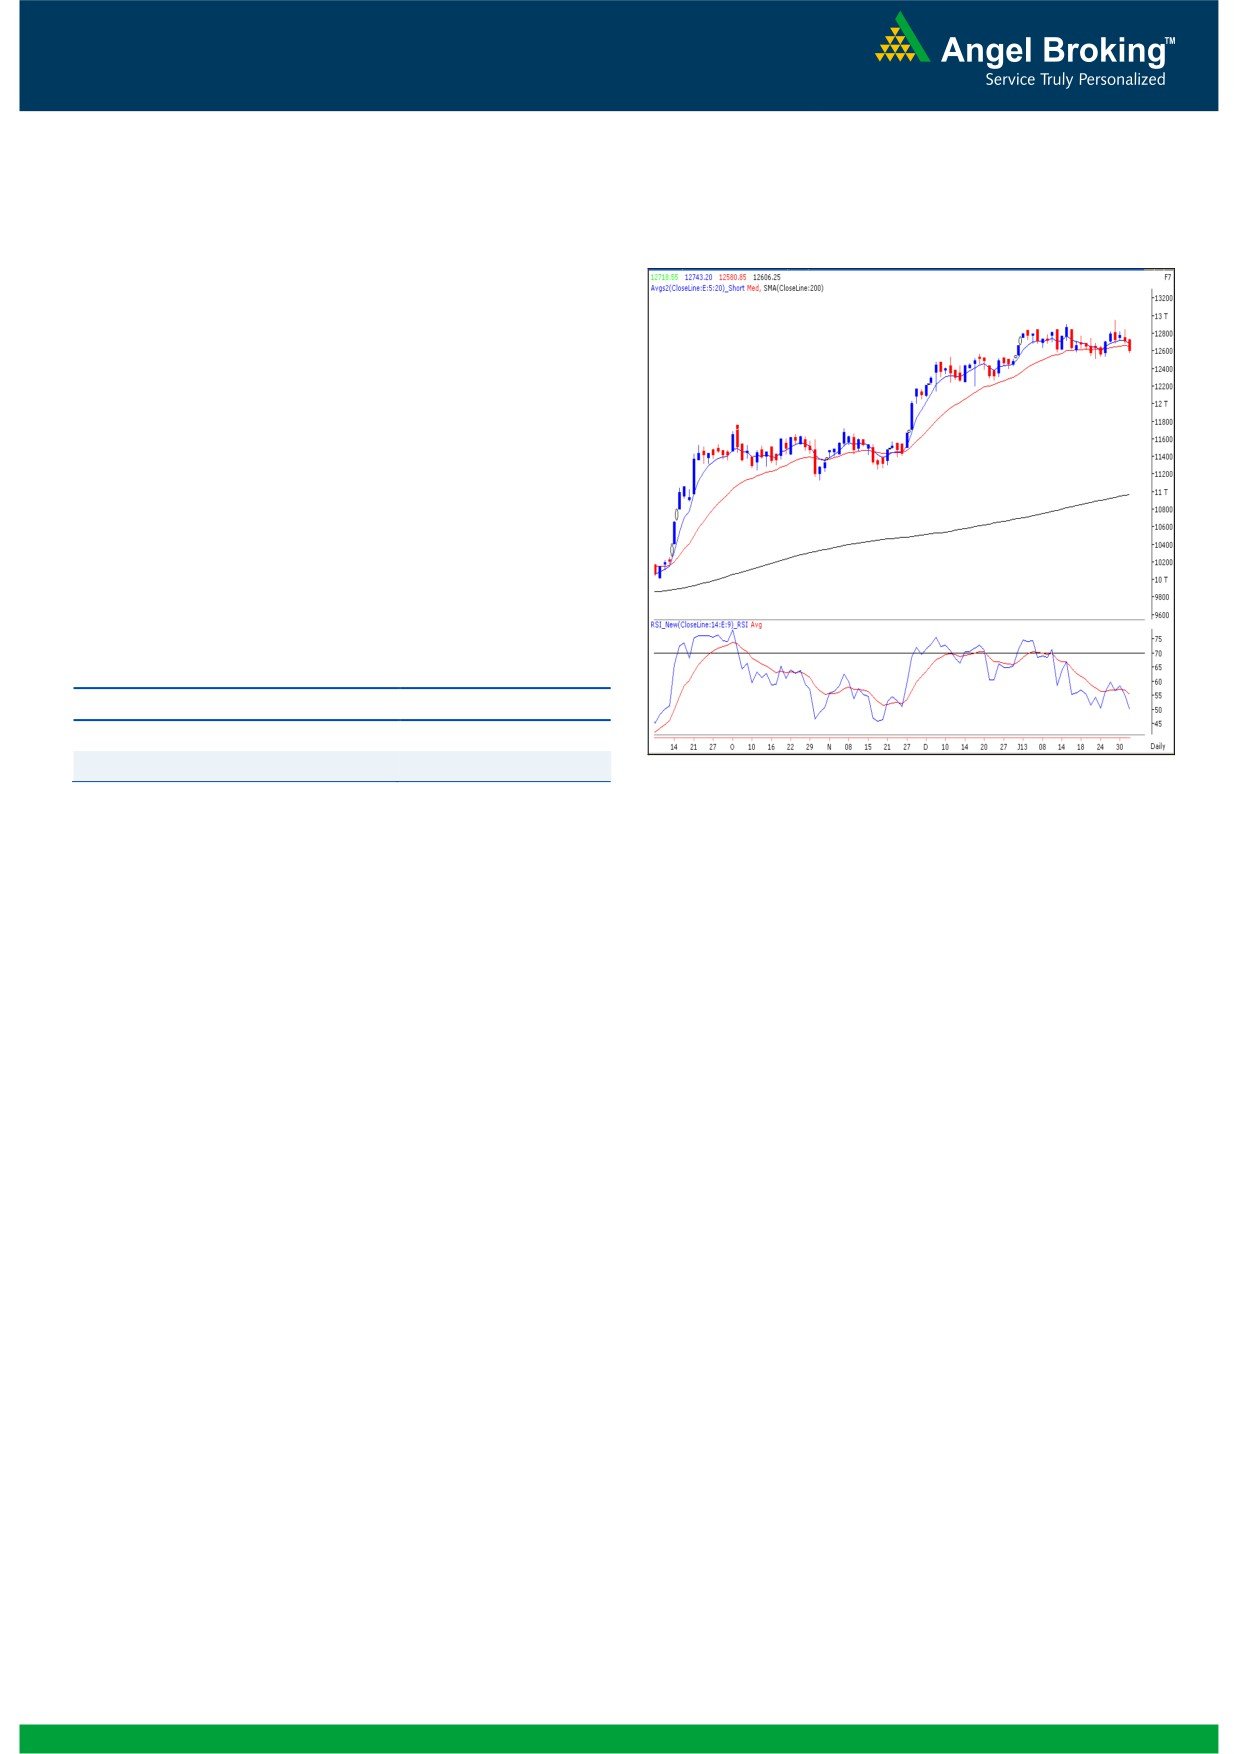
Exhibit 2: Bank Nifty Daily Chart
Bank Nifty Outlook - (12606)
On Friday, the index opened on a pessimistic note and
selling pressure throughout the day led the index to close at
the mentioned support level of 12606. However the index
continues to trade in the mentioned range of 12500 -
13000 since the past few sessions. At this juncture the
momentum oscillators on the hourly chart are placed in
extreme oversold zone and a minor positive move in the first
half of the session cannot be ruled out. Within the mentioned
range, 12550 - 12509 levels are likely to act as support and
12703 - 12775 are likely to act as resistance for the day.
Actionable points:
View
Neutral
Resistance levels
12703 - 12775
Support Levels
12550 - 12509
Source: Falcon:
2
Daily Technical Report
February 04, 2013
Daily Pivot Levels for Nifty 50 Stocks
SCRIPS
S2
S1
PIVOT
R1
R2
SENSEX
19,598
19,690
19,828
19,920
20,058
NIFTY
5,942
5,970
6,012
6,040
6,081
BANKNIFTY
12,481
12,544
12,643
12,706
12,806
ACC
1,305
1,312
1,322
1,329
1,340
AMBUJACEM
193
196
201
204
208
ASIANPAINT
4,484
4,513
4,534
4,563
4,584
AXISBANK
1,475
1,493
1,504
1,521
1,532
BAJAJ-AUTO
2,008
2,032
2,054
2,078
2,101
BANKBARODA
856
862
869
875
882
BHARTIARTL
314
322
334
342
354
BHEL
211
218
224
231
237
BPCL
405
414
420
429
435
CAIRN
323
325
327
328
330
CIPLA
404
409
412
417
420
COALINDIA
345
351
355
361
365
DLF
256
262
270
276
284
DRREDDY
1,905
1,925
1,942
1,962
1,979
GAIL
337
340
344
347
351
GRASIM
2,973
2,992
3,006
3,026
3,040
HCLTECH
674
681
689
696
704
HDFC
764
771
781
787
797
HDFCBANK
632
636
640
645
649
HEROMOTOCO
1,779
1,795
1,810
1,825
1,840
HINDALCO
110
112
115
116
119
HINDUNILVR
458
461
467
471
476
ICICIBANK
1,145
1,158
1,181
1,194
1,216
IDFC
165
166
169
170
173
INFY
2,725
2,748
2,775
2,798
2,825
ITC
303
306
308
311
313
JINDALSTEL
407
412
418
423
429
JPASSOCIAT
80
82
84
86
89
KOTAKBANK
657
664
675
683
693
LT
1,512
1,522
1,539
1,550
1,566
LUPIN
595
603
614
622
633
M&M
871
878
889
897
907
MARUTI
1,562
1,586
1,604
1,628
1,646
NTPC
155
156
157
158
160
ONGC
322
327
335
340
348
PNB
880
890
903
913
926
POWERGRID
109
110
111
111
112
RANBAXY
444
446
450
452
456
RELIANCE
876
885
892
901
909
RELINFRA
509
513
518
522
527
SBIN
2,371
2,392
2,422
2,443
2,473
SESAGOA
179
181
185
188
192
SIEMENS
629
636
647
654
664
SUNPHARMA
713
716
720
724
728
TATAMOTORS
251
266
283
299
316
TATAPOWER
100
101
102
103
104
TATASTEEL
392
396
404
409
416
TCS
1,338
1,343
1,347
1,353
1,357
ULTRACEMCO
1,611
1,724
1,826
1,939
2,040
WIPRO
403
405
409
412
416
3
Daily Technical Report
February 04, 2013
Research Team Tel: 022 - 30940000
DISCLAIMER
This document is solely for the personal information of the recipient, and must not be singularly used as the basis of any investment
decision. Nothing in this document should be construed as investment or financial advice. Each recipient of this document should make
such investigations as they deem necessary to arrive at an independent evaluation of an investment in the securities of the companies
referred to in this document (including the merits and risks involved), and should consult their own advisors to determine the merits and
risks of such an investment.
Angel Broking Limited, its affiliates, directors, its proprietary trading and investment businesses may, from time to time, make
investment decisions that are inconsistent with or contradictory to the recommendations expressed herein. The views contained in this
document are those of the analyst, and the company may or may not subscribe to all the views expressed within.
Reports based on technical and derivative analysis center on studying charts of a stock's price movement, outstanding positions and
trading volume, as opposed to focusing on a company's fundamentals and, as such, may not match with a report on a company's
fundamentals.
The information in this document has been printed on the basis of publicly available information, internal data and other reliable
sources believed to be true, but we do not represent that it is accurate or complete and it should not be relied on as such, as this
document is for general guidance only. Angel Broking Limited or any of its affiliates/ group companies shall not be in any way
responsible for any loss or damage that may arise to any person from any inadvertent error in the information contained in this report.
Angel Broking Limited has not independently verified all the information contained within this document. Accordingly, we cannot testify,
nor make any representation or warranty, express or implied, to the accuracy, contents or data contained within this document. While
Angel Broking Limited endeavours to update on a reasonable basis the information discussed in this material, there may be regulatory,
compliance, or other reasons that prevent us from doing so.
This document is being supplied to you solely for your information, and its contents, information or data may not be reproduced,
redistributed or passed on, directly or indirectly.
Angel Broking Limited and its affiliates may seek to provide or have engaged in providing corporate finance, investment banking or
other advisory services in a merger or specific transaction to the companies referred to in this report, as on the date of this report or in
the past.
Neither Angel Broking Limited, nor its directors, employees or affiliates shall be liable for any loss or damage that may arise from or in
connection with the use of this information.
Note: Please refer to the important `Stock Holding Disclosure' report on the Angel website (Research Section). Also, please refer to the
latest update on respective stocks for the disclosure status in respect of those stocks. Angel Broking Limited and its affiliates may have
investment positions in the stocks recommended in this report.
Research Team
Shardul Kulkarni
-
Head - Technicals
Sameet Chavan
-
Technical Analyst
Sacchitanand Uttekar
-
Technical Analyst
Mehul Kothari
-
Technical Analyst
Ankur Lakhotia
-
Technical Analyst
Angel Broking Pvt. Ltd.
Registered Office: G-1, Ackruti Trade Centre, Rd. No. 7, MIDC, Andheri (E), Mumbai - 400 093.
Corporate Office: 6th Floor, Ackruti Star, MIDC, Andheri (E), Mumbai - 400 093. Tel: (022) 30940000
Sebi Registration No: INB 010996539
4