Daily Technical Report
December 03, 2012
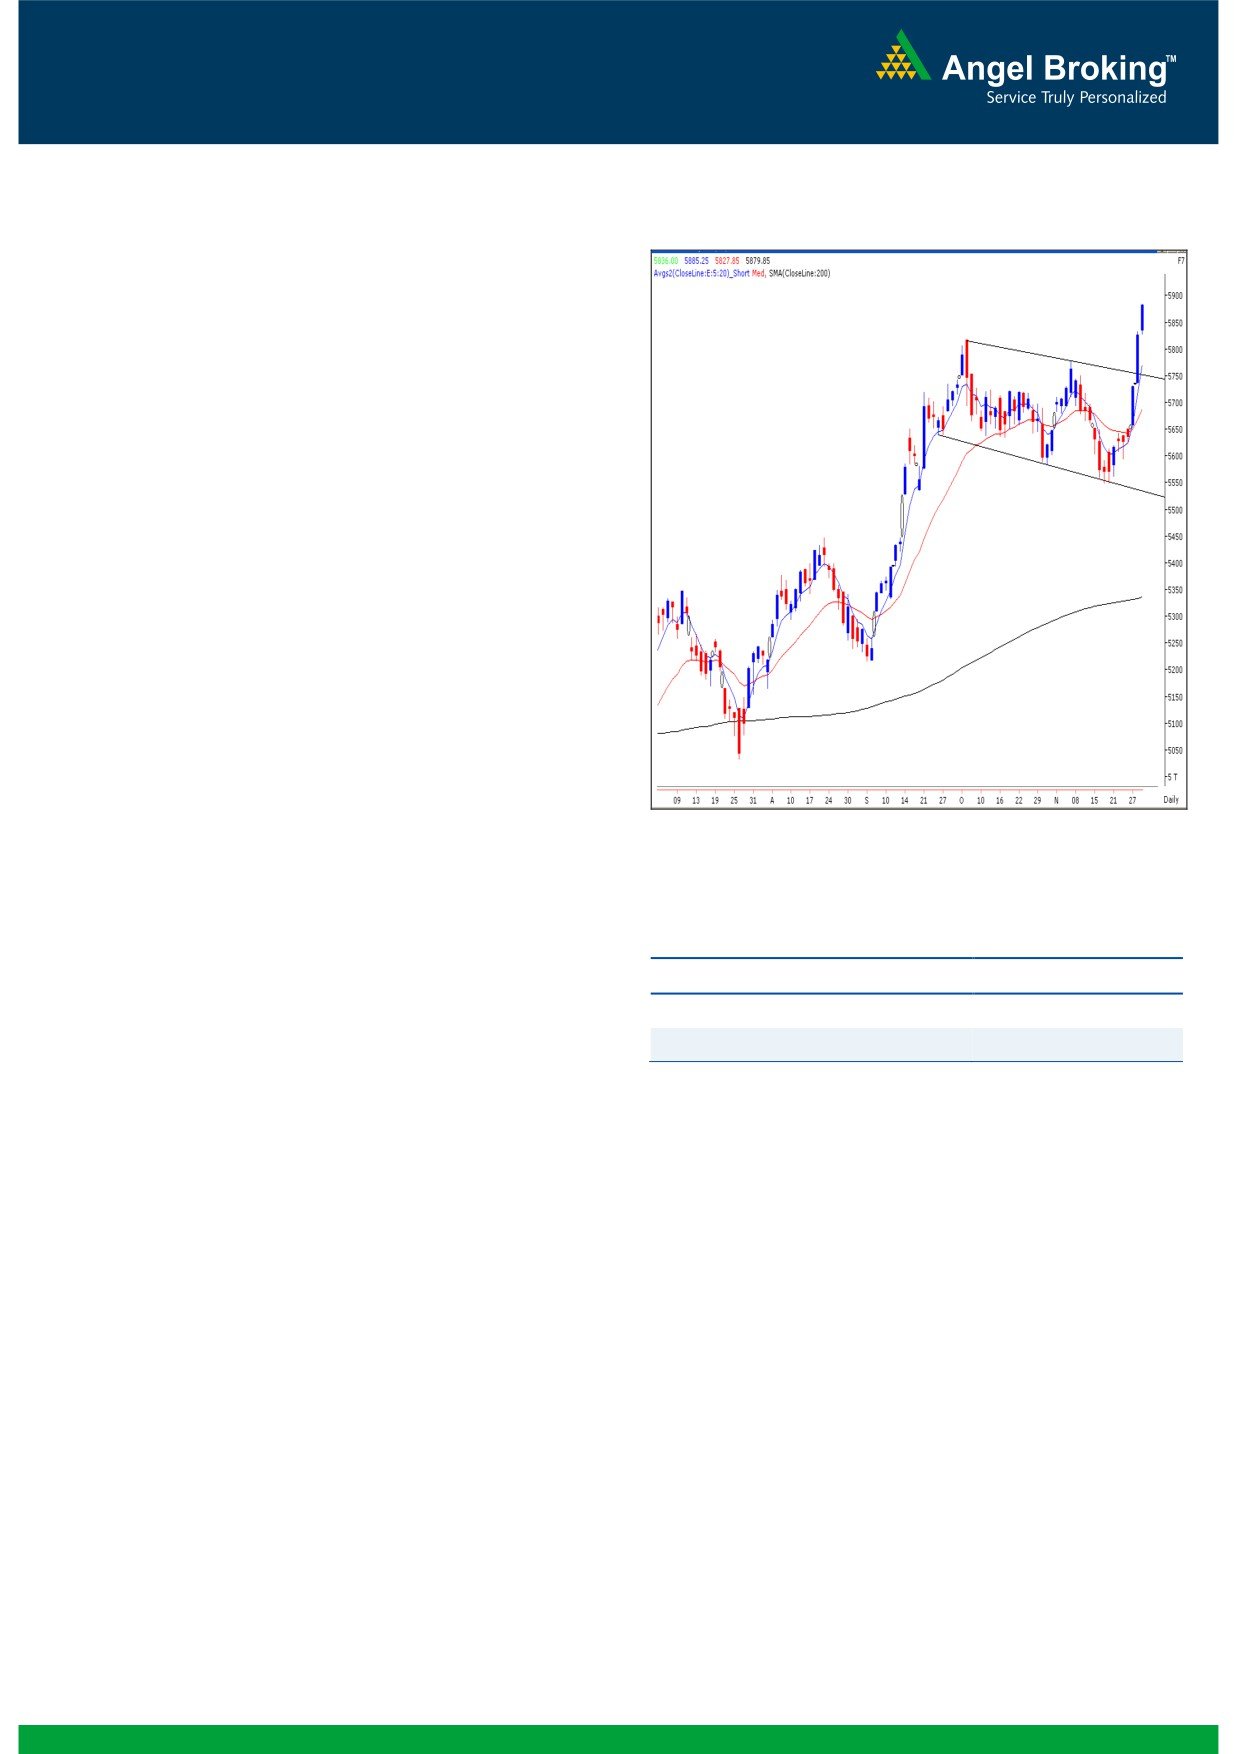
Exhibit 1: Nifty Daily Chart
Sensex (19340) / NIFTY (5880)
On Friday, for the third consecutive session our markets
opened on a positive note and posted a healthy gain of
nearly 1%. The Nifty fell just short of the psychological mark
of 5900 and closed marginally below it. The rally was led by
Metal, Power and PSU counters. However, Auto, FMCG and
Realty stocks ended with a marginal loss. The advance to
decline ratio was strongly in favor of advancing counters
Formation
The ’20-day EMA’ and the ’20-week EMA’ are placed at
18702 / 5687 and 18281/ 5552 levels, respectively.
On the weekly chart, we are witnessing a breakout from
‘Downward Sloping Trend Line’ joining two significant
swing high of 19811 / 5944 (April 2011) and 19137 /
5815 (Oct 2012) at 19050 / 5800 level.
The target of the daily ‘Channel’ pattern breakout comes
around 19500 / 5950 level.
Source: Falcon:
The weekly ‘Stochastic’ and the ‘RSI’ oscillators are now
signaling a positive crossover.
Actionable points:
Trading strategy:
After a long consolidation of seven weeks, the bulls have
View for the day
Neutral
finally started to cut loose. We had mentioned a strong
Resistance Level
5920
support level of ‘Channel’ pattern around 18255 / 5548.
Support Levels
5825 - 5800
This level was defended comfortably by the bulls; they then
went on to break the upper range of the Channel i.e. 18900
This level coincides with the
78.60%
Fibonacci Retracement
/ 5750. As a result, we witnessed tremendous buying interest
level of the fall from 21109 (high
of weekly candle on
among market participants, leading to an extended rally in
November 5, 2010) to 15135 (low of weekly candle on
Friday’s session. The Nifty eventually closed the week
December 23, 2011). A move beyond this level in the coming
marginally below the psychological level of 5900 mark. In
week may push the indices even higher to test 20218 / 6070
addition to the Channel breakout in the daily chart, the
level in the coming 4 - 6 weeks. On the flipside, the ‘Channel’
weekly chart now depicts a ‘Trend Line’ breakout from the
breakout level of 18900 / 5750 is now expected to act as a
resistance level of 19000 / 5800. Hence, going forward, we
strong support for our market. Any intra week correction
maintain our bullish stance on the market and expect a rally
towards this level should be seen as a buying opportunity. We
towards the next resistance level of 19812 / 5945. This level
advise traders to adopt a stock specific approach and expect
coincides with the 78.60% Fibonacci Retracement level of the
metal counters to outperform the Index in the days to come.
fall from 21109 (high of weekly candle on November 5,
2010) to 15135 (low of weekly candle on December 23,
2011). A move beyond this level in the coming week may
push the indices even higher to test 20218 / 6070 level in
the coming 4 - 6 weeks. On the flipside, the ‘Channel’
breakout level of 18900 / 5750 is now expected to act as a
strong support for our market.
1
Daily Technical Report
December 03, 2012
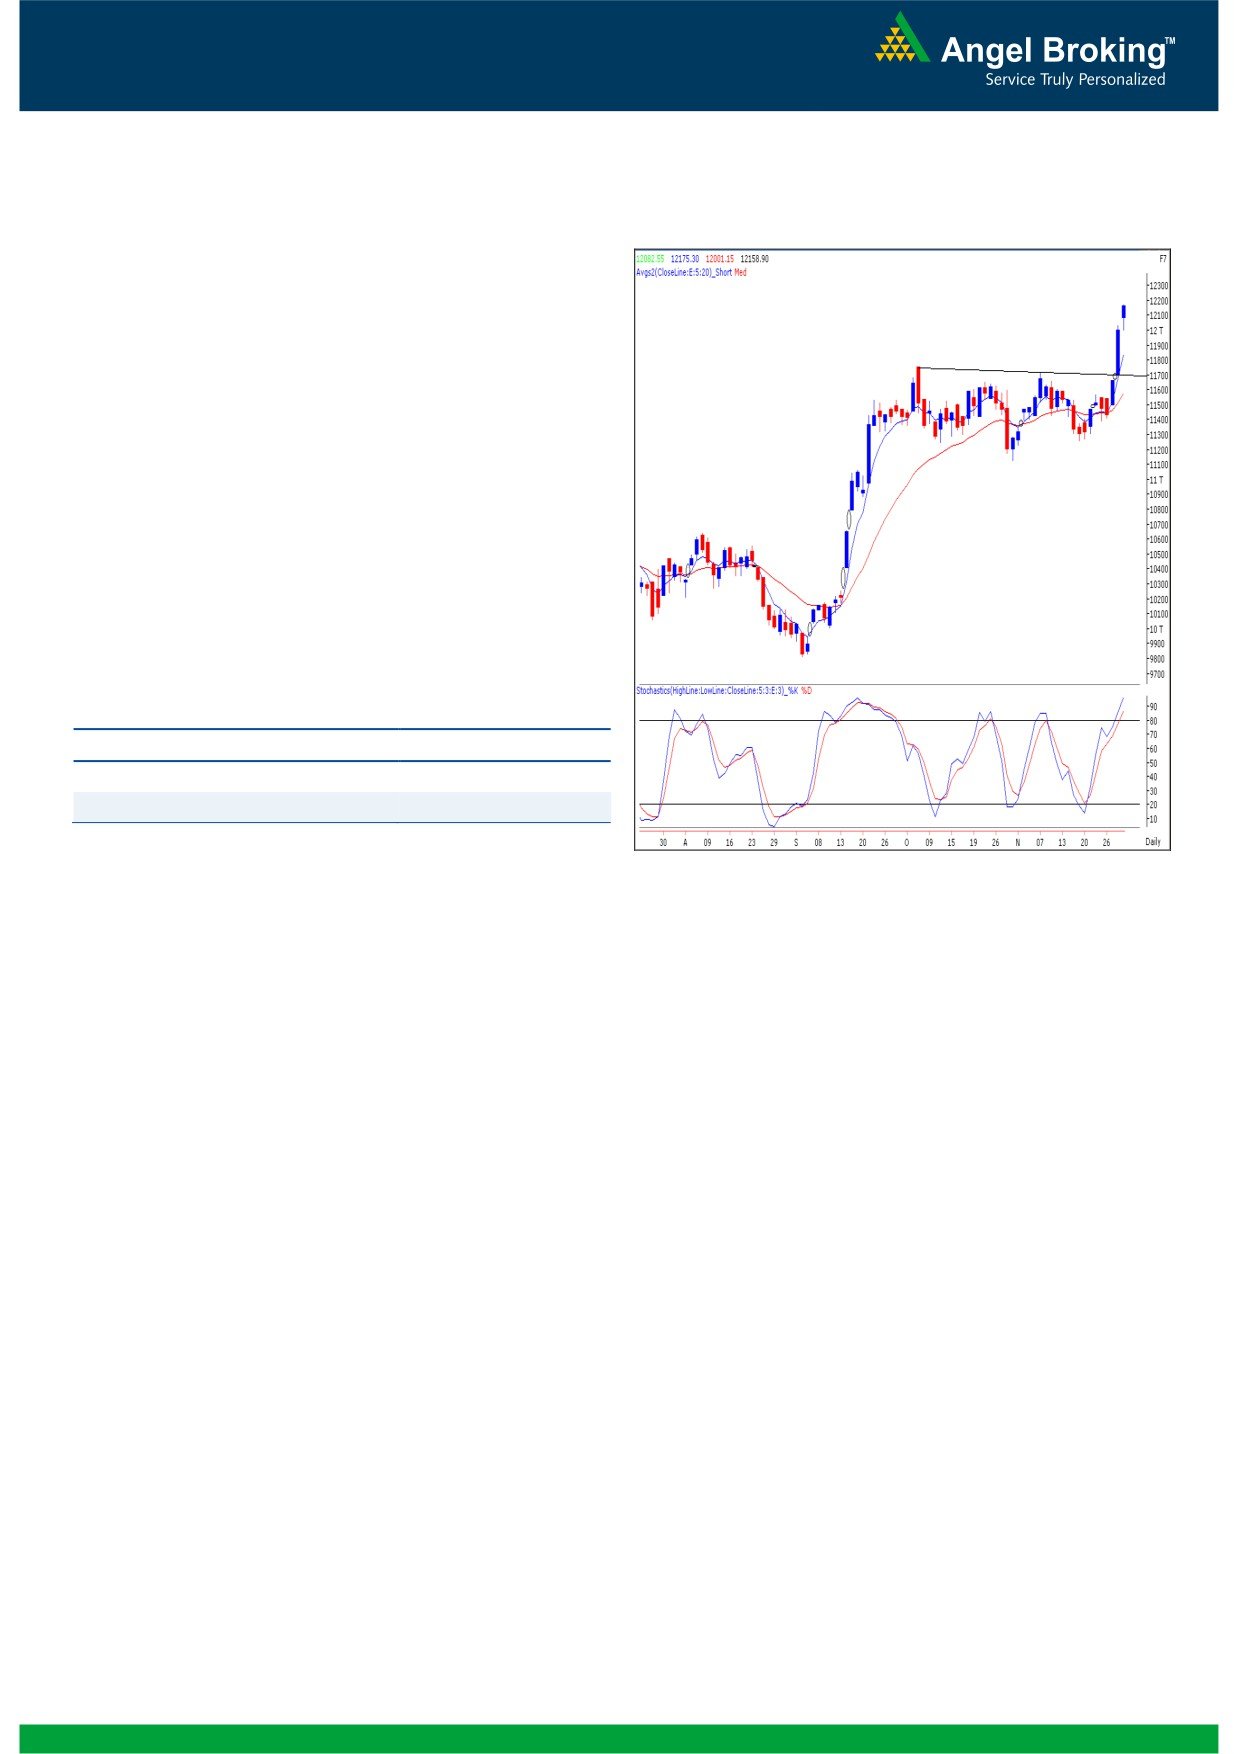
Exhibit 2: Bank Nifty Hourly Chart
Bank Nifty Outlook - (12159)
In line with the benchmark Indices, the Bank Nifty too opened
on a positive note on Friday and traded with a positive bias
throughout the session. The momentum oscillators on weekly
chart point towards further upside in the coming sessions.
However, considering the overbought condition of momentum
oscillators on the hourly and daily charts, a minor pullback or
consolidation in the index cannot be ruled out. The overall
view for the index remains positive and any decline should be
used to create fresh long positions. On the upside 12335 -
12365 are likely to act as resistance and 12000 - 11956
levels are likely to act as support for the day.
Actionable points:
View for the day
Neutral
Resistance Levels
12335 - 12365
Support Levels
12000 - 11956
Source: Falcon:
2
Daily Technical Report
December 03, 2012
Daily Pivot Levels for Nifty 50 Stocks
SCRIPS
S2
S1
PIVOT
R1
R2
SENSEX
19,113
19,227
19,300
19,413
19,486
NIFTY
5,807
5,843
5,864
5,901
5,922
BANKNIFTY
11,938
12,048
12,112
12,222
12,286
ACC
1,357
1,371
1,388
1,402
1,420
AMBUJACEM
203
206
208
210
212
ASIANPAINT
4,247
4,289
4,332
4,374
4,418
AXISBANK
1,290
1,305
1,315
1,330
1,339
BAJAJ-AUTO
1,900
1,915
1,933
1,949
1,967
BANKBARODA
729
746
758
775
787
BHARTIARTL
318
328
334
344
350
BHEL
219
227
231
239
243
BPCL
332
340
345
352
357
CAIRN
323
327
331
334
339
CIPLA
402
408
413
419
423
COALINDIA
352
359
366
374
381
DLF
205
208
210
212
214
DRREDDY
1,767
1,793
1,812
1,838
1,856
GAIL
335
344
350
359
365
GRASIM
3,242
3,301
3,345
3,404
3,448
HCLTECH
620
638
650
668
679
HDFC
811
827
838
855
866
HDFCBANK
684
694
700
710
716
HEROMOTOCO
1,787
1,807
1,836
1,856
1,885
HINDALCO
112
115
116
118
119
HINDUNILVR
528
533
541
547
555
ICICIBANK
1,084
1,092
1,099
1,106
1,113
IDFC
166
170
172
176
178
INFY
2,395
2,416
2,446
2,467
2,498
ITC
292
295
297
300
302
JINDALSTEL
371
387
397
413
422
JPASSOCIAT
94
95
96
97
98
KOTAKBANK
639
655
665
681
691
LT
1,645
1,656
1,667
1,678
1,688
LUPIN
565
578
586
600
608
M&M
915
931
941
957
967
MARUTI
1,452
1,463
1,481
1,492
1,510
NTPC
159
160
162
164
165
ONGC
249
257
262
270
275
PNB
763
774
780
792
798
POWERGRID
116
117
118
119
120
RANBAXY
492
498
504
511
517
RELIANCE
779
786
797
804
815
RELINFRA
472
479
484
490
496
SBIN
2,126
2,148
2,168
2,190
2,209
SESAGOA
177
179
181
184
186
SIEMENS
663
667
672
676
681
SUNPHARMA
700
705
710
715
720
TATAMOTORS
264
269
276
281
289
TATAPOWER
105
106
107
109
110
TATASTEEL
373
379
384
390
395
TCS
1,276
1,295
1,310
1,329
1,344
ULTRACEMCO
1,708
1,825
1,990
2,106
2,271
WIPRO
380
387
391
398
403
3
Daily Technical Report
December 03, 2012
Research Team Tel: 022 - 39357800
DISCLAIMER
This document is solely for the personal information of the recipient, and must not be singularly used as the basis of any investment
decision. Nothing in this document should be construed as investment or financial advice. Each recipient of this document should make
such investigations as they deem necessary to arrive at an independent evaluation of an investment in the securities of the companies
referred to in this document (including the merits and risks involved), and should consult their own advisors to determine the merits and
risks of such an investment.
Angel Broking Limited, its affiliates, directors, its proprietary trading and investment businesses may, from time to time, make
investment decisions that are inconsistent with or contradictory to the recommendations expressed herein. The views contained in this
document are those of the analyst, and the company may or may not subscribe to all the views expressed within.
Reports based on technical and derivative analysis center on studying charts of a stock's price movement, outstanding positions and
trading volume, as opposed to focusing on a company's fundamentals and, as such, may not match with a report on a company's
fundamentals.
The information in this document has been printed on the basis of publicly available information, internal data and other reliable
sources believed to be true, but we do not represent that it is accurate or complete and it should not be relied on as such, as this
document is for general guidance only. Angel Broking Limited or any of its affiliates/ group companies shall not be in any way
responsible for any loss or damage that may arise to any person from any inadvertent error in the information contained in this report.
Angel Broking Limited has not independently verified all the information contained within this document. Accordingly, we cannot testify,
nor make any representation or warranty, express or implied, to the accuracy, contents or data contained within this document. While
Angel Broking Limited endeavours to update on a reasonable basis the information discussed in this material, there may be regulatory,
compliance, or other reasons that prevent us from doing so.
This document is being supplied to you solely for your information, and its contents, information or data may not be reproduced,
redistributed or passed on, directly or indirectly.
Angel Broking Limited and its affiliates may seek to provide or have engaged in providing corporate finance, investment banking or
other advisory services in a merger or specific transaction to the companies referred to in this report, as on the date of this report or in
the past.
Neither Angel Broking Limited, nor its directors, employees or affiliates shall be liable for any loss or damage that may arise from or in
connection with the use of this information.
Note: Please refer to the important `Stock Holding Disclosure' report on the Angel website (Research Section). Also, please refer to the
latest update on respective stocks for the disclosure status in respect of those stocks. Angel Broking Limited and its affiliates may have
investment positions in the stocks recommended in this report.
Research Team
Shardul Kulkarni
-
Head - Technicals
Sameet Chavan
-
Technical Analyst
Sacchitanand Uttekar
-
Technical Analyst
Mehul Kothari
-
Technical Analyst
Ankur Lakhotia
-
Technical Analyst
Angel Broking Pvt. Ltd.
Registered Office: G-1, Ackruti Trade Centre, Rd. No. 7, MIDC, Andheri (E), Mumbai - 400 093.
Corporate Office: 6th Floor, Ackruti Star, MIDC, Andheri (E), Mumbai - 400 093. Tel: (022) 3952 6600
Sebi Registration No: INB 010996539
4