Daily Technical Report
January 03, 2013
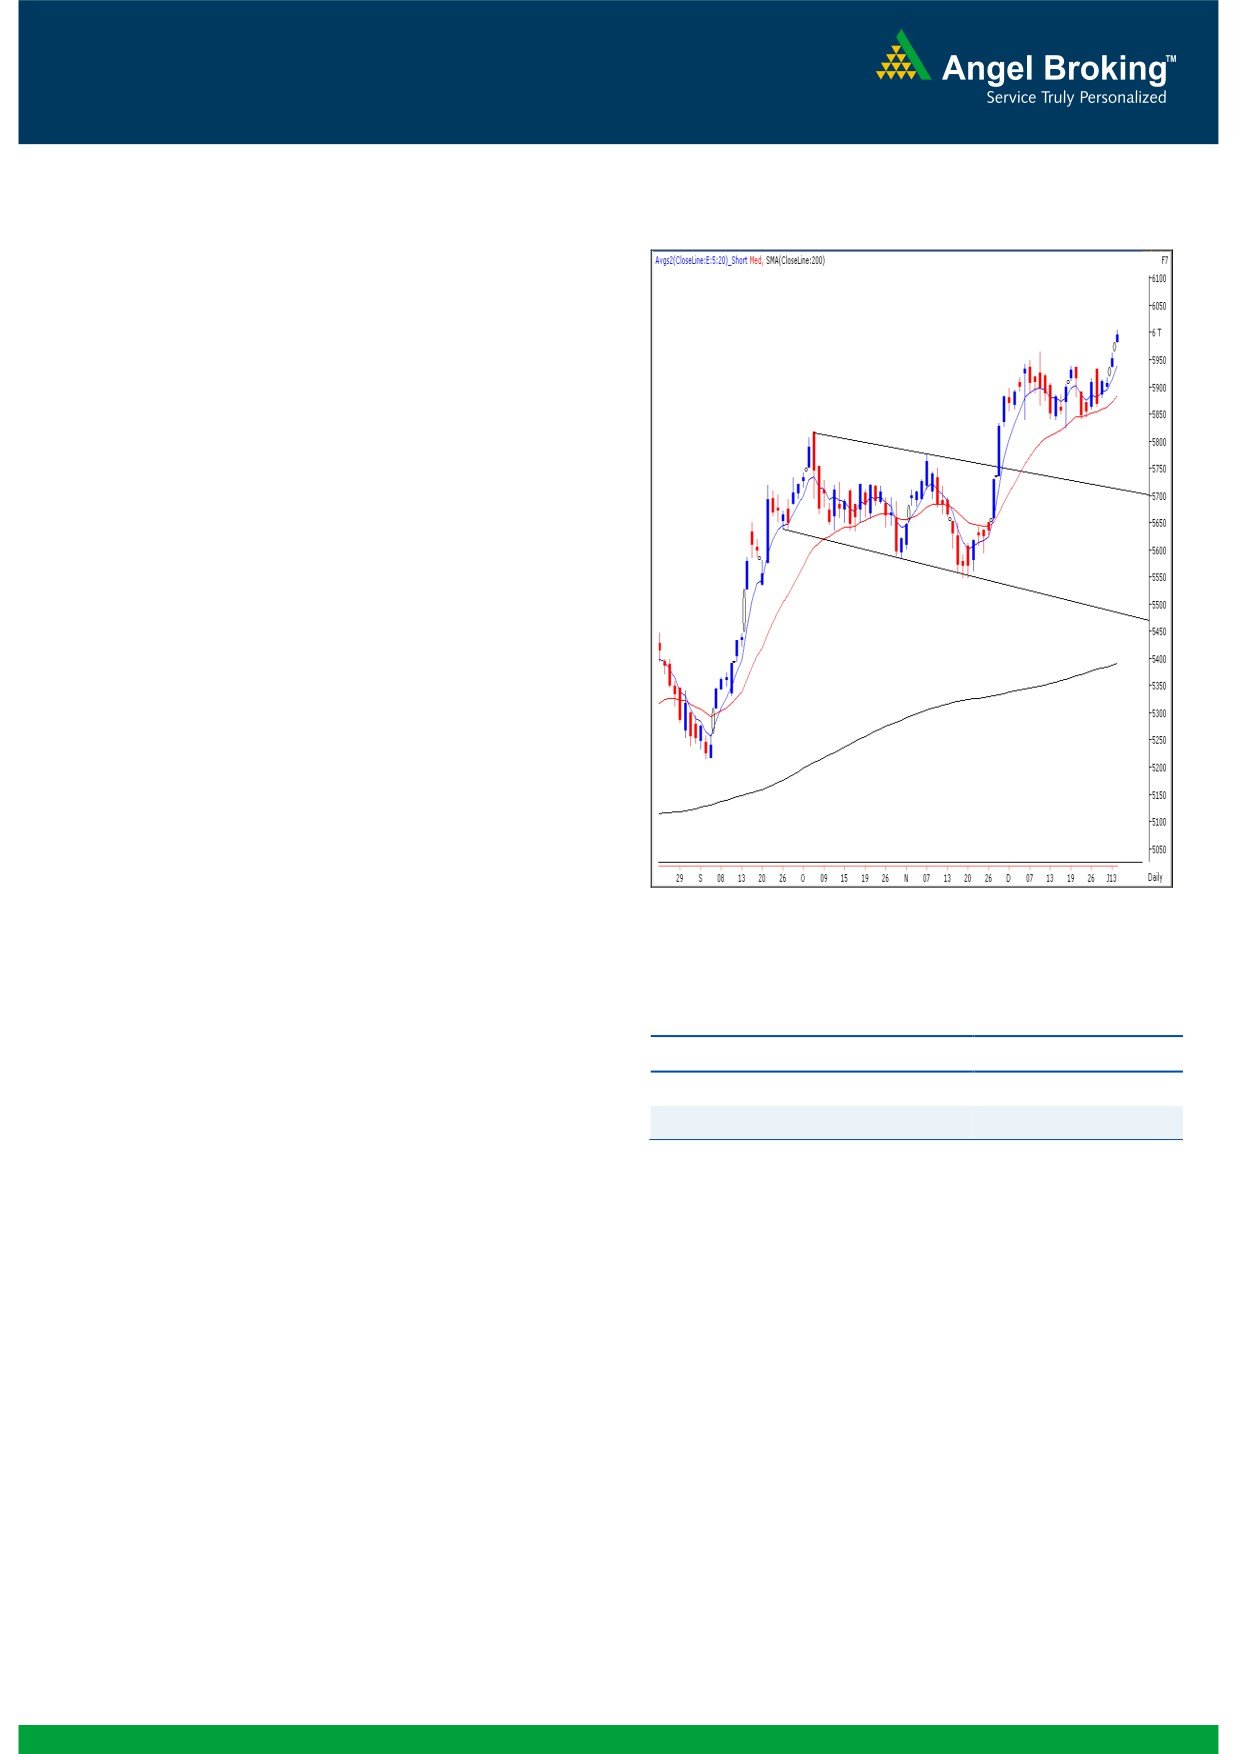
Exhibit 1: Nifty Daily Chart
Sensex (19714) / NIFTY (5993)
Yesterday, once again indices opened with an upside gap
and then traded in narrow range throughout the session.
Almost all the sectors ended in the positive territory, except
the FMCG and IT sectors which ended with very nominal
loss. Out of all the positive sectors, the Consumer Durables,
Capital Goods and Oil & Gas sectors have outperformed
during the session. The advance to decline ratio was strongly
in favor of advancing counters (A=1797 D=1166) (Source -
Formation
The ’20-day EMA’ and the ’20-week EMA’ are placed at
19346 / 5883 and 18740 / 5693 levels, respectively.
On the weekly chart, we are witnessing a breakout from
‘Downward Sloping Trend Line’ joining two significant
swing highs of 19811 / 5944 (April 2011) and 19137 /
5815 (Oct 2012) at 19050 / 5800 level.
The 38.20% and 50% Fibonacci retracement levels of
the rise from 18255 / 5548 (low on November 20,
2012) to 19612 / 5965 (high on December 11, 2012)
are at 19100 - 18930 / 5806 - 5755, respectively.
Source: Falcon:
Trading strategy:
For the second consecutive session we witnessed a gap up
Actionable points:
opening in our market. Yesterday’s session was the replica of
Tuesday’s session as indices opened higher and then traded
View for the day
Positive above 6006
in a narrow range and the upside gap remained intact. In
Expected targets
6025 - 6070
the process, indices have finally broken out from the
Support Levels
5935 - 5919
previously mentioned trading range of 19613 / 5965 -
19149 / 5823. Also in line with our expectations, the Nifty
met with our immediate target of 6000 during the session.
Going forward, considering the optimism across the globe,
we see a possibility of the Nifty moving towards 6070 if it
manages to sustain above yesterday’s high of
6006.
Conversely, 19687 - 19624 / 5982 - 5960 levels may now
provide decent support in coming trading session.
1
Daily Technical Report
January 03, 2013
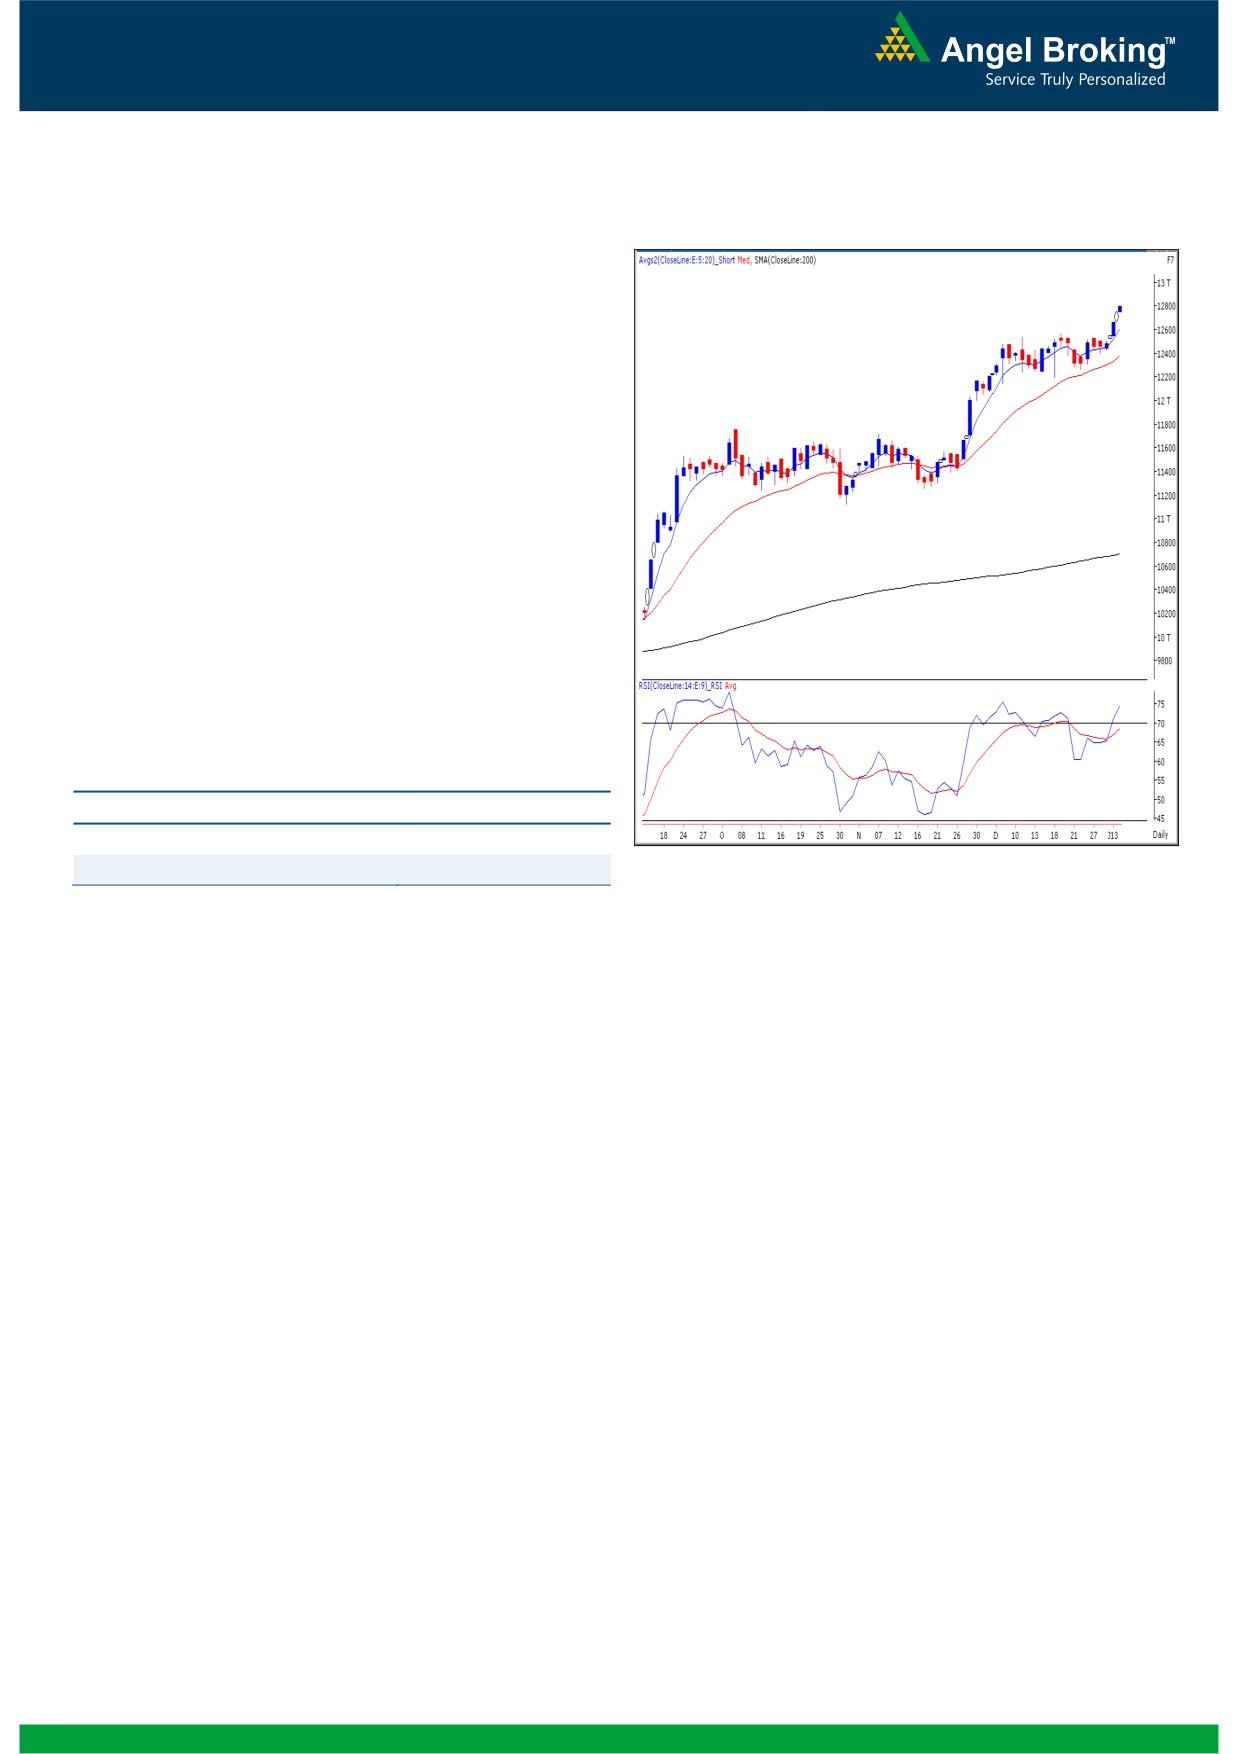
Exhibit 2: Bank Nifty Daily Chart
Bank Nifty Outlook - (12787)
Yesterday In line with our benchmark indices, the Bank Nifty
too traded with a strong positive bias and closed with more
than a percent gain, marginally below the 12800 mark.
Yesterday Bank Nifty almost tested the mentioned target of
12827 and later on consolidated in a narrow range during
the second half of the session. Going forward, if the index
trades and sustain above the 12827 level then we may
witness further rally towards the 13000 mark. Although the
bias remains positive, since the momentum oscillators on the
hourly chart are in overbought condition, a consolidation or a
minor pullback from current levels cannot be ruled out. In this
scenario, yesterday’s gap area of 12749 - 12664 may act as
support for the day.
Actionable points:
View for the day
Neutral
Resistance Levels
12827 - 13000
Source: Falcon:
Support Levels
12749 - 12664
2
Daily Technical Report
January 03, 2013
Research Team Tel: 022 - 39357800
DISCLAIMER
This document is solely for the personal information of the recipient, and must not be singularly used as the basis of any investment
decision. Nothing in this document should be construed as investment or financial advice. Each recipient of this document should make
such investigations as they deem necessary to arrive at an independent evaluation of an investment in the securities of the companies
referred to in this document (including the merits and risks involved), and should consult their own advisors to determine the merits and
risks of such an investment.
Angel Broking Limited, its affiliates, directors, its proprietary trading and investment businesses may, from time to time, make
investment decisions that are inconsistent with or contradictory to the recommendations expressed herein. The views contained in this
document are those of the analyst, and the company may or may not subscribe to all the views expressed within.
Reports based on technical and derivative analysis center on studying charts of a stock's price movement, outstanding positions and
trading volume, as opposed to focusing on a company's fundamentals and, as such, may not match with a report on a company's
fundamentals.
The information in this document has been printed on the basis of publicly available information, internal data and other reliable
sources believed to be true, but we do not represent that it is accurate or complete and it should not be relied on as such, as this
document is for general guidance only. Angel Broking Limited or any of its affiliates/ group companies shall not be in any way
responsible for any loss or damage that may arise to any person from any inadvertent error in the information contained in this report.
Angel Broking Limited has not independently verified all the information contained within this document. Accordingly, we cannot testify,
nor make any representation or warranty, express or implied, to the accuracy, contents or data contained within this document. While
Angel Broking Limited endeavours to update on a reasonable basis the information discussed in this material, there may be regulatory,
compliance, or other reasons that prevent us from doing so.
This document is being supplied to you solely for your information, and its contents, information or data may not be reproduced,
redistributed or passed on, directly or indirectly.
Angel Broking Limited and its affiliates may seek to provide or have engaged in providing corporate finance, investment banking or
other advisory services in a merger or specific transaction to the companies referred to in this report, as on the date of this report or in
the past.
Neither Angel Broking Limited, nor its directors, employees or affiliates shall be liable for any loss or damage that may arise from or in
connection with the use of this information.
Note: Please refer to the important `Stock Holding Disclosure' report on the Angel website (Research Section). Also, please refer to the
latest update on respective stocks for the disclosure status in respect of those stocks. Angel Broking Limited and its affiliates may have
investment positions in the stocks recommended in this report.
Research Team
Shardul Kulkarni
-
Head - Technicals
Sameet Chavan
-
Technical Analyst
Sacchitanand Uttekar
-
Technical Analyst
Mehul Kothari
-
Technical Analyst
Ankur Lakhotia
-
Technical Analyst
Angel Broking Pvt. Ltd.
Registered Office: G-1, Ackruti Trade Centre, Rd. No. 7, MIDC, Andheri (E), Mumbai - 400 093.
Corporate Office: 6th Floor, Ackruti Star, MIDC, Andheri (E), Mumbai - 400 093. Tel: (022) 3952 6600
Sebi Registration No: INB 010996539
4