Daily Technical Report
May 02, 2013
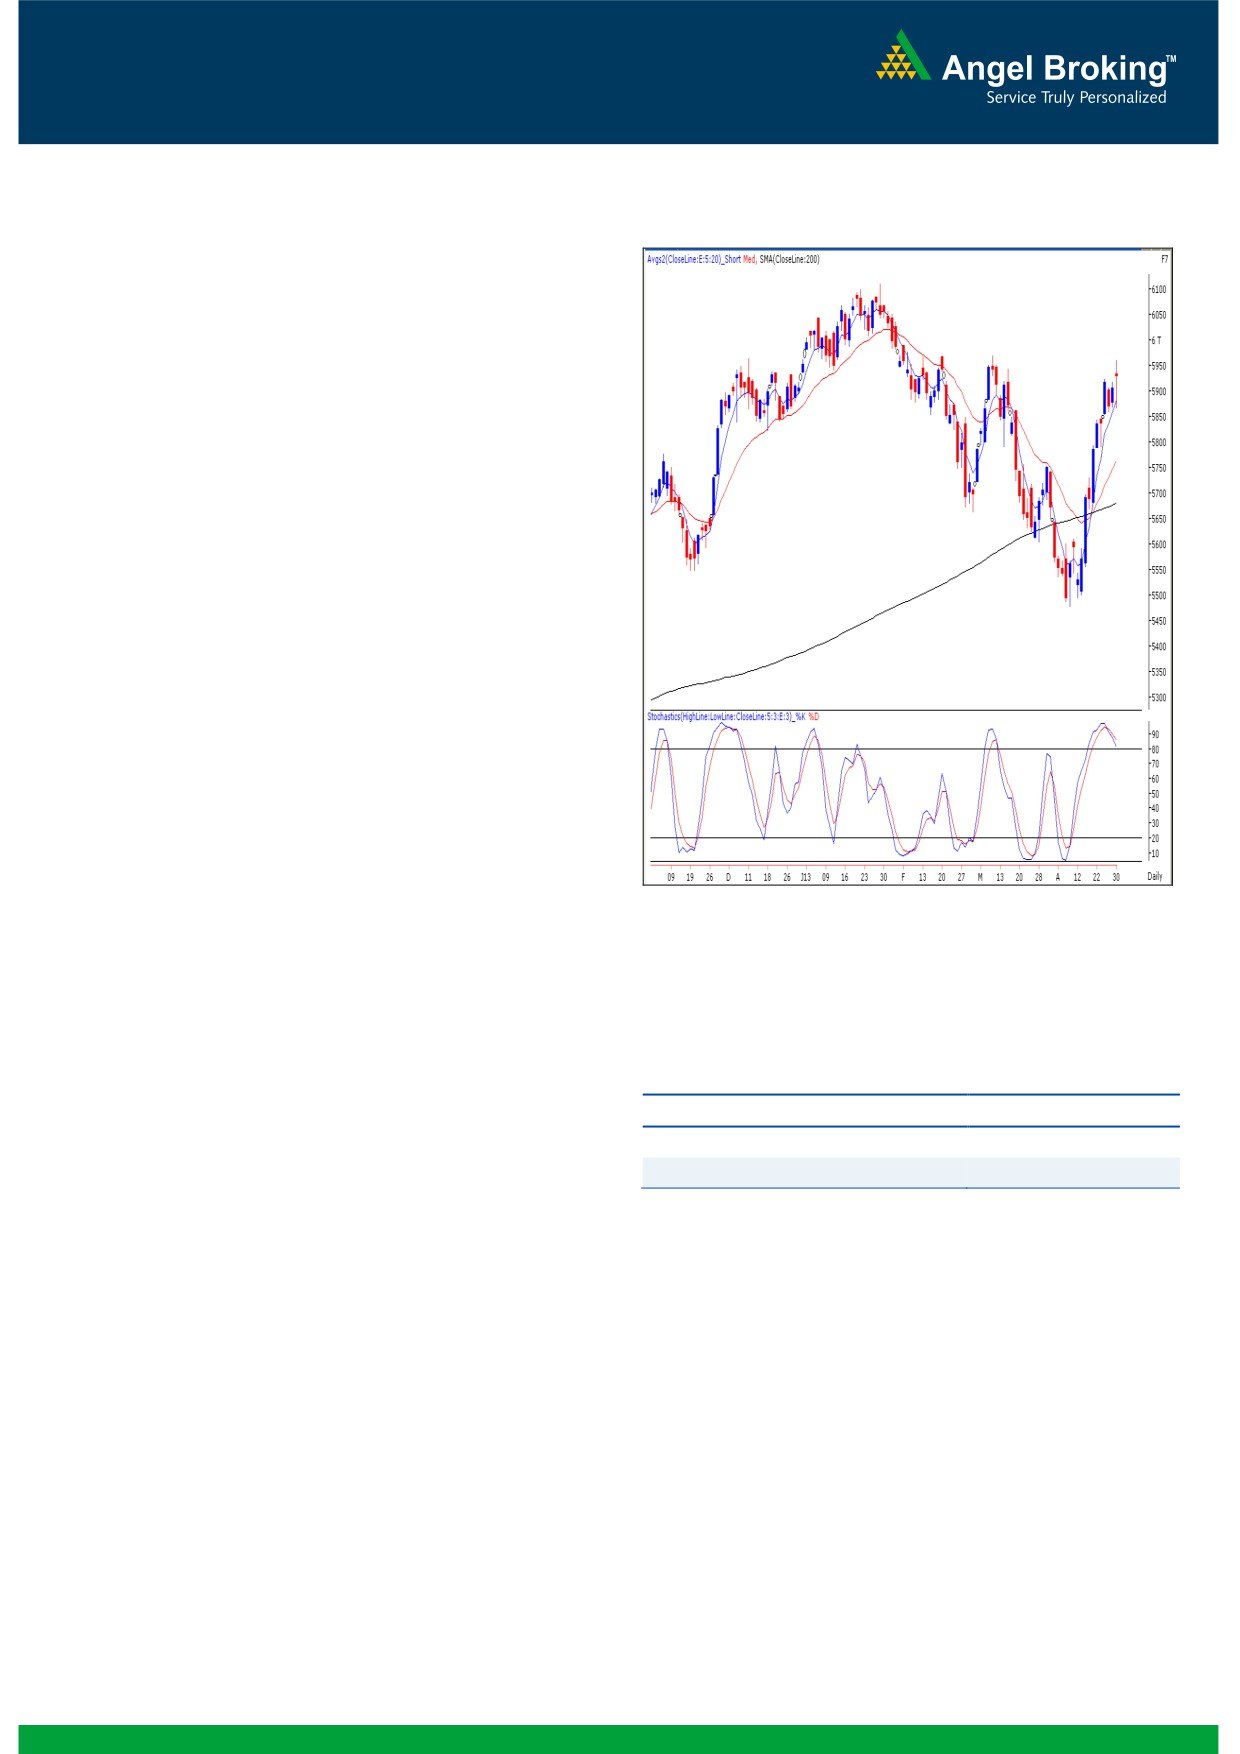
Exhibit 1: Nifty Daily Chart
Sensex (19504) / NIFTY (5930)
On Tuesday, indices opened with nearly half a percent
upside gap on the back of the Hindustan Unilever purchase
offer. However, post the initial hour of trade Indices
corrected sharply from the day’s high to register a low of
19317 / 5867. A decent recovery towards the fag end led
indices to eventually close in the positive territory. For the
session most of the sectors ended in the green, amongst
which FMCG and Metal counters were among the major
gainers, whereas Realty and Banking stocks ended with
loses. The advance to decline ratio was in favor of declining
Formation
The ’20-week EMA’ and the ’20-day EMA’ are placed at
19083/ 5783 and 19001/ 5764 levels, respectively.
The ‘Lower Top - Lower Bottom’ formation on the weekly
chart is still intact.
The 61.8% and 78.6% Fibonacci retracement levels of
the fall from 20204 / 6112 to 18144 / 5477 are placed
Source: Falcon:
at 19416 / 5870 and 19765 / 5976.
Trading strategy:
Actionable points:
On Tuesday, our benchmark indices opened higher; but the
optimism was very short lived as indices came off the day’s
View
Bearish Below 5867
high and slipped inside the negative territory. The daily chart
Expected Target
5791 - 5760
candlestick pattern now resembles a ‘Long Legged Doji’. The
Resistance Levels
5971
said pattern signifies uncertainty when it occurs at an
important resistance level. Hence, any sustainable move
below Tuesday’s low of 19317 / 5867 would result in near
term pessimism in the market. As a result, indices may slide
towards the next support level of 19225 - 18941 / 5791 -
5760. On the higher side, a strong resistance level remains
at 19762 / 5976.
1
Daily Technical Report
May 02, 2013
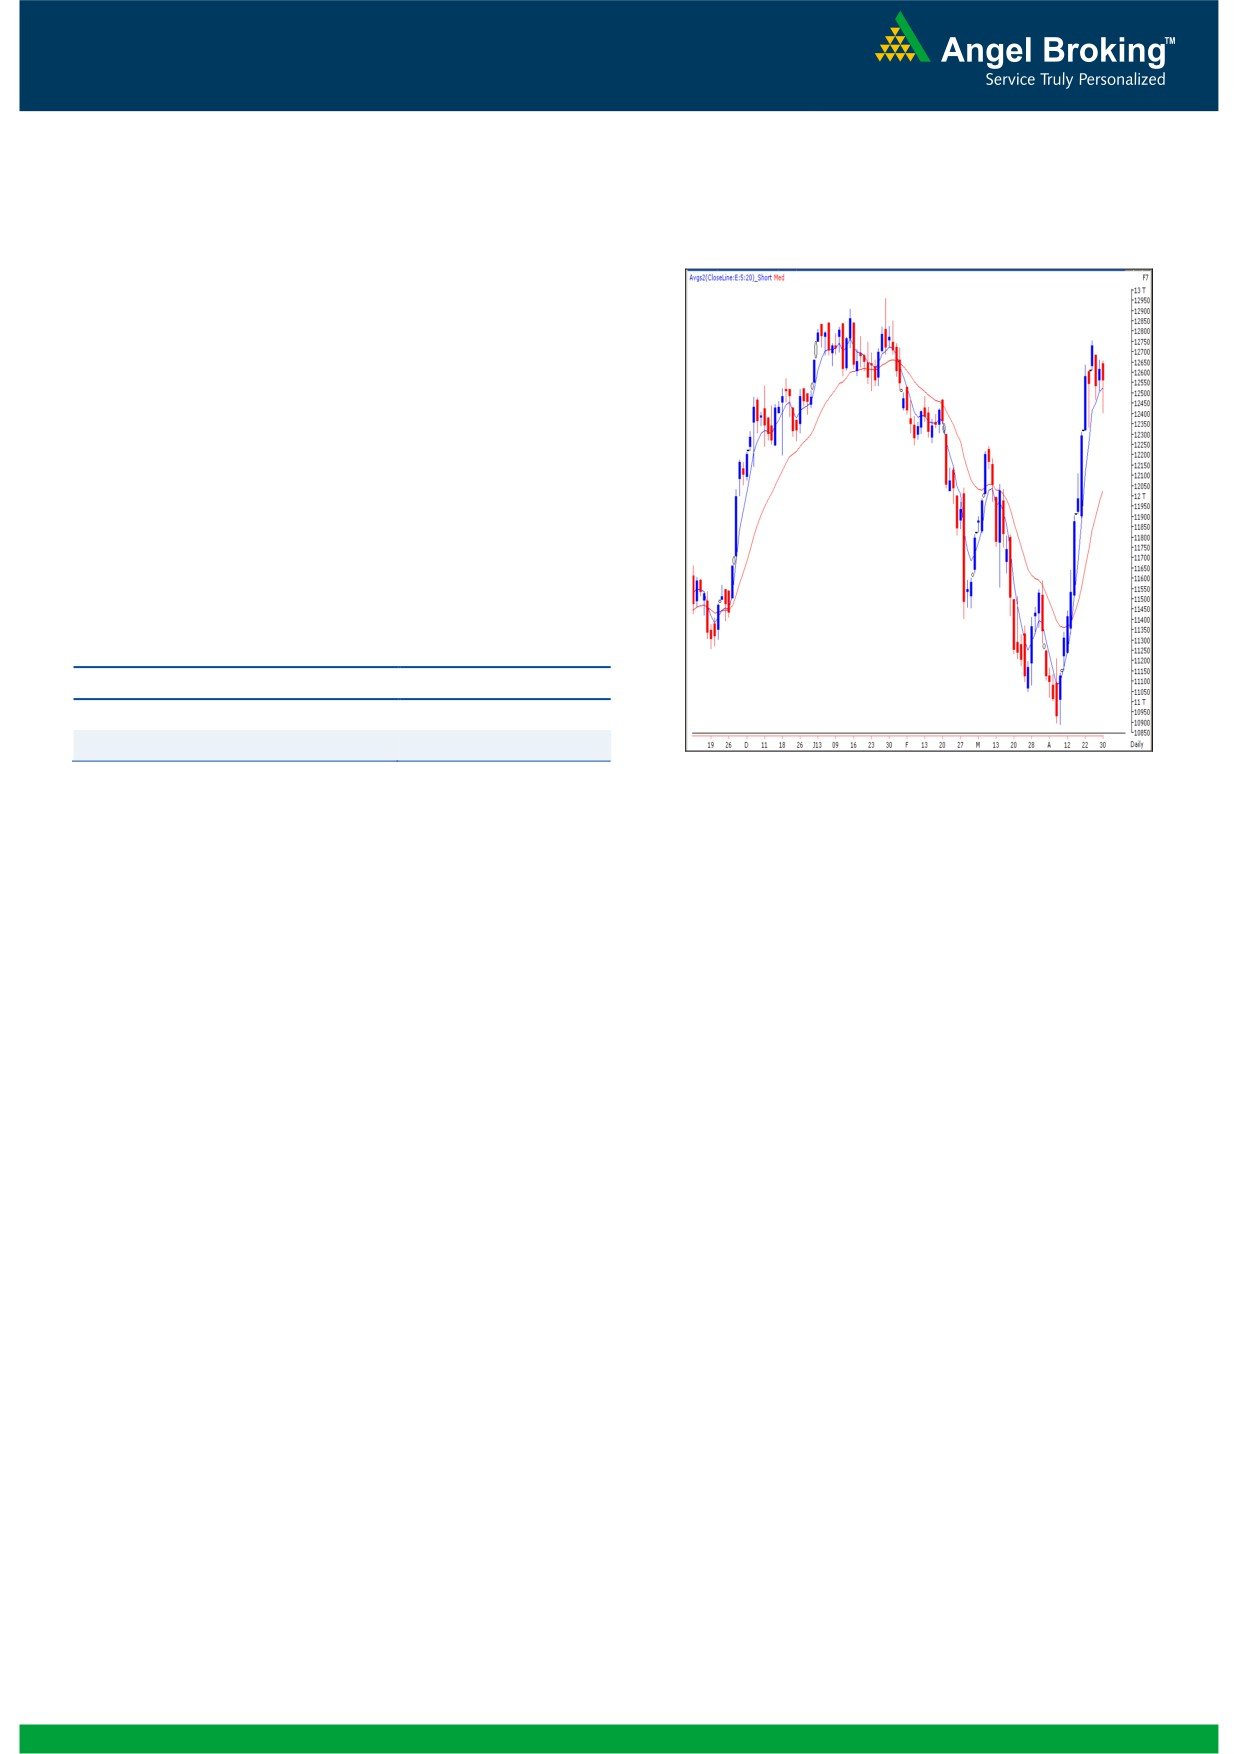
Exhibit 2: Bank Nifty Daily Chart
Bank Nifty Outlook - (12562)
On Tuesday, Bank Nifty opened on a flat note unlike our
benchmark indices and traded with extreme volatility
throughout the session to close with a loss of 0.38%. From
the past few sessions we are witnessing that the index is
trading in a narrow range of 12330 - 12680. Only a break
of the mentioned range on either side will trigger strong
move in Bank Nifty. In view of the ‘RBI’ monetary policy on
Friday we expect the index to be highly volatile over the next
two sessions. Thus, traders are advised to trade with strict
stop losses.
Actionable points:
View
Neutral
Resistance levels
12680
Support Levels
12330
Source: Falcon:
2
Daily Technical Report
May 02, 2013
Research Team Tel: 022 - 30940000
DISCLAIMER
This document is solely for the personal information of the recipient, and must not be singularly used as the basis of any investment
decision. Nothing in this document should be construed as investment or financial advice. Each recipient of this document should make
such investigations as they deem necessary to arrive at an independent evaluation of an investment in the securities of the companies
referred to in this document (including the merits and risks involved), and should consult their own advisors to determine the merits and
risks of such an investment.
Angel Broking Limited, its affiliates, directors, its proprietary trading and investment businesses may, from time to time, make
investment decisions that are inconsistent with or contradictory to the recommendations expressed herein. The views contained in this
document are those of the analyst, and the company may or may not subscribe to all the views expressed within.
Reports based on technical and derivative analysis center on studying charts of a stock's price movement, outstanding positions and
trading volume, as opposed to focusing on a company's fundamentals and, as such, may not match with a report on a company's
fundamentals.
The information in this document has been printed on the basis of publicly available information, internal data and other reliable
sources believed to be true, but we do not represent that it is accurate or complete and it should not be relied on as such, as this
document is for general guidance only. Angel Broking Limited or any of its affiliates/ group companies shall not be in any way
responsible for any loss or damage that may arise to any person from any inadvertent error in the information contained in this report.
Angel Broking Limited has not independently verified all the information contained within this document. Accordingly, we cannot testify,
nor make any representation or warranty, express or implied, to the accuracy, contents or data contained within this document. While
Angel Broking Limited endeavors to update on a reasonable basis the information discussed in this material, there may be regulatory,
compliance, or other reasons that prevent us from doing so.
This document is being supplied to you solely for your information, and its contents, information or data may not be reproduced,
redistributed or passed on, directly or indirectly.
Angel Broking Limited and its affiliates may seek to provide or have engaged in providing corporate finance, investment banking or
other advisory services in a merger or specific transaction to the companies referred to in this report, as on the date of this report or in
the past.
Neither Angel Broking Limited, nor its directors, employees or affiliates shall be liable for any loss or damage that may arise from or in
connection with the use of this information.
Note: Please refer to the important `Stock Holding Disclosure' report on the Angel website (Research Section). Also, please refer to the
latest update on respective stocks for the disclosure status in respect of those stocks. Angel Broking Limited and its affiliates may have
investment positions in the stocks recommended in this report.
Research Team
Shardul Kulkarni
-
Head - Technicals
Sameet Chavan
-
Technical Analyst
Sacchitanand Uttekar
-
Technical Analyst
Ankur Lakhotia
-
Technical Analyst
Angel Broking Pvt. Ltd.
Registered Office: G-1, Ackruti Trade Centre, Rd. No. 7, MIDC, Andheri (E), Mumbai - 400 093.
Corporate Office: 6th Floor, Ackruti Star, MIDC, Andheri (E), Mumbai - 400 093. Tel: (022) 30940000
Sebi Registration No: INB 010996539
4