Daily Technical Report
November 01, 2012
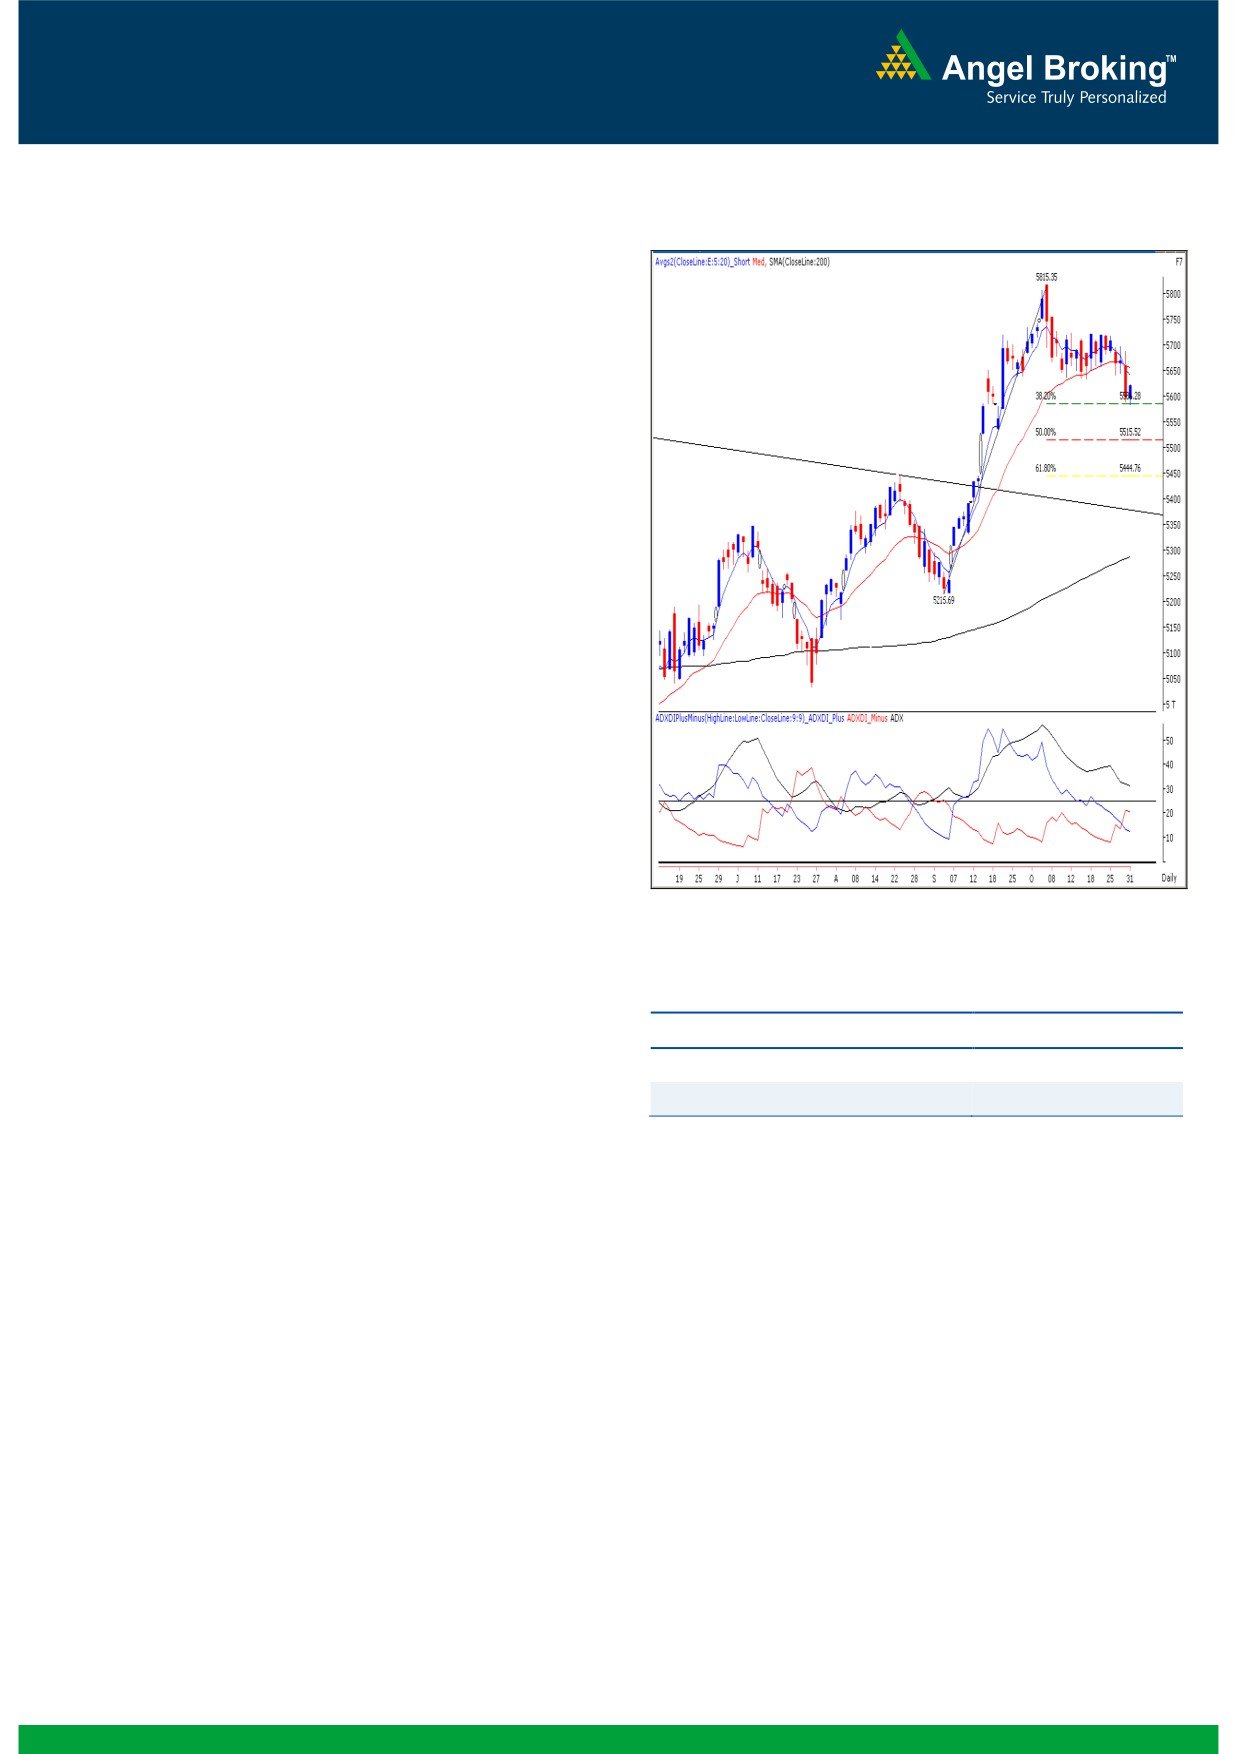
Exhibit 1: Nifty Daily Chart
Sensex (18505) / NIFTY (5620)
Yesterday, once again indices opened flat and tested the
mentioned support level of 18400 / 5589 in the first half of
the session. However, buying interest in banking, pharma
and few metal stocks in the later half led the indices to close
in green above 5600 mark. Sectors like Healthcare, Auto
and Realty were among the major gainers. FMCG, Oil &
Gas and Consumer Goods counters remained under
pressure during yesterday’s trading session. The advance to
decline ratio was in favor of advancing counters (A=1483
Formation
The ’20-day EMA’ and the ’20-week EMA’ are placed at
18650 / 5667 and 17986 / 5456 levels, respectively.
The monthly ‘RSI’ oscillator is moving higher from the 50
mark and the positive in the ADX (9) indicator is intact.
The negative crossover in the weekly ‘Stochastic’
oscillator is still intact.
The 38.2% and 50% Fibonacci Retracement levels of the
rise from 17250 to 19138 / 5216 to 5815 are placed at
Source: Falcon:
18416 / 5586 and 18194 / 5515, respectively.
Trading strategy:
Actionable points:
Yesterday, our benchmark indices gained strength in the
later half and managed to close on positive note. On
View for the day
Bearish below 5583
technical front, this was mainly due to the ‘Positive
Expected targets
5550 - 5515
Divergence’ in ‘RSI’ momentum oscillator on the hourly
Resistance levels
5624 - 5649
chart. At this juncture, we are witnessing that yesterday,
indices faced resistance near hourly ’20 EMA’. In addition,
the negative crossover in daily ‘5 & 20 EMA’ and the ADX (9)
indicator mentioned in our previous report are still intact.
Hence, going forward the short term pessimism in the
market could continue if indices sustain below yesterday’s
low of 18398 / 5583. In this scenario, indices may slide
towards 18194 / 5515 level, which is the 50% Fibonacci
Retracement level of the rise from 17250 to 19138 / 5216 to
5815 levels. On the upside, 18522 - 18594 / 5624 - 5649
levels would now act as resistance in coming trading
sessions.
1
Daily Technical Report
November 01, 2012
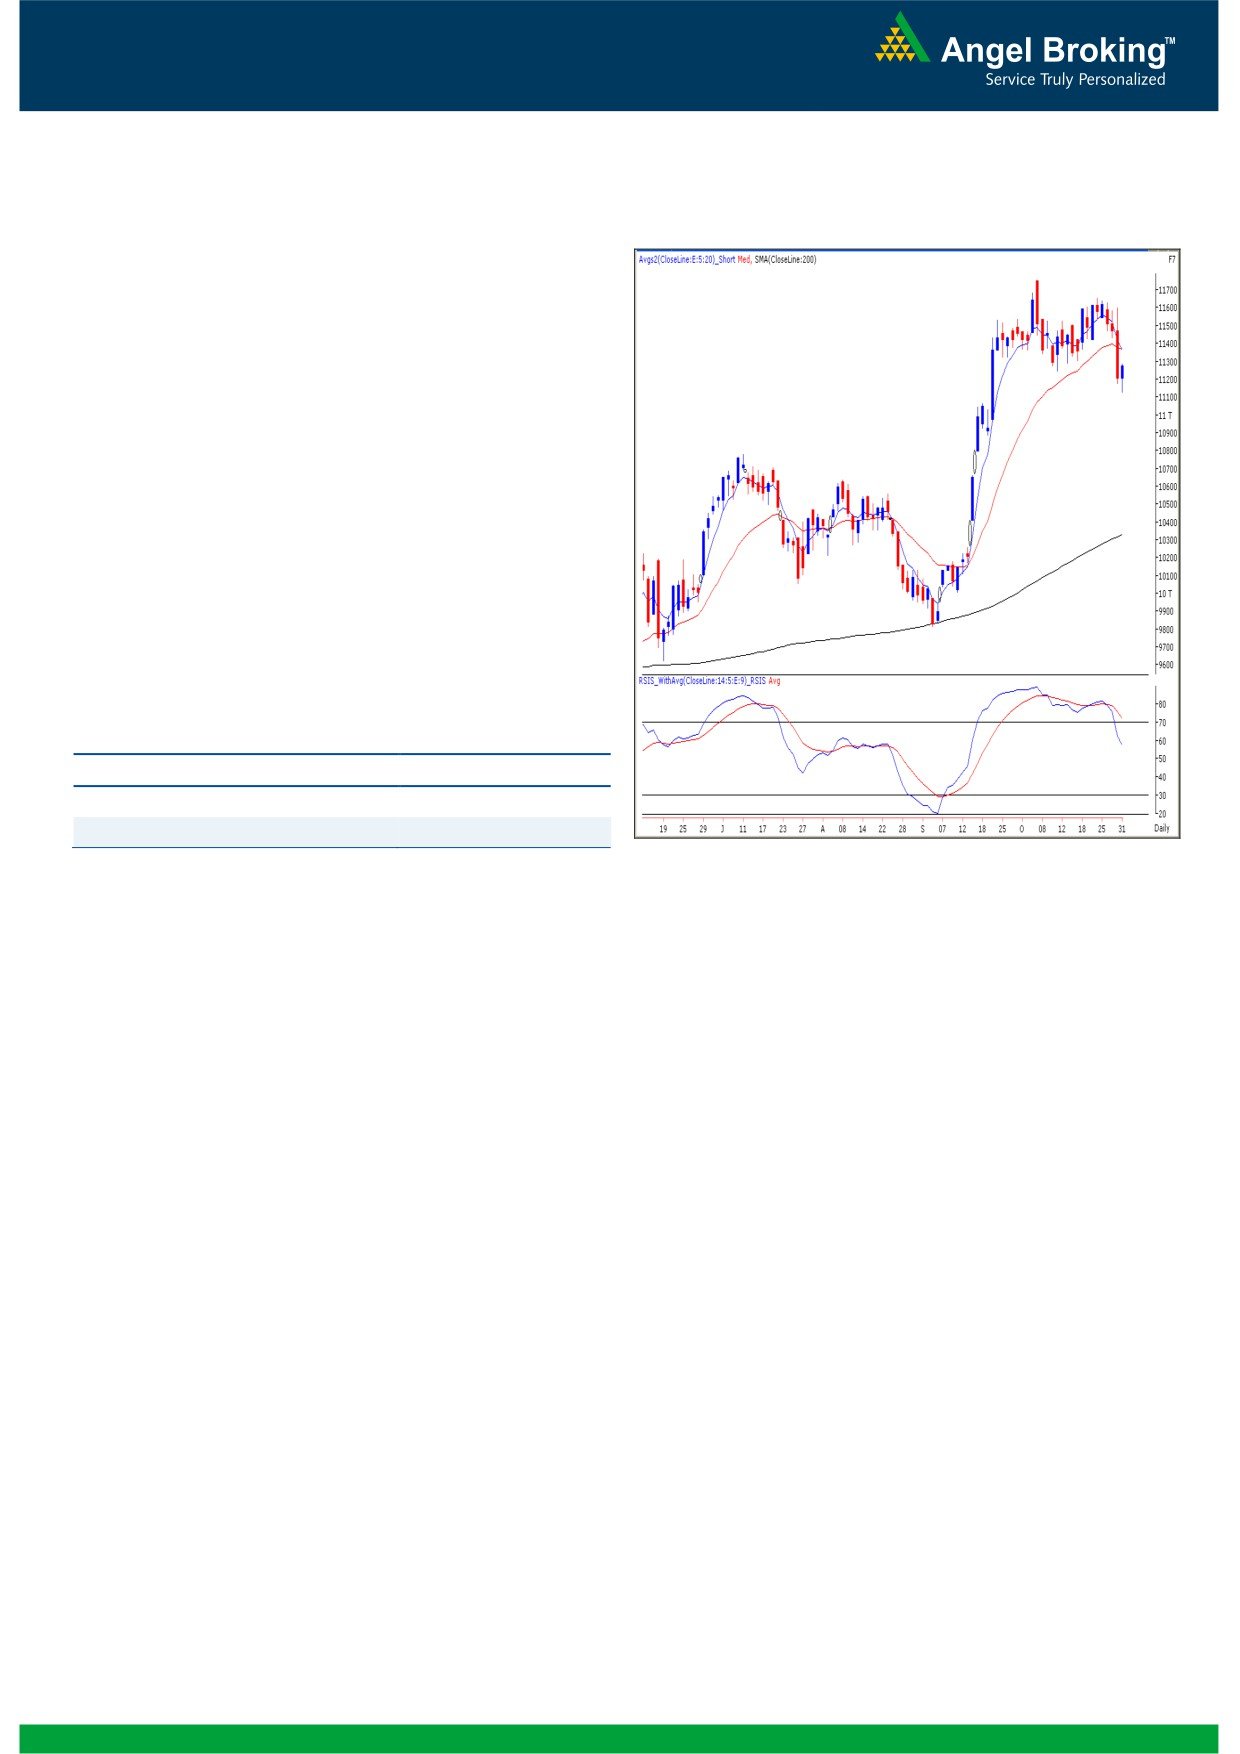
Exhibit 2: Bank Nifty Daily Chart
Bank Nifty Outlook - (11269)
Yesterday, Bank Nifty opened on a flat note and yet again
traded in a narrow range throughout the session. As
expected the index consolidated after Tuesday’s fall. The
momentum oscillators on the daily chart continue with
their sell signal. However we are witnessing a positive
crossover in “RSI- Smoothened” oscillator on the hourly
chart. Hence, we expect the index to further consolidate in
the early part of today’s session. On the upside 11328 -
11391 levels are likely to act as resistance and 11163 -
11125 levels are likely to act as support levels for the day.
A fall below 11125 may trigger a further downside and
the Index may then test the11000 mark.
Actionable points:
View for the day
Neutral
Resistance Levels
11328 - 11391
Support Levels
11163 - 11125
Source: Falcon:
2
Daily Technical Report
November 01, 2012
Research Team Tel: 022 - 39357800
DISCLAIMER
This document is solely for the personal information of the recipient, and must not be singularly used as the basis of any investment
decision. Nothing in this document should be construed as investment or financial advice. Each recipient of this document should make
such investigations as they deem necessary to arrive at an independent evaluation of an investment in the securities of the companies
referred to in this document (including the merits and risks involved), and should consult their own advisors to determine the merits and
risks of such an investment.
Angel Broking Limited, its affiliates, directors, its proprietary trading and investment businesses may, from time to time, make
investment decisions that are inconsistent with or contradictory to the recommendations expressed herein. The views contained in this
document are those of the analyst, and the company may or may not subscribe to all the views expressed within.
Reports based on technical and derivative analysis center on studying charts of a stock's price movement, outstanding positions and
trading volume, as opposed to focusing on a company's fundamentals and, as such, may not match with a report on a company's
fundamentals.
The information in this document has been printed on the basis of publicly available information, internal data and other reliable
sources believed to be true, but we do not represent that it is accurate or complete and it should not be relied on as such, as this
document is for general guidance only. Angel Broking Limited or any of its affiliates/ group companies shall not be in any way
responsible for any loss or damage that may arise to any person from any inadvertent error in the information contained in this report.
Angel Broking Limited has not independently verified all the information contained within this document. Accordingly, we cannot testify,
nor make any representation or warranty, express or implied, to the accuracy, contents or data contained within this document. While
Angel Broking Limited endeavours to update on a reasonable basis the information discussed in this material, there may be regulatory,
compliance, or other reasons that prevent us from doing so.
This document is being supplied to you solely for your information, and its contents, information or data may not be reproduced,
redistributed or passed on, directly or indirectly.
Angel Broking Limited and its affiliates may seek to provide or have engaged in providing corporate finance, investment banking or
other advisory services in a merger or specific transaction to the companies referred to in this report, as on the date of this report or in
the past.
Neither Angel Broking Limited, nor its directors, employees or affiliates shall be liable for any loss or damage that may arise from or in
connection with the use of this information.
Note: Please refer to the important `Stock Holding Disclosure' report on the Angel website (Research Section). Also, please refer to the
latest update on respective stocks for the disclosure status in respect of those stocks. Angel Broking Limited and its affiliates may have
investment positions in the stocks recommended in this report.
Research Team
Shardul Kulkarni
-
Head - Technicals
Sameet Chavan
-
Technical Analyst
Sacchitanand Uttekar
-
Technical Analyst
Mehul Kothari
-
Technical Analyst
Ankur Lakhotia
-
Technical Analyst
Angel Broking Pvt. Ltd.
Registered Office: G-1, Ackruti Trade Centre, Rd. No. 7, MIDC, Andheri (E), Mumbai - 400 093.
Corporate Office: 6th Floor, Ackruti Star, MIDC, Andheri (E), Mumbai - 400 093. Tel: (022) 3952 6600
Sebi Registration No: INB 010996539
4