Daily Technical Report
October 01, 2012
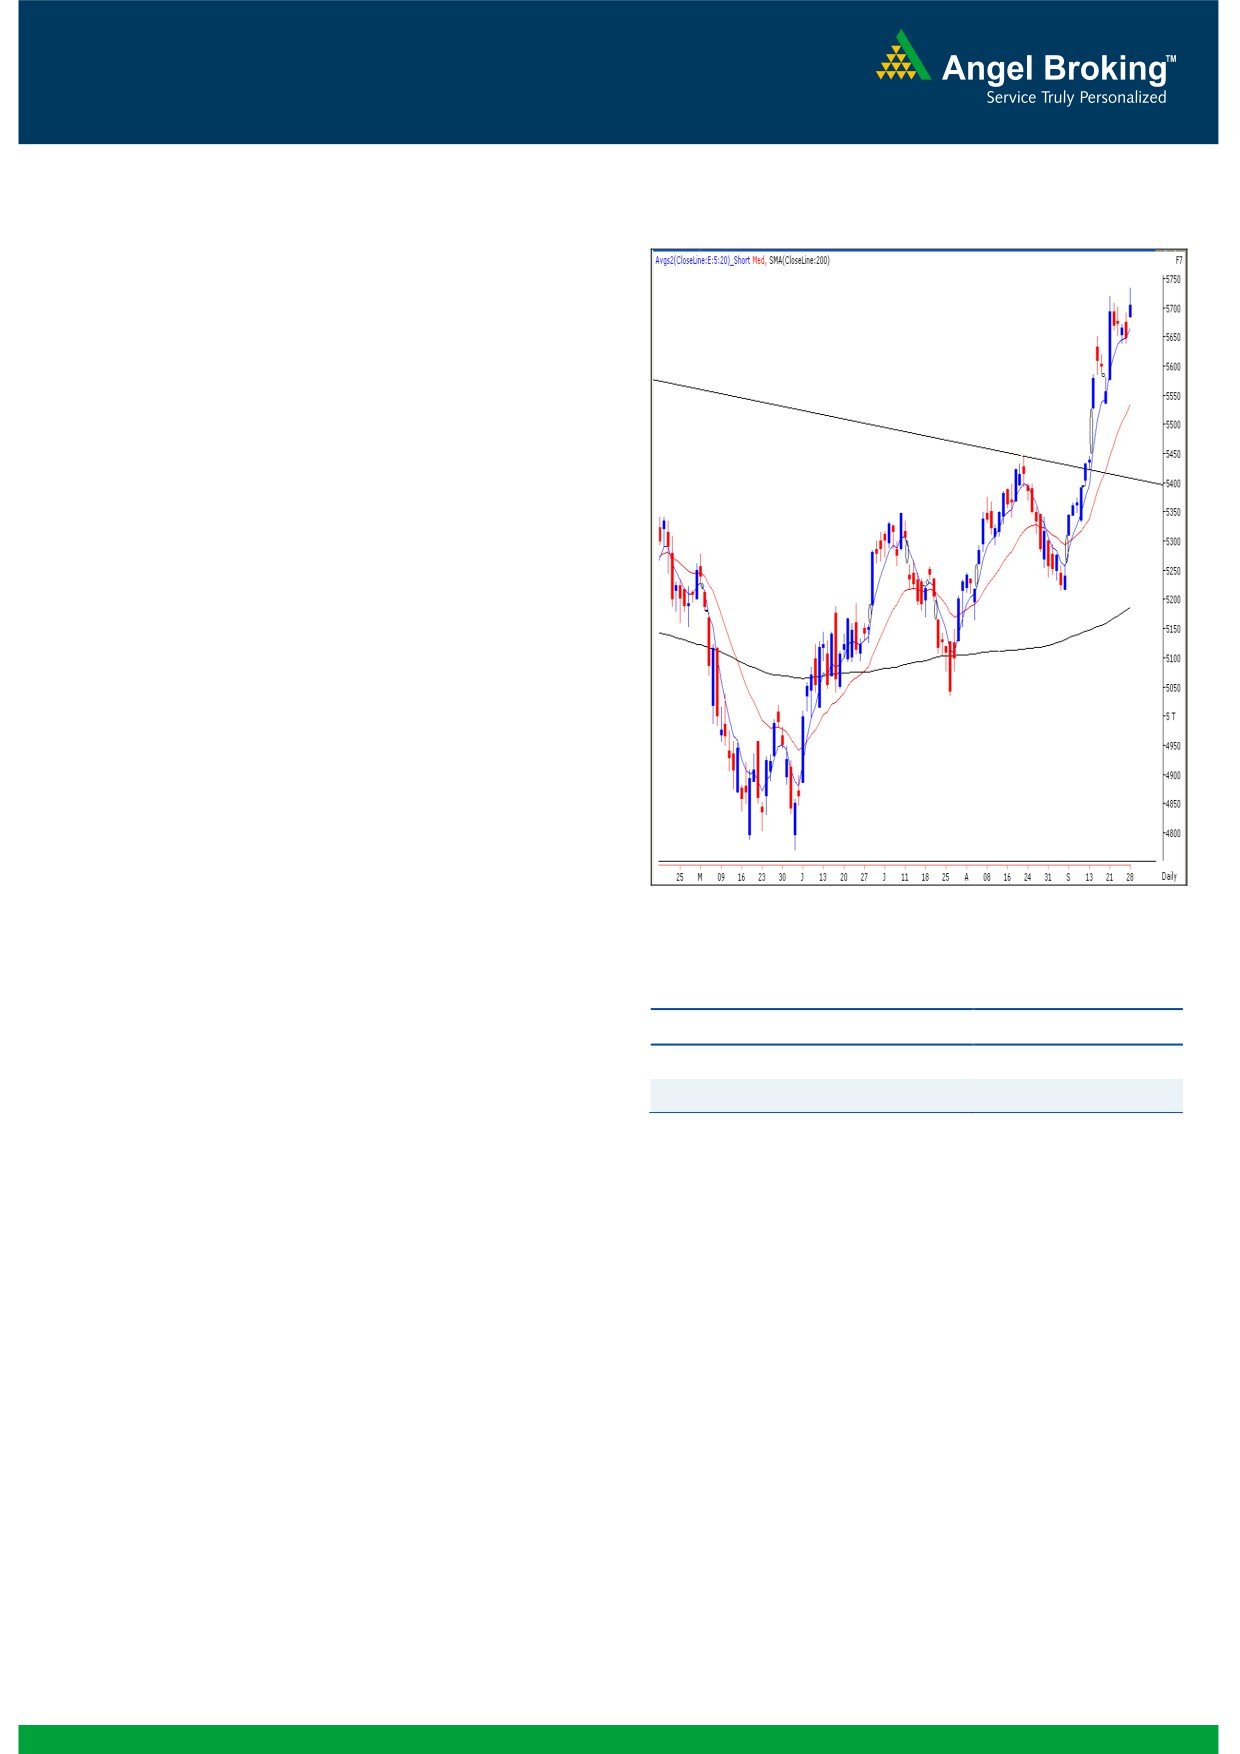
Exhibit 1: Nifty Daily Chart
Sensex (18763) / NIFTY (5703)
On Friday, the October series started on a positive note
where our benchmark indices closed above the psychological
5700 mark. The rally was mainly lead by Auto, Consumer
Durables and FMCG counters; whereas Realty was the only
sector in red. The action was mainly seen in the mid and
small cap stocks while the large caps remained relatively
subdued. The advance to decline ratio was in favor of
advancing counters (A=1644 D=1248) (Source
-
Formation
The ’20-day EMA’ and the ’20-week EMA’ are placed at
18265 / 5535 and 17625 / 5340 levels, respectively.
The monthly ‘RSI’ oscillator is moving higher from the 50
mark and the ADX (9) indicator is now signaling a
positive crossover.
The weekly chart depicts a ‘Narrow Range’ body
formation.
Source: Falcon:
Trading strategy:
Actionable points:
As mentioned in the previous report, this September turned
out to be a memorable month for the bulls. One interesting
View
Neutral
observation to note would be that the price action in August
Resistance Levels
5720 - 5741
- September 2012 is very much identical with the move seen
Support Levels
5630 - 5580
in August -September
2010. Considering this monthly
closing, we can now infer that the monthly 'RSI' indicator is
More the time spent in this range, more bullish will be the chart
now heading upwards from the 50 mark. In addition, the
structure. This phenomenon is called as a ‘Time wise
ADX (9) indicator has signaled a positive crossover. The
correction’ and in this phase market participants get
combination of these technical tools signifies that the bulls
accustomed to new levels. This in turn results in the initially
are gaining the upper hand and reasonable upside can be
anticipated higher levels, now getting converted into a new
expected in coming months. At this juncture, there is
Normal. We reiterate our view that once the indices move
practically no change in the price structure except that the
beyond 19132 / 5741, then our markets are likely to rally
markets have consumed time. This is clear from the fact that
towards the next possible target of 19542 - 19812 / 5850 -
the weekly chart depicts a 'Narrow Range' body formation.
5945 and even the possibility of testing 6000 (Nifty) cannot be
The Indices have strong support near to 18291/ 5534 level.
ruled out.
Any decline towards these levels will be an opportunity to
buy. Traders should take a note that confidence amongst the
We continue to advise that traders should target stock specific
bulls and the probability of a strong bullish up move is
moves and trade with strict stop losses.
directly proportional to the amount of time spent in the zone
of 18800 - 18291 / 5700 - 5534.
1
Daily Technical Report
October 01, 2012
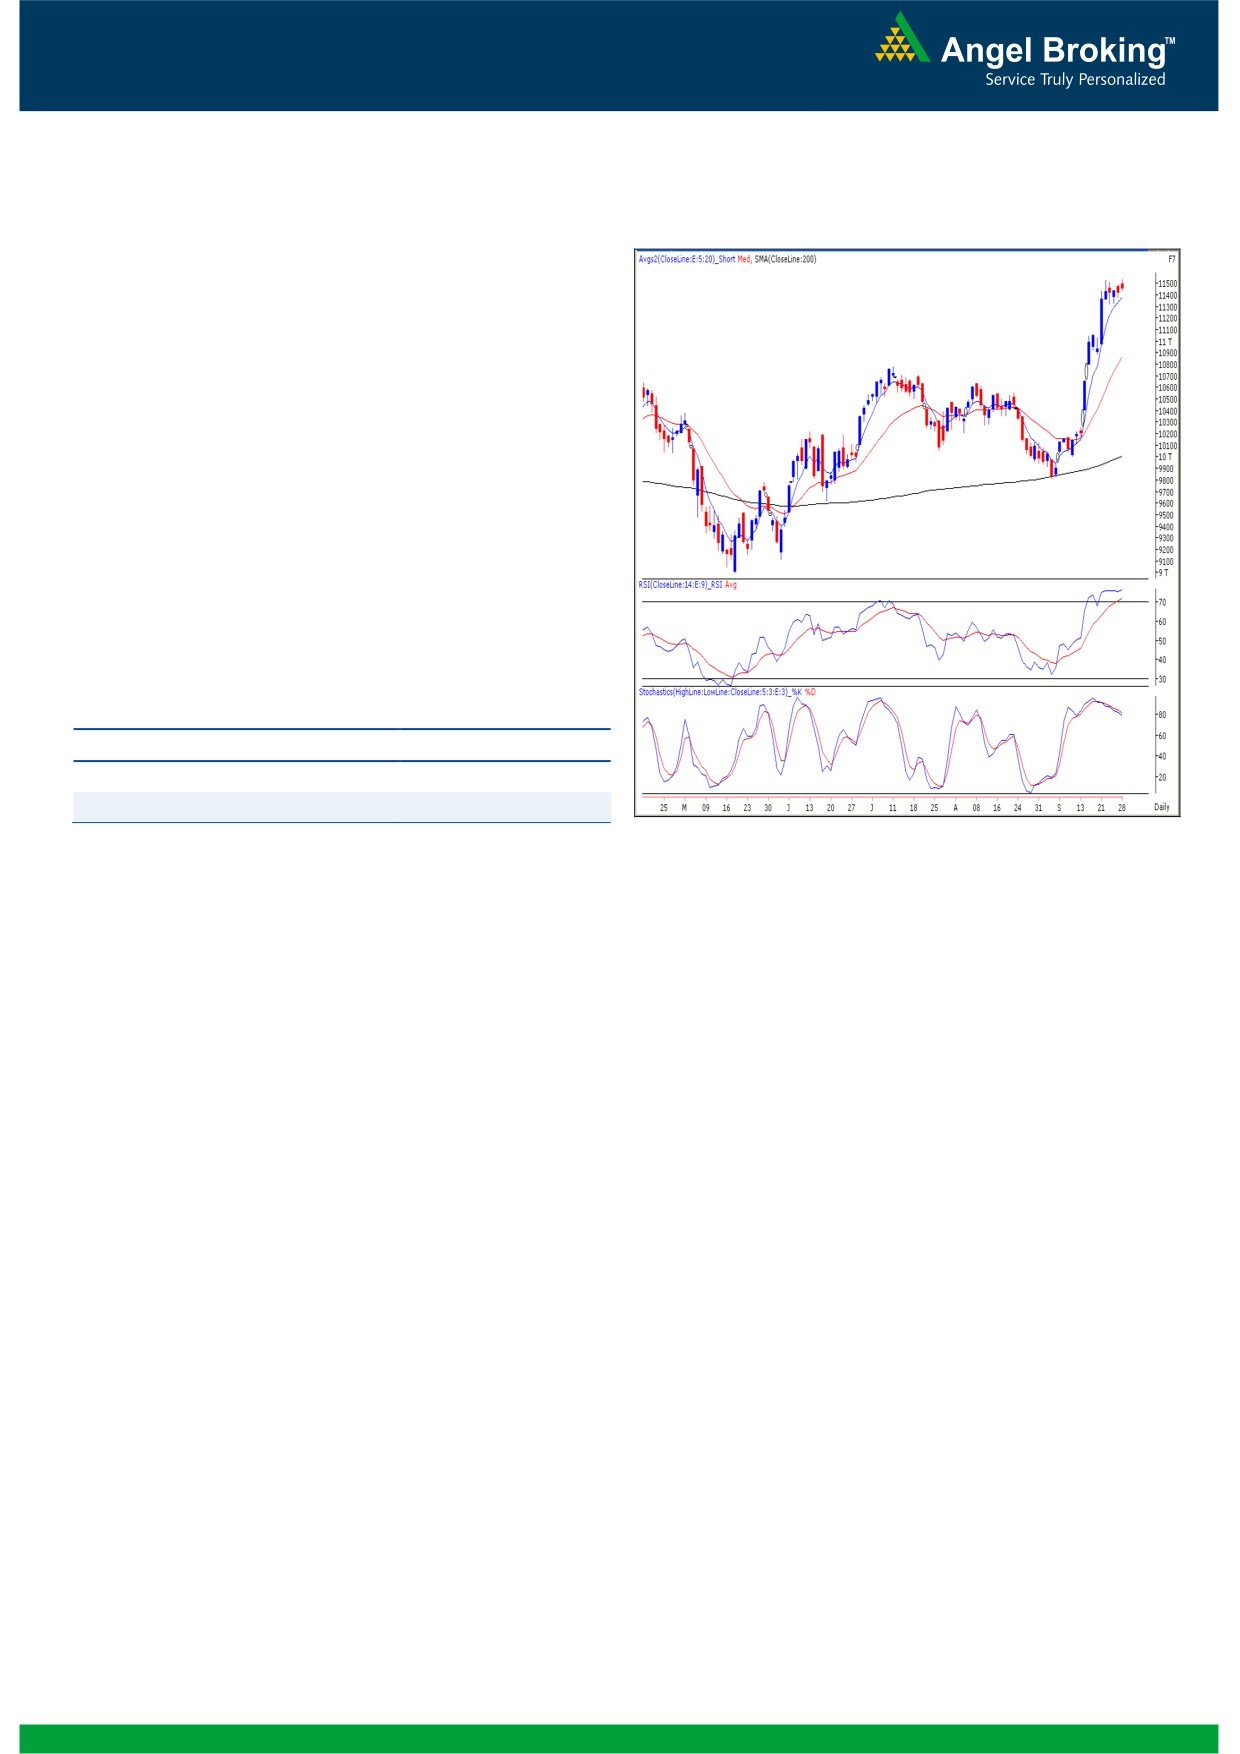
Exhibit 2: Bank Nifty Daily Chart
Bank Nifty Outlook - (11457)
The Bank Nifty opened on an optimistic note on Friday and
traded in a narrow range throughout the session. At this
juncture the index is constantly taking support near the
hourly “20 EMA”. Looking at the price structure on the daily
as well as hourly charts, it can be said that a clear direction
is likely to emerge only after the index move out of the zone
of 11537 - 11320 levels. On the upside, a strong breakout
beyond 11537 along with increasing volumes will indicate a
bullish “Flag” breakout. However, a breach of 11320 will
indicate that further consolidation (Time and Price wise
correction) is likely to continue. For the day, index has
support at 11438 level whereas resistance is at 11537.
Actionable points:
View
Neutral
Resistance Levels
11537
Support Levels
11320 - 11210
Source: Falcon:
2
Daily Technical Report
October 01, 2012
Daily Pivot Levels for Nifty 50 Stocks
SCRIPS
S2
S1
PIVOT
R1
R2
SENSEX
18,606
18,684
18,777
18,856
18,948
NIFTY
5,656
5,679
5,707
5,731
5,759
BANKNIFTY
11,378
11,418
11,477
11,516
11,576
ACC
1,426
1,448
1,463
1,485
1,500
AMBUJACEM
199
200
202
204
206
ASIANPAINT
3,867
3,901
3,934
3,967
4,000
AXISBANK
1,119
1,127
1,139
1,148
1,159
BAJAJ-AUTO
1,791
1,811
1,830
1,850
1,870
BANKBARODA
771
785
793
807
816
BHARTIARTL
260
263
265
268
270
BHEL
240
243
248
251
256
BPCL
337
343
351
356
364
CAIRN
326
329
332
334
337
CIPLA
359
369
376
386
393
COALINDIA
347
353
361
368
376
DLF
224
229
237
241
249
DRREDDY
1,613
1,629
1,641
1,657
1,668
GAIL
376
379
384
388
392
GRASIM
3,222
3,268
3,308
3,354
3,395
HCLTECH
564
571
579
586
594
HDFC
756
765
772
781
788
HDFCBANK
622
625
630
634
638
HEROMOTOCO
1,848
1,864
1,887
1,904
1,927
HINDALCO
116
118
120
123
124
HINDUNILVR
531
539
544
551
556
ICICIBANK
1,042
1,051
1,062
1,070
1,082
IDFC
150
152
156
159
163
INFY
2,493
2,514
2,547
2,568
2,601
ITC
264
268
270
275
277
JINDALSTEL
414
421
432
439
450
JPASSOCIAT
80
81
83
84
86
KOTAKBANK
640
644
648
652
655
LT
1,569
1,583
1,601
1,615
1,634
M&M
845
855
864
874
882
MARUTI
1,325
1,338
1,354
1,367
1,383
NTPC
163
166
167
170
171
ONGC
275
278
280
283
284
PNB
823
832
841
849
859
POWERGRID
116
118
120
122
123
RANBAXY
519
524
529
535
540
RELIANCE
826
832
840
845
853
RELINFRA
519
528
545
554
570
SAIL
83
84
86
87
89
SBIN
2,196
2,218
2,248
2,270
2,300
SESAGOA
168
170
172
173
176
SIEMENS
701
705
709
713
717
STER
98
99
100
100
101
SUNPHARMA
664
680
690
706
716
TATAMOTORS
259
263
268
272
276
TATAPOWER
105
106
108
109
110
TATASTEEL
392
397
403
407
414
TCS
1,264
1,280
1,292
1,308
1,321
WIPRO
375
378
381
384
387
3
Daily Technical Report
October 01, 2012
Research Team Tel: 022 - 39357800
DISCLAIMER
This document is solely for the personal information of the recipient, and must not be singularly used as the basis of any investment
decision. Nothing in this document should be construed as investment or financial advice. Each recipient of this document should make
such investigations as they deem necessary to arrive at an independent evaluation of an investment in the securities of the companies
referred to in this document (including the merits and risks involved), and should consult their own advisors to determine the merits and
risks of such an investment.
Angel Broking Limited, its affiliates, directors, its proprietary trading and investment businesses may, from time to time, make
investment decisions that are inconsistent with or contradictory to the recommendations expressed herein. The views contained in this
document are those of the analyst, and the company may or may not subscribe to all the views expressed within.
Reports based on technical and derivative analysis center on studying charts of a stock's price movement, outstanding positions and
trading volume, as opposed to focusing on a company's fundamentals and, as such, may not match with a report on a company's
fundamentals.
The information in this document has been printed on the basis of publicly available information, internal data and other reliable
sources believed to be true, but we do not represent that it is accurate or complete and it should not be relied on as such, as this
document is for general guidance only. Angel Broking Limited or any of its affiliates/ group companies shall not be in any way
responsible for any loss or damage that may arise to any person from any inadvertent error in the information contained in this report.
Angel Broking Limited has not independently verified all the information contained within this document. Accordingly, we cannot testify,
nor make any representation or warranty, express or implied, to the accuracy, contents or data contained within this document. While
Angel Broking Limited endeavours to update on a reasonable basis the information discussed in this material, there may be regulatory,
compliance, or other reasons that prevent us from doing so.
This document is being supplied to you solely for your information, and its contents, information or data may not be reproduced,
redistributed or passed on, directly or indirectly.
Angel Broking Limited and its affiliates may seek to provide or have engaged in providing corporate finance, investment banking or
other advisory services in a merger or specific transaction to the companies referred to in this report, as on the date of this report or in
the past.
Neither Angel Broking Limited, nor its directors, employees or affiliates shall be liable for any loss or damage that may arise from or in
connection with the use of this information.
Note: Please refer to the important `Stock Holding Disclosure' report on the Angel website (Research Section). Also, please refer to the
latest update on respective stocks for the disclosure status in respect of those stocks. Angel Broking Limited and its affiliates may have
investment positions in the stocks recommended in this report.
Research Team
Shardul Kulkarni
-
Head - Technicals
Sameet Chavan
-
Technical Analyst
Sacchitanand Uttekar
-
Technical Analyst
Mehul Kothari
-
Technical Analyst
Ankur Lakhotia
-
Technical Analyst
Angel Broking Pvt. Ltd.
Registered Office: G-1, Ackruti Trade Centre, Rd. No. 7, MIDC, Andheri (E), Mumbai - 400 093.
Corporate Office: 6th Floor, Ackruti Star, MIDC, Andheri (E), Mumbai - 400 093. Tel: (022) 3952 6600
Sebi Registration No: INB 010996539
4